SIMULATION AND ANAL YSIS OF THE EFFECT OF SPRUCE BUDWORM ON FOREST CARBON DYNAMICS : NEW TRIPLEX-INSECT MODEL DEVELOPMENT AND APPLICATIONS
THE SIS PRESENTED
AS A PARTIAL REQUIREMENT
FOR THE PH. D. IN ENVIRONMENTAL SCIENCES
BY ZELINLIU
SIMULATION ET ANALYSE DE L'EFFET DE LA TORDEUSE DES
BOURGEONS DE L'ÉPINETTE SUR LA DYNAMIQUE DU
CARBONE FORESTIER: DÉVELOPPEMENT ET APPLICATIONS
D'UN NOUVEAU MODÈLE TRIPLEX-INSECTE
THÈSE
PRÉSENTÉE
COMME EXIGENCE PARTIELLE
DU DOCTORAT EN SCIENCES DE L'ENVIRONNEMENT
PAR
ZELINLIU
Avertissement
La diffusion de cette thèse se fait dans le respect des droits de son auteur, qui a signé le formulaire Autorisation de reproduire et de diffuser un travail de recherche de cycles supérieurs (SDU-522 - Rév.07 -2011 ). Cette autorisation stipule que «conformément à l'article 11 du Règlement no 8 des études de cycles supérieurs, [l'auteur] concède à l'Université du Québec à Montréal une licence non exclusive d'utilisation et de publication de la totalité ou d'une partie importante de [son] travail de recherche pour des fins pédagogiques et non commerciales. Plus précisément, [l'auteur] autorise l'Université du Québec à Montréal à reproduire, diffuser, prêter, distribuer ou vendre des copies de [son] travail de recherche à des fins non commerciales sur quelque support que ce soit, y compris l'Internet. Cette licence et cette autorisation n'entraînent pas une renonciation de [la] part [de l'auteur] à [ses] droits moraux ni à [ses] droits de propriété intellectuelle. Sauf entente contraire, [l'auteur] conserve la liberté de diffuser et de commerciali~er ou non ce travail dont [il] possède un exemplaire.»
(NSERC) Discovery Grant.
1 would like to gratefully and sincerely thank my supervisor, Dr. Changhui Peng, for his guidance, patience, and understanding during my Ph.D. study at the Université du Québec à Montréal (UQAM). 1 wish to thank my co-supervisor Dr. Daniel Kneeshaw. 1 would like to extend the special thanks to the other two members of my supervisory committee, Dr. Timothy Work (Université du Québec à Montréal) and Dr. Jean-Noël Candau (Canadian Forest Service, Great Lakes Forestry Centre) for sharing their wisdom and enthusiasm. Special thanks to Dr. Louis De Grandpré (Canadian Forest Service, Lauren tian F orestry Centre) for data support and great manuscript comments.
1 also appreciate the friendship and support ofmembers of the Laboratory ofEcological Modelling and Carbon Science. 1 am thankful to numerous colleagues for discussion and manuscript comments. Special thanks to Dr. Brian Doonan for his help on English editing. 1 would like to thank Grenier Héon David for his translation help. 1 wish to thank Ms. Marie-Claude Lambert for supplying the climate data used in this analysis. 1 also would like to thank the entire Institut des Sciences de l'Environnement, UQAM, for providing an outstanding academie environment and supporting efforts.
Finally and most important! y, 1 would like to thank my dear wife Cong Liu. Her support, encouragement, patience, love, and sacrifice made this work and everything else in my life possible. 1 greatly thank my parents, who have al ways supported, encouraged, and believed in me during these hard years.
This dissertation is comprised of five chapters (three main articles) that present and discuss the effects of spruce budworm on carbon dynamics in the boreal forest of Québec. All three papers involved in the dissertation are my original contributions to my Ph.D. study in Environmental Sciences at Université du Québec à Montréal.
Chapters I and V are the general introduction and general conclusion, respectively. Chapters II to IV are correspondingly based on the following three publications: 1. Liu, Z., Peng, C., De Grandpré, L., Candau, J.N., Zhou, X. and Kneeshaw, D., 2018.
Development of a New TRIPLEX-Insect Model for Simulating the Effect of Spruce Budworm on Forest Carbon Dynamics. Forests, 9(9), p.513.
2. Liu, Z., Peng, C., De _Grand pré, L., Candau, J .N ., Work, T., Huang, C. and Kneeshaw, D., 2019. Simulation and analysis of the effect of spruce budworm outbreak on carbon dynamics in boreal forests of Québec. Ecosystems, Under review. 3. Liu, Z., Peng, C., De Grandpré, L., Candau, J.N., Work, T., Zhou, X. and Kneeshaw,
D., 2019. Simulation and evaluation the efficacy of aerial spraying on carbon dynamics under spruce budworm disturbances. In prep.
Appendix I is the result of my Ph.D. comprehensive exam, which must be completed by Ph.D. candidates and is to answer a topical question indirectly related to their dissertation. This paper is:
4. Liu, Z., Peng, C., Work, T., Candau, J.N., DesRochers, A. and Kneeshaw, D., 2018. Application of machine-learning methods in forest ecolo gy: recent progress and future challenges. Environmental Reviews, 26(4), pp.339-350.
I developed all hypotheses with my Ph.D. supervisor, Dr. Changhui Peng and co-supervisor Dr. Daniel Kneeshaw. I designed the new insect disturbances sub-model under the framework of TRIPLEX 1.0 and programmed the model code with C++
as well as wrote the three manuscripts (first author) and the dissertation. Dr. Louis De Grandpré, Dr. Timothy Work and Dr. Jean-Noël Candau constantly advised and discussed with me about my Ph.D. project, and commented on earl y versions of the manuscripts and this dissertation. Dr. Chunbo Huang discussed and commented on the data analyzed for Chapter III and Chapter IV. Dr. Xiaolu Zhou helped to explain the model code and discussed the programming problems. Dr. Louis De Grandpré also compiled the stand data (i.e. forest, defoliation and mortality data) used in Chapter II. Ms. Marie-Claude Lambert provided the climate data used in Chapters III. All coauthors contributed comments and suggestions, greatly improving the quality of the papers.
LIST OF FIGURES ... ix
LIST OF TABLES ... xiv
RÉSUMÉ ... xvii
ABSTRACT ... xviii
CHAPTER I GENERAL INTRODUCTION ... 1
1.1. Background ... 1
1.1.1. Boreal forests and natural disturbances ... 1
1.1.2. The roles of spruce budworm on boreal forests ... 3
1.2. MODELING INSECT DISTURBANCES ... 5
1.2.1. Modeling insect outbreaks ... 5
1.2.2. Modeling the influence of insect disturbances on forest carbon dynamics .. 7
1.3. General questions and hypotheses ... 8
1.4. Thesis stïuctwe and specifie ûbjectives ... 9
1.5. Study area ... 1 0 1.6. References ... 12
CHAPTER II DEVELOPMENT OF A NEW TRIPLEX-INSECT MO DEL FOR SIMULATING THE EFFECT OF SPRUCE BUDWORM ON FOREST CARBON DYNAMICS ... 19
2.1. Résumé ... 20
2.2. Abstract ... 21
2.3. Introduction ... 22
2.4.2. Model development ... 25
2.4.3. Sensitivity Experiments ... 32
2.5. Results ... 33
2.5.1. Model Validation ... 33
2.5.2. Sensitivity Analysis ... 35
2.5.3. Effects of Defoliation on Carbon Fluxes and Stocks ... 36
2.5.4. Prediction ofMortality and NEP with Different Defoliation Scenarios .... 39
2.6. Discussion ... 40
2.6.1. Impact of Defoliation Intensity and Duration ... 40
2.6.2. Model Performance, Limitations, and Future Research ... 42
2.7. Conclusions ... 44 2.8. Au thor contributions ... 44 2.9. Founding ... 45 2.1 O. Acknowledgements ... 45 2.11. Supplementary materials ... 45 2.12. References ... 46
CHAPTER III SIMULATION AND ANALYSIS OF THE EFFECT OF A SPRUCE BUDWORM OUTBREAK ON CARBON DYNAMICS IN BOREAL FORESTS OF QUÉBEC ... 56
3.1. Résumé ... 57
3.2. Abstract ... 58
3.3. Introduction ... 59
3.4.2. Modeling ... 62
3.5. Results ... 67
3.5.1. Defoliation and Tree Mortality ... 67
3.5.2. Changes in C Fluxes ... 71 3.5.3. Changes in C Stocks ... 74 3.6. Discussion ... 76 3.7. Conclusions ... 80 3.8. Acknowledgements ... 81 3.9. Supplementary materials ... 81
3.9.1. Step 1: Production of forest map ... 81
3.9.2. Step 2: Integration of climate data and soil carbon data ... 83
3.9.3. Step 3: Simulation of carbon dynamics ... 84
3.10. References ... 88
CHAPTER IV AERIAL SPRAYING OF SPRUCE BUDWORM LEADS TO ENVIRONMENTAL BENEFITS OF REDUCED CARBON LOSSES ESPECIALLY IN FIR DOMINATED FORESTS ... 96
4.1. Résumé ... 97
4.2. Abstract ... 98
4.3. Introduction ... 99
4.4. Methods ... 101
4.4.1. Study Area ... 101 4.4.2. Data Collection and Sampling ... 1 04 4.4 .3. TRIPLEX-Insect Model ... 1 06
4.5. Results ... 108
4.5.1. Efficacy ofBtkApplication on Defoliation Reduction ... 108
4.5.2. The Effect of Aerial Spraying on Carbon Fluxes ... 114
4.5.3. The Effect of Aerial Spraying on Wood Volume and Carbon Stocks ... 115
4.6. Discussion ... 117
4.6.1. Different species impact the efficacy of Aerial Spraying ... 117
4.6.2. Different stages of outbreak impact the efficacy of Aerial Spraying ... 118
4.6.3. Different frequency of spraying impact the e:fficacy of Aerial Spraying. 118 4.7. Conclusions ... 119
4.8. Acknowledgements ... 119
4.9. Supplementary materials ... 120
4.10. References ... 125
CHAPTER V GENERAL CONCLUSIONS AND FUTURE DIRECTIONS ... 132
5.1. Summary of findings ... 132
5.1.1. The model development and validation ... 132
5.1.2. The effect ofspruce budworm outbreak on forest carbon dynamics ... 133
5.1.3. The effect of aerial spraying on forest carbon under spruce budworm disturbances ... 134
5 .2. Modellimitations and future works ... 134
5 .2.1. Insect Population dynamics ... 13 5 5.2.2. Compensatory mechanisms ... 135
5.4. References ... 137
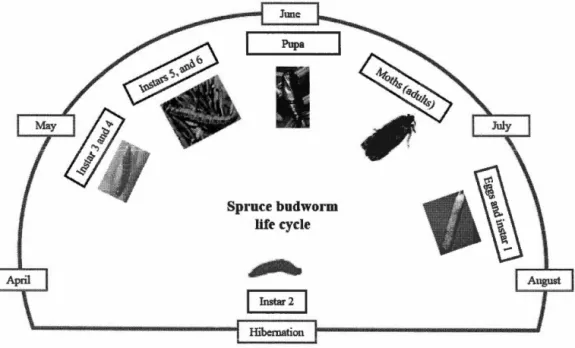
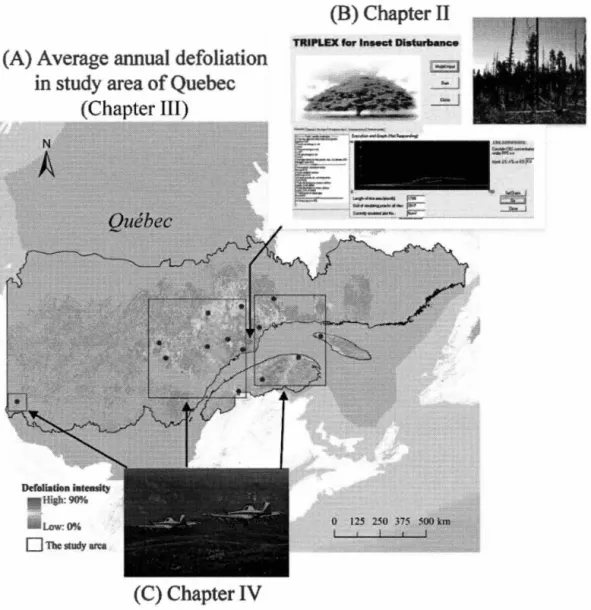
Figure 1. 1. Life cycle of the spruce budworm. Photos of spruce budworm stages are from the following sources: Rauchfuss and Ziegler (20 11), and the website of the Southem Interior Forest Region (www.for.gov.bc.ca!ris/foresthealth/ guide/WSBW.html, accessed on 19 December, 20 18) ... 4 Figure 1. 2. The structure of dissertation ... 10 Figure 1. 3. Study area. A, Average annual defoliation in study area of Quebec from 2007-2017; B, the model interface and the image of defoliated forest (from https://www.forestpests. org/vd/116.html); and C, an image of aerial spraying (from http://www.sopfim.qc.ca/en/ photo-gallery.html) ... 11 Figure 2.1. Framework and flow chart ofTRIPLEX-Insect model (modified from Peng
et al. 2002). Rectangles represent pools or state variables; ovals represent simulated processes; diamond-shaped boxes represent judgment process; dotted lines represent controls; and solid lines represent carbon (C), nitrogen (N), and water flow ... 26 Figure 2.2. Comparison of observed and simulated values of (A) tree mortality (%), and (B) the current annual volume increment (CAl) (cm3 year-1) ... 33 Figure 2.3. Simulated annual NEP started from different stand ages (41, 101 or 161 years) under two different durations of outbreaks (1 0 or 20 years) and five different defoliation scenarios (no defoliation (control), 20% AD, 40% AD, 60% AD, and 80% AD). AD denotes annual defoliation. (A) Short-Young; (B) Short-Mature; (C) Short-Old; (D) Long-Young; (E) Long-Mature; and (F) Long-Old ... 36 Figure 2.4. Simulated annual GPP, NPP, and NEP under conditions of insect disturbance (red line) and no disturbance (control; green dotted line) by the TRIPLEX-Insect model using observed annual defoliation scenarios (red bar _
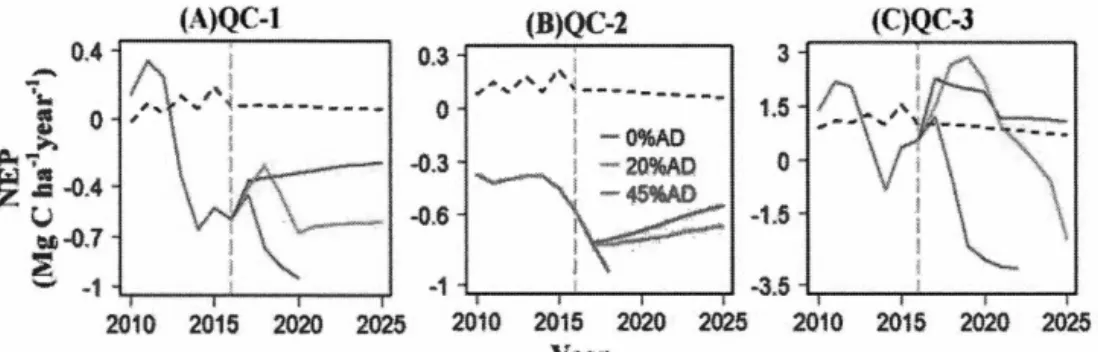
and L) plots from 2006 to 2016 ... 37 Figure 2.5. Simulated AGB (A), BGB (B), SC (C) and TL (D) on QC1, QC2 and QC3 plots from 2007 to 2017. Dotted lin es represent results for no disturbance (control) and solid lines represent results for insect disturbance. Legend: AGB-aboveground tree biomass; BGB-belowground tree biomass; SC-soi! organic carbon; TL-totallitterfall ... 38 Figure 2.6. Simulated NEP from 2010 to 2016 (on the left side of the vertical dotted line) and predicted NEP under three different defoliation levels (0% AD, 20% AD and 45% AD) from 2017 to 2025 (on the right side of the vertical gray dotted line) for the QC1 (A), QC2 (B), and QC3 (C) sites. Horizontal dotted line represent results for disturbance ( control) ... .40 Figure 3. 1. Study areas (top) and estimates of out break duration at 1 x 1 km resolution
in SBW-host dominate forests (i.e. fir, spruce, and mixed fir+spruce; 218665 km2) in Québec from2007-2017 (bottom) ... 62 Figure 3. 2. Simulation of SBW caused cumulative mortality (%)in boreal forests of
Quebec from 2007-2017. (B): :rvfortality vvas surveyed by helicopter by the
Société de protection des forêts contre le feu (SOPFEU) in the North Shore region of Que bec ... 66 Figure 3. 3. Observed annual defoliation at 1 x 1km resolution from 2007 to 2017 in
SBW host dominated forests (i.e. fir, spruce, and mixed fir+spruce; 218665 km2) in Québec. None means less than 1% annual defoliation; Light means range from 1% to 35% annual àefoliation; Ivioàerate means range from 36% to 70% annual defoliation; Severe means range from 71% to 100% annual defoliation ... 70 Figure 3. 4. Simulated GPP (A), Ra (B), NPP (C), Rh (D), NEP (E) and observed AD
(F) for different species (i.e. fir: 16349 km2
show the standard deviation with uncertainty estimates. Legend: GPP-gross primary productivity; NPP-net primary productivity;
Ra-autotrophic respiration; Rh-heterotrophic respiration; NEP-net ecosystem productivity; AD-annual defoliation ... 73 Figure 3. 5. Simulated areas of carbon source with and without SBW defoliation in
Quebec from 2007-2017. The blue line is the differences between with and without defoliation ... 7 4 Figure 3. 6. Simulated AGB (A), BGB (B), SC (C) and TL (D) for different species
(i.e. fir: 16349 km2; spruce: 27389 km2; and mixed fir+spruce: 22007 km2) from 2007 to 2017 in Québec. The shaded areas show the standard deviation with uncertainty estimates. Legend: AGB-aboveground tree biomass; BGB-belowground tree biomass; SC-soil organic carbon; TL-total litterfall ... 75 Figure 3. 7. Simulated changes ofLF, LB, LW, LCR and LFR with defoliation
compare to without defoliation from 2007 to 2017 in defoliated areas ( 657 45 km2) of Québec. Legend: LF-litter from foliage; LB-litter from fine branch; L W-litter from wood; LCR-litter from coarse root; and LFR-litter from fine root ... 76 Figure 3S.l. Illustration of the three main steps of the study ... 86 Figure 3S.2. Simulated of GPP changes between with and without defoliation at
1 x1km resolution from 2007 to 2017 in dominated forests (i.e. fir, spruce, and mixed fir+spruce; 218665 km2) of Québec ... 87 Figure 4. 1. Map showing the study areas, the locations of the 14 sample stands (i.e.
Figure 4 3. Simulations of average annual GPP (A), NPP (B), Ra (C), Rh (D) and NEP (E), and observations of average AD (F) with and without spray for all forests in Group 1 (red lines) and Group 2 (blue lines) in the year be fore, the current year and the year after spraying. Legend: GPP-gross primary productivity (103g C m-2year-1); NPP-net primary productivity (103g C m-2 year-1); Ra-autotrophic respiration (1 03g C m-2 year-1); Rh-heterotrophic respiration (103g C m-2 year-1); NEP-net ecosystem productivity (102g Cm-2 year-1); AD-annual defoliation (%) ... 11 0 Figure 4. 4. Simulations of average annual GPP (A), NPP (B), Ra (C), Rh (D) and
NEP (E), and observations of average AD (F) with and without spray for fir forests in Group 1 (red lines) and Group 2 (blue lines) in the year before, the current year and the year after spraying. Legend: GPP-gross primary productivity (103g C m-2year-1); NPP-net primary productivity (103g C m-2 year-1); Ra-autotrophic respiration (103g C m-2year-1); Rh-heterotrophic respiration (103g C m-2year-1
); NEP-net ecosystem productivity (102g
Cm-2 year-1); AD-annual defoliation (%) ... 111 Figure 4. 5. Simulations of average annual GPP (A), NPP (B), Ra (C), Rh (D) and
NEP (E), and observation of average AD (F) with and without spraying for spruce forests in Group 1 (red lines) and Group 2 (blue lines) in the year before, the current year and the year after spraying. Legend: GPP-gross primary productivity (103g C m-2year-1); NPP-net primary productivity (103g C m-2year-1); Ra-autotrophic respiration (103g C m-2year-1); Rh-heterotrophic respiration (103g C m-2year-1); NEP-net ecosystem
NEP (E), and observation of average AD (F) with and without spray for mixed fir+spruce forests in Group 1 (red lines) and Group 2 (blue lines) in the year before, the current year and the year after spraying. Legend: GPP-gross primary productivity (1 03g C m-2 year-1
); NPP-net primary productivity (103g C m-2year-1); Ra-autotrophic respiration (103g C m-2 year-1
); Rh-heterotrophic respiration (103g C m-2year-1); NEP-net
ecosystemproductivity (102g C m-2year-1);AD-annual defoliation(%). 113
Figure 4. 7. Simulations of average total VOL (A), AGB (B) and BGB (C) with and without spray for fir, spruce and mixed fir-spruce in the year before, the current year and the year after spraying. Legend: VOL- merchantable volume (m3 ha-1
); AGB-aboveground biomass (1 02g C m-2);
in Canada from 1997 to 2016 by insects (data from National F orestry
Database, Canadian Council of Forest Ministers 2018) ... 2 Table 2.1. Stand location, soil type, and observed defoliation of the balsam fir study
sites in the North Shore region of Québec, Canada ... 25 Table 2.2. Monthly distribution of annual defoliation (AD) in May, June, and July
based on the mean temperature in May ... 28 Table 2.3. Key parameter values used in simulations of the TRIPLEX-Insect model.
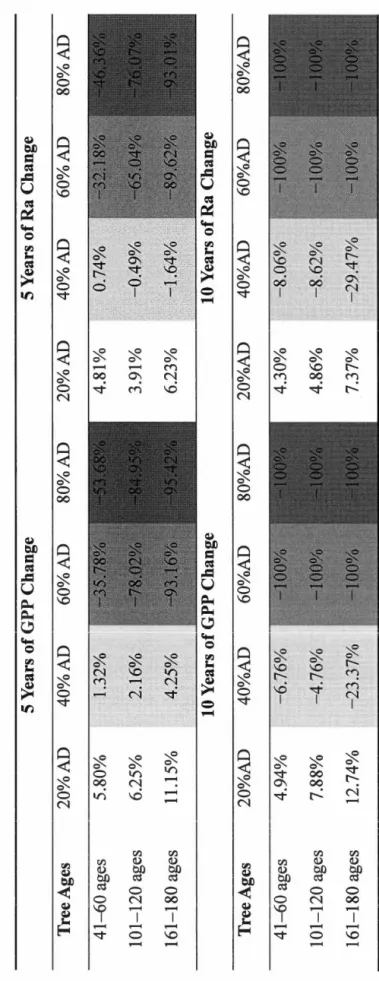
Parameters including Etas, EtaCR, EtaF, and EtaFR during endemie periods are based on the default values in TRIPLEX 1.0. For alpha carbon (Ca), EtaF, and EtaFR, severe defoliation was defined when LAI in December was less than 20% of LAI in J anuary during the same year. For NM and CM, severe defoliation means DM greater than 0.03 ... 30 Table 2.4. Simulated total changes of GPP and Ra at 5 years and 10 years after the
beginning of an outbreak compared to no defoliation (control) in the balsam fir forest. AD denotes annual defoliation ... 34 Table 3. 1. Ranges for the TRIPLEX-Insect parameters used in the uncertainty
calculation of simulated carbon dynamics. Note: BF is fir; FS is mixed fir+spruce; and SPis spruce ... 67 Table 3. 2. Observation and simulation of average mortality of boreal forests (i.e. fir,
fir+spruce and spruce) at North Shore region of Québec in 2015 and 2016.68 Table 3. 3. Changes correspond to the difference between simulations of scenarios
with and without spruce budworm for BF (fir: 16349km2), FS (fir+spruce: 22007~rn2), SP (spruce: 27390~1112) and total forest (65746km2) in Québec. Legend: NEP-net ecosystem productivity; GPP-gross primary
Rh-heterotrophic respiration; AGB-aboveground tree biomass; BGB-belowground tree biomass; SC-soil organic carbon; TL-totallitterfall ... 72 Table 3S. 1. Observed defoliation for BF (fir), FS (mixed fir+spruce), SP (spruce) and total of fir and spruce forest in Québec. All average value were estimated by total defoliated areas during 2007-2017 ... 84 Table 3 S. 2. Observed defoliated area and intensity in the total fir and spruce forests
in Que bec from 2007 to 201 7. The percentage of defoliated areas was estimated by using the total forest area (218665 km2) in this study; the value of average cumulative defoliation and the value of average annual
defoliation were estimated using total defoliated areas (65746 km2) from 2007-2017; the value of average current defoliation was estimated using the total current defoliated area. Classes of current defoliated areas are as
follows: Low is 1~33%; Moderate is 34~66%; and High is 67~100% ... 85 Table 3 S. 3. Observed defoliated areas and percentage of current defoliated areas in
different species forests (i.e. BF is fir forest; FS is fir-spruce mixture forest; and SPis spruce forest) from 2007 to 2017 in Quebec ... 86 Table 4.1. Observed number of cells* and average age of sites on Québec before
spray for earlier spray sites (Group 1 in 2010) and later spray sites (Group 2
in 2015) ... 102 Table 4. 2. Observed number of cells* and average age offir, spruce and mixed
fir+spruce forests before spray for earlier spray sites (Group 1 in 2010) and later spray sites (Group 2 in 2015) ... 106 Table 4. 3. Simulation ofaverageADosn (% year-1), GPPosn (102g C m-2year-1),
NPPosn (102g C m-2year-1), Raosn (102g C m-2year-1), NEPosn (102g C m-2 year-1), Rhosn (1 02g C m-2 year-1), VOLosn (m3 ha-1), AGBosn (1 06g C ha-1) and BGBosn (1 06g C ha-1) for fir, spruce, mixed fir+spruce and total forests
before to the years following spraying). Note: GPP-gross primary
productivity; NPP-net primary productivity; Ra-autotrophic respiration; NEP-net ecosystem productivity; Rh-heterotrophic respiration; VOL-merchantable volume; AGB-aboveground biomass; BGB-belowground biomass. DSn is the value compare the differences between before and after spray protection for forests with and without aerial spray. n is the number of years after spraying ... 1 09
Table 4S. 1. Values of key parameters used in simulations of the TRIPLEX-Insect model. Note: BF refers to fir; FS refers to fir+spruce; and SP refers to
spruce ... 120
Table 4S. 2. Regression results for AD ... 121
Table 4S. 3. Regression results for GPP ... 122
Table 4S. 4. Regression results for NPP ... 123
Les épidémies de tordeuses des bourgeons de 1' épinette ( Choristoneura fumiferana (Clemens), Lepidoptera: Tortricidae, TBE) jouent un rôle important dans la forêt boréale de 1' Amérique du Nord. La dynamique du carbone au sein de ces écosystèmes forestiers s'en trouve sévèrement affectée, les pertes en couvert forestier reliées à la défoliation et à la mortalité se chiffrant en millions de kilomètres carrés.
L'objectif général de ce projet est d'améliorer la compréhension et la quantification de l'impact des insectes sur la dynamique du carbone forestier. Spécifiquement, (1) un nouveau modèle basé sur un processus (TRIPLEX-Insect) a été développé pour quantifier 1' effet des épidémies de TBE sur les flux de carbone forestier pour le sapin baumier (Abies balsamea (L.) Mill.). (2) En utilisant le modèle TRIPLEX-Insect combiné avec des données de parcelles d'inventaire forestier, des bases de données géospatiales, des données climatiques mensuelles et des données séquentielles de défoliation spatialement explicites, nous simulons et comparons la dynamique et les changements au niveau du carbone dans les forêts de la province de Québec sans et avec perturbation par la TBE sur une superficie de 65,746 km2. (3) Le modèle a été
ultérieurement utilisé pour évaluer la quantité de carbone pouvant être conservé au Québec en procédant à un épandage aérien d'insecticide (Bacillus thuringiensis ssp. Kurstaki- Btk) durant la période de 2010 à 2017.
Le modèle a été validé avec des données de mortalité observée dans la région de la Côte-Nord au Québec de même que par des données publiées de croissances volumique annuelle actuelle (CAl) pour l'île du Cape Breton en Nouvelle-Écosse au Canada. En comparaison à la simulation sans défoliation, la moyenne nette en productivité écosystémique (NEP) avec défoliation a diminuée de 91±7.3 g C m-2année-1 dans 65,746 km2 d'aire forestière défoliée au Québec de 2007 à 2017, alors que cette aire était de 21,046 km2 et a été convertie en source de carbone en 2017. Cette étude démontre aussi que les peuplements de sapins baumiers plus jeunes perdent moins de carbone que les peuplements d'épinettes ou les peuplements mixte de sapin baumier et d'épinette. De plus, l'épandage aérien s'est avéré être une bonne méthode de sauvegarde de carbone sous perturbation par la TBE. L'année subséquente au traitement d'épandage, la NEP moyenne des forêts traitée a augmentée de 0.59 g Cm-2year-1 en· comparaison aux forêts sans traitement. Les résultats ont aussi démontrés que davantage de carbone peut être conservé dans les peuplements de sapin baumier que dans ceux d'épinette et mixtes de sapin baumier et d'épinette.
En somme, le modèle TRIPLEX-Insect s'avère être un outil très utile pour assister les initiatives de gestion des épidémies d'insectes forestiers. Celui-ci s'applique bien pour la quantification de la dynamique du carbone de même qu'à l'évaluation de l'efficacité de l'épandage aérien lors d'épidémies de TBE.
Mots clés : mortalité des arbres, perturbations naturelles, productivité nette de l'écosystème, défoliation cumulative, sapin baumier, processus de photosynthèse
Spruce budworm (Choristoneura fumiferana (Clemens), Lepidoptera: Tortricidae, SBW) outbreaks play an important role in the boreal forests of North America. Carbon (C) dynamics in these forest ecosystems are severely affected by SBW outbreaks due to millions of square kilometers of forest loss from defoliation and mortality.
The overall aim of this research is to improve our quantitative understanding of the impact of insect disturbances on forest carbon dynamics. Especially, (1) a novel process-based model (TRIPLEX-Insect) was developed to quantify the effect of SBW outbreaks on forest carbon fluxes for balsam fir (Abies balsamea (L.) Mill.). (2) Using the TRIPLEX-Insect combined with forest inventory plots, geospatial databases, monthly climate data, and spatially explicit defoliation sequence data, we simulated carbon dynamics and changes between scenarios with and without SBW disturbances for 65,746 km2 of Québec. (3) The model has been further used to evaluate how much carbon would be saved by aerial spraying (i.e. a biological insecticide: Bacillus thuringiensis ssp. Kurstaki -- Btk) during 2010,-2017 in Québec.
The model was validated against observed mortality in the North Shore region of Québec and published current annual volume increment (CAl) in the Cape Breton Island in Nova Scotia, Canada. Compared to simulations without defoliation, the average net eco system productivity (NEP) with defoliation decreased by 91± 7.3 g C m-2year-1 in 65,746 km2 defoliated areas of Québec from 2007 to 2017. While there were 21,046 km2 of defoliated areas converted from C sink to source in 2017. This study also found that younger balsam fir stands lost less C than either spruce or mixed fir-spruce stands during the period of SBW outbreak 2007-2017 in Québec. Moreover, the aerial spraying was a good way to save C during the SBW attacks. In the year following spraying average NEP with spraying protection increased 0.59 g C m-2
year-1 more than without spraying. The results also showed more C to be saved in balsam
fir than either spruce or mixed fir+spruce forests in the year following spraying. Overall, the TRIPLEX-Insect model is a useful tool for informing forest insect management initiatives. It can be applied to quantify the carbon dynamics as well as to evaluate the efficacy of aerial spray during spruce budworm out breaks.
Keywords: tree mortality, natural disturbances, net ecosystem productivity, cumulative defoliation, balsam fir, photosynthesis process
CHAPTERI
GENERAL INTRODUCTION
1.1. Background
1.1.1. Boreal forests and natural disturbances
Boreal forests contain 33% of the world's forest cover and a large portion of the Earth's boreal region lies in Canada (28% or 552 million hectares) (Brandt et al., 2009 and2013). Boreal forests play a key role and strongly impact the global carbon cycle through the exchange of carbon between the atmosphere and terrestrial ecosystems (Apps et al., 1999; Chapin et al., 2008) and have been estimated store about 60-70 Pg of carbon (Bonan 2008; Pan et al., 2011; Peh et al., 2015). It is well known that biogenic fluxes of carbon occur mainly through the abosorption of
co2
by plants (photosynthesis pro cesses) and the carbon emission return to the atmosphere by autotrophic and heterotrophic respiration (decomposition processes) (Amiro et al., 2010). However, boreal forest ecosystems in Canada are subject to a variety of natural ecosystem disturbances, such as wildfire, insect outbreak, windthrows, drought, etc. These ecosystem disturbances cause changes in forest composition, forest structure, forest photosynthesis and landscape patterns (Seidl et al., 20 18). Furthermore, the se natural disturbances also affect carbon sequestration, biodiversity and future timber supply (Boucher et al., 2018). Forecasting future natural disturbances under a global change context is also critical in international conformation strategy programs (Boulanger et al., 2016).Wildfire is the most important natural disturbance in Canada. From 1998 to 2017, 2.4 million hectares per year of forest area burned on average in Canada (Canadian Council of Forest Ministers 2018). The area burned annually in Canadian forests ranges from 626,420 hectares in 2001 to 4,614,287 hectares in 1998. Fire disturbance is mainly driven by sorne factors such as weather, forest composition (fuel) and fire control response policies (Lagerquist et al., 2017). Although only 3%
of fires exceed 200 hectares of area, they account for more than 95% of the total area bumed in Canada (Stocks et al., 2003). As a result, large-scale wildfire may
lead to reductions of the carbon sink in boreal forests of Canada (Lamberty et al.,
2007). Research in Canada has reported that wildfire may be directly responsible for average carbon emissions of27±6 Tg/year in the forest from 1959-1999 (Amiro
et al., 2001).
Table 1.1. Summed area of moderate to severe damage (including beetle-killed trees) in Canada from 1997 to 2016 by insects (data from National F orestry Database, Canadian Council of Forest Ministers 2018).
Insect Area (ha) % of total area
disturbed by insect
Spruce budworm 44,793,145 15
Forest te nt caterpillar 83,597,574 28
Mountain pine beetle 80,460,054 27
Large aspen tortrix 22,659,243 7
Others 70,129,084 23
Total 301,639,100 100
After fire; insect outbreaks are the second most important natural disturbance in Canadian forests. The large areas of tree mortality or reduced tree growth that result from insect outbreaks have significant effects on the carbon cycle of Canada boreal forests. Over the 1997-2016 period currently reported by the national forestry database (Canadian Council of Forest Ministers 2018), the area ofmoderate-severe defoliation averaged 15 million hectares per year in Canada. Unlike wildfire, insect disturbances are selective and can cycle with a given periodicity. During outbreak periods, insects can cause more damage and carbon loss in a given area than fire. For example, forest tent caterpillar (Malacosoma disstria Hübner Lepidoptera: Lasiûcampidae) defûliatiûn caused the largest summed area over 20 years ûf disturbance at 83 million hectares (Table 1.1 ). By 2007, the mountain pine beetle
(Dendroctonus ponderosae Hopkins, Coleoptera: Curculionidae) out break was the
that year. Kurz et al., (2008a) reported that the cumulative effect of the mountain pine beetle outbrak will be 270 Mt carbon in the affected region of Canada from 2000 to 2020. The most damaging outbreaking insect pests typically undergo population increases over several years, reach a peak, and then decline to endemie levels (Hicke et al., 2012). Knowlwdge on the area defoliated and tree mortality is the first step to estimate the effects of insect outbreaks on forest ecosystems and carbon dynamics (MacLean 2016).
In order to control damage by defoliating insects, biological insecticides were used on over 2 million hectares ofboreal forest from 2006 to 2016, in Canada (Canadian Council of Forest Minister 2018). Bacillus thuringiensis ssp. Kurstaki (Btk), which is the most popular biological insecticide, has been used to protect forests affected by insect disturbances over the last four decades in Canada (Fuentealba et al., 20 15). Protection programs aim not only maintain a trees' current-year foliage (e.g. 50% in Québec) but also ensure tree survival and . reduce timber losses during pest outbreaks (van Frankenhuyzen et al., 2016). Furthermore, aerial spray programs can help forest managers protect the carbon sequestration capacity of Canadian forests (Fuentealba et al., 2019).
1.1.2. The roles of spruce budworm on boreal forests
The spruce budworm (Choristoneura fumiferana (Clemens), Lepidoptera: Tortricidae) is the major biotic disturbance in boreal forests of eastern North America (Bognounou et al., 2017). From 1997 to 2016, spruce budworm outbreaks defoliated a summed area exceeding 44 million hectares of Canadian forests (Table 1.1 ), of which there were about 19 million hectares in Québec (Canadian Council ofF orest Ministers 20 18). For behavioral and ecological reasons, the species that are the most vulnerable to the spruce budworm in descending order are balsam fir
(A hies bals ame a (L.) Mill.), white spruce (Pi ce a glauca (Moench) Voss ), red spruce
(Picea rubens Sarg) and black spruce (Picea mariana (Mill.) B.S.P.) (Hennigar et
al., 2008). One of the most cited reasons for the greater vulnerability of balsam fir
the timing of bud break) (Rauchfuss and Ziegler 2011). The insect usually is multivoltine (i.e. it has a one year life-cycle) (Figure 1.1 ). The spruce budworm prefers current year foliage as well as feeding on staminate flowers (Blais 1958). Defoliation of the most photosynthetically productive current year foliage causes a number of changes within host trees, such as rebalancing cabonhydrate storage in different tree compartments (i.e. stem, foliage and roots ). Tree strategies to res pond to defoliation include re building photosynthetic capacity (Mac Lean 20 16). However, after 5-6 consecutive years of severe defoliation, mortality is observed in balsam fir, followed by white spruce and then red spruce and then black spruce (MacLean 1980; Erdle and MacLean 1999). In addition, forests with mixtures of host species alter the vulnerability of the hosts compared to pure forests (Bognounou et al., 2017). For instance, black spruce is more susceptible to spruce budworm damage when surrounded by fir neighbours.
Spruce budwol'm life cycle
-·
JJJMbo
1 Instar 2 1Figure 1. 1. Life cycle of the spruce budworm. Photos of spruce budworm stages are from the following sources: Rauchfuss and Ziegler (20 11), and the website of the Southem Interior Forest Region (www.for.gov.bc.ca/ris/foresthealthlguide/ WSB W.html, accessed on 19 December, 20 18)
The outbreak cycles of spruce budworm are longer than most other defoliating species (e.g. forest tent caterpillar, etc) (Myers and Cory 2013). Outbreaks are generally synchronized within the region and occur on 30-40 years intervals in eastern Canada (Pureswaran et al., 2015). The outbreak phase can last 5-15 years during which time the population density increases over severa! orders of magnitude (Morris 1963; Boulanger and Arseneault 2004 ). Defoliation by reducing tree growth and increasing tree mortality, results in large timber and economie losses. For instance, most of forests of Québec suffered spruce budworm defoliation from the 1960s to 1990s (Nealis 2015; Navarro et al., 2018) and resulted in 250 million m3 of wood-fiber losses (Grondin et al., 1996) and $12.5 billion in lost revenue (Coulombe et al., 2004). Moreover, spruce budworm outbreaks also have a great influence on forest carbon budgets over broad areas. During outbreaks, extensive tree mortality reduces the carbon uptake of forests and increases carbon emissions from the decay of dead trees (Dymond et al., 2010). This represents an important mechanism by which insect outbreaks may reduce the capability of boreal forests to absorb and store atmospheric carbon (Kurz et al., 2008b ).
1.2. MODELING INSECT DISTURBANCES
Challenges for evaluating the impact of insect, including spruce budworm, and forest response to climate changes in managed forests include quantifying the effects of different forest management strategies on carbon dynamics under insect attacks, and predicting annual defoliation at stand or landscape scales in the future. Using forest simulation models is an effective way to understand the long-term responses of forested landscapes to a given spruce budworm disturbance outbreak scenario (Hicke et al., 2012; MacLean 2016; Boulanger et al., 2016; Meyer et al., 2018).
1.2.1. Modeling insect outbreaks
The current modelling of spruce budworm disturbances is mainly based on two different areas of study: ( 1) mode ling budworm's population biology and dynamics;
and (2) building relationships between defoliation and forest response (i.e. tree growth, mortality and carbon dynamics) (Sturtevant et al., 2015).
Researchers have modeled spruce budworm's population dynamics and biological processes in order to evaluate and provide guideance for insect population management. Indeed, understanding insect population dynamics is critical step in simulating temporal and spatial patterns of outbreaks (Régnière et al., 2012). Spruce budworm outbreaks have temporal periodicity but strong randomness in the spatial distribution of annual defoliation. Because adult insects (i.e. moths) are able to both actively and passively disperse through short-distant and long-distance flights using wind currents to boost long-distance dispersal the trajectory of this process cannot be captured (Sturtevant et al., 2013). For example, contrasting defoliation out break patterns ( e.g. cumulative defoliation ranging from least to most severe) occured across New Bruswick (Zhao et al., 2014). Therefore, there is an important challenge to accurately predicting and simulating the spatial distribution and intensity of annual defoliation of insect population dynamics. This limitation also affects most population dynamics models ( e.g. Fleming 1996; 2002; Régnière and Nealis 2007; Candau and Fleming 2011; Régnière et al., 2012).
Actually, defoliation is a function of insect numbers but it is easier to oberve and record directly than predicted based on population dynamics. Furthermore, tree growth reduction and mortality are strongly related to annual and cumulative defoliation of spruce budworm over severa! consecutive years ( e.g. Ostaff and MacLean 1995; Zhao et al., 2014). Therefore, researchers have built defoliation-growth reduction and defoliation-mortality relationship models to optimiz and reduce the impact of spruce budworm outbreaks on timber supply and carbon sequestration. For example, the Spruce Budworm Decision Support System (SBWDSS) is a feasible and valuable model for simulating the effects of budworm disturbances on tree growth, mortality, and timber supply (Erdle 1989; MacLean et
al., 2001; Hennigar et al., 2007). Landscape disturbance and succession (LDSM)
models have also been used to help forest managers evaluate the long-term and large-scale effects of spruce budworm outbreaks on forest dynamics ( e.g. vegetation
change, neighborhood effects, etc) (Scheller and Mladenoff 2007; James et al., 2011).
1.2.2. Modeling the influence of insect disturbances on forest carbon dynamics
Although challenges remain in the development of fully integrated predictive models of outbreaks, the carbon dynamic models can be used to study how insect defoliation may impact forest carbon dynamics across stand and landscape scales. In Canada, the Carbon Budget Model of the Canadian Forest Sector (CBM-CFS3) has been used in the past to simulate carbon dynamics (i.e. carbon fluxes and stocks) under different scenarios of defoliation and management practices in the boreal forest (Kurz et al., 2008b; 2009). For example, Hennigar and MacLean (2010) suggested that the CBM -CFS3 mo del can be a pp lied to identify the quantity of insecticide application that would lead to carbon sequestration compared to a scenario without pest and forest management. Based on results from the CBM-CFS3 model, it was found that the spruce budworm is able to significantly convert the forest from a carbon sink to a source over large regions (Dymond et al., 2010). In addition, Chen et al., (2016) integrated CBM-CFS3 into the Carbnon and Nitrogen coupled Canadian Land Surface Scheme (CN-CLASS) and used this method to estimate the effects of climate variability and insect disturbance on carbon dynamics over 6275 ha of boreal forest in eastern Canada from 1928 to 2008. Moreover, combining GIS and forest models could also have severa! benefits for forest insect assessment and management (Senf et al., 2017). Foster (2011) used LANDIS-II, which is a spatially interactive forest succession and disturbance model (Scheller and Mladenoff 2004), and remote sensing analyses to simulate long-term changes in forest carbon under insect defoliation. They found that understanding the spatial variability of disturbance intensity will enable us to more accurately quantify and simulate the impact of defoliation on carbon accumulation at the landscape-level.
Empirical models (i.e. CBM-CFS3, LANDIS-II) do not help us well understand the relationship between insect disturbances and carbon dynamics. Therefore, we need
more process-based models to study the impacts of defoliation on forest carbon dynamics. For example, Meyer et al., (2018) applied the 3-PG model to simulate
the influence of mountain pine beetle disturbance on net ecosystem productivity (NEP) at the stand level. They suggeted that the management approach of not harvesting disturbed forests is beneficiai for carbon recovery and the carbon balance of boreal forest ecosystems. Landry et al., (2016) used the Integrated Biosphere
Simulator (IBIS) process-based model to find that there is a stronger effect on outbreak severity than outbreak retum interval for mountain pine beetle.
1.3. General questions and hypotheses
There are three primary knowledge gaps in the research of the role of spruce budworm outbreaks on forest carbon dynamics. First, there is little known about the responses of carbon fluxes and stocks following different outbreak duration and intensity. Second, there is a lack of understanding of the effect of spruce budworm outbreaks on carbon dynamics for different host species. Third, high uncertainties exist as to the effect of forest management strategies on the protection of carbon sequestration in boreal forests during insect outbreaks.
In order to better understand the effect of spruce budworm disturbances on forest
carbon dynamics, it is necessary to answer the following two questions:
(1) What features of insect outbreak can be quantified in the process-based models?
(2) Can we estimate the potential impact of spruce budworm outbreaks on forest carbon budgets?
In this dissertation, 1 hypothesize that (1) spruce budworm disturbance will reduce the capacity of carbon sequestration for balsam fir and spruce forests; (2) pure balsam fir forests willlose more carbon than either pure spruce or mixed fir+spruce forests during the same period of spruce budworm outbreak across large regional areas; (3) forest management strategies such as aerial spraying with insecticide
could bene fit the carbon budgets of boreal forest as well as reduce the risk of wood losses to insect outbreaks.
1.4. Thesis structure and specifie objectives
In this dissertation, there are three manuscripts related to the investigation of the impacts of spruce budworm disturbances on carbon dynamics (i.e. carbon fluxes and stocks) of boreal forest in Québec. Chapters I and V are the general introduction and the general conclusion, respectively. The main structure of this thesis is shown
in Figure 1.2.
The specifie objectives of this dissertation are as follows:
1) Chapter II: Develop a novel process-based TRIPLEX sub-model to quantify the effects of forest carbon dynamics in response to spruce budworm out breaks in balsam fir at the stand level; and validate this model against mortality data and published current annual volume increment (CAl) data.
2) Chapter III: use the newly developed TRIPLEX-Insect model, based on TRIPLEX 1.0 in Chapter II, to quantify and analyse the effects of spruce budworm outbreaks from 2007 to 2017 on carbon fluxes (i.e. gross primary productivity, net primary productivity, autotrophic respiration, heterotrophic respiration and net ecosystem productivity) and stocks (i.e. aboveground biomass, belowground biomass, soil organic and total litterfall) at a regional scale in boreal forests of Québec.
3) Chapter IV: quantify how much carbon could be maintained by aerial spraying protection by comparing the differences in carbon dynamics between forest management strategies with and without aerial spray protection for three different forest compositions of host species (balsam fir, spruce, and mixed fir+spruce) during the period of spruce budworm out breaks.
1
Chapter III:
Chapter I: Introduction to insect disturbances and forest
carbon dynamics Chapter II: Development and validation ofthe TRIPLEX-Insect model at the stand scale
1 Chapter IV: Simulation of forest
carbon dynamics under spruce budworm outbreaks
at the regional scale
Aerial spraying of spruce budworm leads to environmental benefits of
reduced carbon losses esoeciall
v
in fir dominated1
ChapterV: General conclusions,
limitations and future works
Figure 1. 2. Structure of the dissertation.
1
1.5. Study area
This study is conducted in different forested area of Québec using available data to respond to the different objectives (Figure 1.3). Chapter II was based on three balsam fir sites in the North Shore region of Québec. The mean annual temperature
and the mean annual precipitation is 1.7°C and 1001mm, respectively, from 1981 to 2010.
(A)
Average annual defoliation
in
study area of Que bec
(Chapter III)
Defoliation intensity .Hi!~h: 900/o
df
i&l111Low: 0"/o 0 Tbe study arca
(C) Chapter IV
(B) Chapter II
TRIPLEX' for lnsect DisturbanceFigure 1. 3. Study area for each of the chapters. The figure introductions are as follows: (A), Average annual defoliation in study area ofQuebec from 2007-2017; (B), the model interface and the image of defoliated forest (from https://www. forestpests.org/vd/116.html); and (C), an image of aerial spraying (from http://www. sopfim.qc.ca/en/photo-gallery.html ).
Chapter III focused on 218,665 km2 of balsam fir-spruce forests in Québec. While Chapter IV estimated fourteen sample units located in various regions of the study area in Chapter III. The dominate species include balsam fir, black spruce, white
spruce and red spruce. The mean annual temperature varied from 1 to 3 °C. Precipitation is generally range 800-1 OOOmm.
Note: This thesis is written as a collection ofpublished or submitted peer-reviewed journal articles. Consequently, there is little overlap in the texts between the General Introduction, General Conclusion and the main body of the Chapters.
1.6. References
Amiro, B.D., Todd, J.B., Wotton, B.M., Logan, K.A., Flannigan, M.D., Stocks, B.J., Mason, J.A., Martell, D.L. and Hirsch, K.G. (2001). Direct carbon emissions from Canadian forest fires, 1959-1999. Canadian Journal of
Forest Research, 31(3), 512-525.
Amiro, B.D., Barr, A.G., Barr, J.G., Black, T.A., Bracho, R., Brown, M., Chen, J., Clark, K.L., Davis, K.J., Desai, A.R. and Dore, S. (2010). Ecosystem carbon dioxide fluxes after disturbance in forests of North America. Journal of
Geophysical Research: Biogeosciences, 115(G4).
Apps, M.J., Kurz, W.A., Beukema, S.J. and Bhatti, J.S. (1999). Carbon budget of
the Canadian forest product sector. Environmental Science & Policy, 2(1 ),
25-41.
Blais, J.R. (1958). The vulnerability of balsam fir to spruce budworm attack in north western Ontario, with special reference to the physiological age of the tree. The Forestry Chronicle, 34(4), 405-422.
Bognounou, F., De Grandpré, L., Pureswaran, D.S. and Kneeshaw, D. (2017). Temporal variation in plant neighborhood effects on the defoliation of prîmary and secondary hosts by an insect pest. Ecosphere, 8(3), e01759. Bonan, G.B. (2008). Forests and climate change: forcings, feedbacks, and the
climate benefits offorests. Science, 320(5882), 1444-1449.
Boucher, D., Boulanger, Y., Aubin, 1., Bernier, P. Y., Beaudoin, A., Guindon, L. and Gauthier, S. (2018). Current and projected cumulative impacts of fire,
drought, and insects on timber volumes across Canada. Ecological
Applications, 28(5), 1245-1259.
Boulanger, Y. and Arseneault, D. (2004). Spruce budworm outbreaks in eastern Quebec over the last 450 years. Canadian Journal of Forest Research, 34(5), 1035-1043.
Boulanger, Y., Gray, D.R., Cooke, B.J. and De Grandpré, L. (2016). Model-specification uncertainty in future forest pest outbreak. Global change
bio/ogy, 22(4), 1595-1607.
Brandt, J.P. (2009). The extent of the North American boreal zone. Environmental
Reviews, 17(NA), 101-161.
Brandt, J.P., Flannigan, M.D., Maynard, D.G., Thompson, I.D. and Volney, W.J.A. (2013). An introduction to Canada's boreal zone: ecosystem processes, health, sustainability, and environmental issues. Environmental Reviews, 21(4), 207-226.
Canadian Council of Forest Ministers. (2018). National forestry database: pest control. Canadian Council of Forest Ministers. Natural Resources Canada, Canadian Forest Service, Ottawa, Ontario, Canada. Available from http://nfdp.ccfm.org/ [accessed 15 December 2018].
Chapin, F.S., Randerson, J.T., McGuire, A.D., Foley, J.A. & Field, C.B. (2008). Changing feedbacks in the climate-biosphere system. Frontiers in Eco/ogy
and the Environment, 6, 313-320
Chen, B., Arain, M.A., Chen, J.M., Croft, H., Grant, R.F., Kurz, W.A., Bernier, P., Guindon, L., Priee, D. and Wang, Z. (2016). Evaluating the impacts of climate variability and cutting and insect defoliation on the historical carbon dynamics of a boreal black spruce forest landscape in eastern Canada.
Ecological Mode/ling, 321, 98-109.
Coulombe, G., Huot, J., Arsenault, J., Bauce, E., Bernard, J.T., Bouchard, A., Liboiron, M.A. and Szaraz, G. (2004). Commission d'étude sur la gestion de la forêt publique québécoise. Bibliothèque nationale du Québec. 307p Dymond, C.C., Neilson, E.T., Stinson, G., Porter, K., MacLean, D.A., Gray, D.R.,
may create a carbon source in eastern Canadian forests. Ecosystems, 13(6),
917-931.
Erdle TA. (1989). Concept and practice of integrated harvest and protection design in the management of eastern spruce fi r forests. PhD thesis, University of New Brunswick.
Erdle, T.A. and MacLean, D.A. (1999). Stand growth madel calibration for use in forest pest impact assessment. The Forestry Chronicle, 75(1), 141-152.
F aster JR. (20 11). Forest insect defoliation patterns and carbon dynamics: Linking remote sensing with simulation models. Dissertation, University of Wisconsin-Madison
Fuentealba, A., Bauce, É. and Dupont, A. (20 15). Bac ill us thuringiensis efficacy in reducing spruce budworm damage as affected by host tree species. Journal of Pest Science, 88(3), 593-603.
Fuentealba, A., Dupont, A., Hébert, C., Berthiaume, R., Quezada-Garcia, R. and Bauce, É. (20 19). Comparing the efficacy of various aerial spraying scenarios using Bacillus thuringiensis to protect trees from spruce budworm defoliation. Forest Ecology and Management, 432, 1013-1021.
Grondin, P., Ansseau, C., Bélanger, L., Bergeron, J.F., Bergeron, Y., Bouchard, A., Brisson, J., De Grandpré, L., Gagnon, G., Lavoie, C. and Lessard, G. (1996). Écologie forestière. Manuel de foresterie. Edited by J. Bérard and M. Côté. Presses de l'Université Laval, Sainte-Foy, Qué, 133-279.
Hennigar, C.R., MacLean, D.A., Porter, K.B. and Quiring, D.T. (2007). Optimized harvest planning under alternative foliage-protection scenarios to reduce volume lasses to spruce budworm. Canadian Journal of Forest Research,
37(9), 1755-1769.
Hennigar, C.R., MacLean, D.A., Quiring, D.T. and Kershaw Jr, J.A. (2008).
Differences in spruce budworm defoliation among bal sam fir and white, red, and black spruce. Forest Science, 54(2), 158-166.
Hennigar, C.R. and MacLean, D.A. (2010). Spruce budworm and management effects on forest and wood product carbon for an intensively managed forest.
Hicke, J.A., Allen, C.D., Desai, A.R., Dietze, M.C., Hall, R.J., Hogg, E.H.T., Kashian, D.M., Moore, D., Raffa, K.F., Sturrock, R.N. and Vogelmann, J. (2012). Effects ofbiotic disturbances on forest carbon cycling in the United States and Canada. Global Change Biology, 18(1), 7-34.
James, P.M., Fortin, M.J., Sturtevant, B.R., Fall, A. and Kneeshaw, D. (2011). Modelling spatial interactions among fire, spruce budworm, and logging in the boreal forest. Ecosystems, 14( 1 ), 60-7 5.
Kurz, W.A., Dymond, C.C., Stinson, G., Rampley, G.J., Neilson, E.T., Carroll, A.L., Ebata, T. and Safranyik, L. (2008a). Mountain pine beetle and forest carbon feedback to climate change. Nature, 452(7190), 987.
Kurz, W.A., Stinson, G., Rampley, G.J., Dymond, C.C. and Neilson, E.T. (2008b). Risk of natural disturbances makes future contribution of Canada's forests to the global carbon cycle highly uncertain. Proceedings of the National
Academy of Sciences, 105(5), 1551-1555.
Kurz, W.A., Dymond, C.C., White, T.M., Stinson, G., Shaw, C.H., Rampley, G.J., Smyth, C., Simpson, B.N., Neilson, E.T., Trofymow, J.A. and Metsaranta, J. (2009). CBM-CFS3: a model of carbon-dynamics in forestry and land-use change implementing IPCC standards. Ecological Modelling, 220( 4), 480-504.
Lagerquist, R., Flannigan, M.D., Wang, X. and Marshall, G.A. (2017). Automated prediction of extreme fire weather from synoptic patterns in northem Alberta, Canada. Canadian Journal of Forest Research, 47(9), 1175-1183. Landry, J.S., Parrott, L., Priee, D.T., Ramankutty, N. and Matthews, H.D. (2016).
Modelling long-term impacts of mountain pine beetle outbreaks on merchantable biomass, ecosystem carbon, albedo, and radiative forcing. Biogeosciences, 13(18), 5277-5295.
Mac Lean, D .A. (1980). Vulnerability of fir-spruce stands during uncontrolled spruce budworm outbreaks: a review and discussion. The Forestry Chronicle, 56(5), 213-221.
MacLean, D.A., Erdle, T.A., MacKinnon, W.E., Porter, K.B., Beaton, K.P., Cormier, G., Morehouse, S. and Budd, M. (2001). The spruce budworm decision
support system: forest protection planning to sustain long-term wood supply.
CanadianJournal of Forest Research, 31(10), 1742-1757.
Mac Lean, D .A. (20 16). Impacts of insect out breaks on tree mortality, productivity, and stand development. The Canadian Entomologist, 148(81), S138-S159. Meyer, G., Black, T.A., Jassal, R.S., Nesic, Z., Coops, N.C., Christen, A., Fredeen,
A.L., Spittlehouse, D.L., Grant, N.J., Foord, V.N. and Bowler, R. (2018). Simulation of net ecosystem productivity of a lodgepole pine forest after mountain pine beetle attack using a modified version of 3-PG. Forest
Eco/ogy and Management, 412, 41-52.
Morris, R.F. (1963). The dynamics of epidemie spruce budworm populations. The
Memoirs of the Entomological Society ofCanada, 95(S31), 1-12.
Myers, J.H. and Cory, J.S. (20 13). Population cycles in forest Lepidoptera revisited.
Annual Review of Ecolo gy, Evolution, and Systematics, 44, 565-592.
Navarro, L., Morin, H., Bergeron, Y. and Girona, M.M. (2018). Changes in spatiotemporal patterns of 20th century spruce budworm outbreaks In eastern Canadian boreal forests. Frontiers in Plant Science, 9, 1-15.
Nealis, V. G. (2015). Comparative ecology of conifer-feeding spruce budworms (Lepidoptera: Tortricidae). The Canadian Entomologist, 148(S1), S33-S57. Ostaff, D.P. and MacLean, D.A., 1995. Patterns ofbalsam fir foliar production and growth in relation to defoliation by spruce budworm. Canadian Journal of
Forest Research, 25(7), 1128-1136.
Pan, Y., Birdsey, R.A., Fang, J., Houghton, R., Kauppi, P.E., Kurz, W.A., Phillips, O.L., Shvidenko, A., Lewis, S.L., Canadell, J.G. and Ciais, P. (2011). A large and persistent carbon sink in the world's forests. Science, 333(6045), 988-993.
Peh, K.S.H., Corlett, R.T. and Bergeron, Y. eds. (2015). Routledge Handbook of Forest Ecolo gy. Routledge.
Peng, C., Jiang, H., Apps, M.J. & Zhang, Y. (2002). Effects of harvesting regimes on carbon and nitrogen dynamics of boreal forests in central Canada: a process model simulation. Ecological Modelling, 155, 177-189.
Pureswaran, D.S., De Grandpré, L., Paré, D., Taylor, A., Barrette, M., Morin, H., Régnière, J. and Kneeshaw, D.D. (2015). Climate-induced changes in host tree-insect phenology may drive ecological state-shift in boreal forests.
Eco/ogy, 96(6), 1480-1491.
Rauchfuss, J. and Ziegler, S.S. (2011). The geography ofspruce budworm in eastern North America. Geography Compass, 5(8), 564-580.
Régnière, J., St-Amant, R. and Duval, P. (2012). Predicting insect distributions under climate change from physiological responses: spruce budworm as an example. Biological Invasions, 14(8), 1571-1586.
Scheller, R.M. and Mladenoff, D.J. (2004). A forest growth and biomass module for a landscape simulation model, LANDIS: design, validation, and application. Ecological Mode/ling, 180, 211-229.
Scheller, R.M. and Mladenoff, D.J. (2007). An ecological classification of forest landscape simulation models: tools and strategies for understanding broad-scale forested ecosystems. Landscape Eco/ogy, 22(4), 491-505.
Seidl, R., Klonner, G., Rammer, W., Essl, F., Moreno, A., Neumann, M. and Dullinger, S. (2018). Invasive alien pests threaten the carbon stored in Europe's forests. Nature Communications, 9(1), 1626.
Senf, C., Seidl, R. and Hostert, P. (2017). Remote sensing of forest insect disturbances: current state and future directions. International Journal of
Applied Earth Observation and Geoinformation, 60, 49-60.
Stocks, B.J., Mason, J.A., Todd, J.B., Bosch, E.M., Wotton, B.M., Amiro, B.D., Flannigan, M.D., Hirsch, K.G., Logan, K.A., Martell, D.L. and Skinner, W.R. (2003). Large forest fires in Canada, 1959-1997. Journal of
Geophysical Research, 1 08(D 1 ), FFR5-1.
Sturtevant, B.R., Achtemeier, G.L., Chamey, J.J., Anderson, D.P., Cooke, B.J. and Townsend, P.A. (2013). Long-distance dispersal of spruce budworm (Choristoneura fumiferana Clemens) in Minnesota (USA) and Ontario (Canada) via the atmospheric pathway. Agricultural and Forest
Sturtevant, B.R., Cooke, B.J., Kneeshaw, D.D. and MacLean, D.A. (2015). Modeling insect disturbance across forested landscapes: insights from the spruce budworm. In Simulation Modeling of Forest Landscape Disturbances (pp. 93-134). Springer, Cham.
van Frankenhuyzen, K., Lucarotti, C. and Lavallée, R. (2016). Canadian contributions to forest insect pathology and to the use of pathogens in forest pest management. The Canadian Entomologist, 148(S1), S210-S238. Zhao, K., MacLean, D.A., and Hennigar, C.R. (2014). Spatial variability of spruce
budworm defoliation at different scales. Forest Eco/ogy and Management, 328, 10-19
CHAPTERII
DEVELOPMENT OF A NEW TRIPLEX-INSECT MODEL FOR SIMULATING THE EFFECT OF SPRUCE BUDWORM ON FOREST
CARBON DYNAMICS
Zelin Liu, Changhui Peng, Louis De Grandpré, Jean-Noël Candau, Xiaolu Zhou,
and Daniel Kneeshaw
2.1. Résumé
La tordeuse des bourgeons de 1' épinette (TBE) défolie et induit de la mortalité chez les conifères, affectant conséquemment les échanges de carbone (C) entre la surface terrestre et l'atmosphère. Nous avons développé un nouveau sous-modèle TRIPLEX-Insect pour quantifier l'impact des épidémies d'insecte sur les flux de C. Nous avons modélisé la défoliation annuelle (DA), la défoliation cumulative (DC) et la mortalité des arbres. Le modèle a été validé avec des données de mortalité observée et des données publiées à 1' échelle du peuplement pour la région de la Côte-Nord du Québec et de l'île du Cape Breton en Nouvelle-Écosse au Canada. Les résultats suggèrent que TRIPLEX-Insect performe très bien dans l'évaluation suivant une épidémie de TBE et sous-estime légèrement la croissance volumique annuelle actuelle (CAA). Dans les forêts matures et immatures, la simulation du modèle suggère une plus grande réduction en productivité primaire brute (PPB) qu'en respiration autotrophique (Ra) pour un même niveau de défoliation lorsque la mortalité des arbres est faible. Suite à une épidémie de TBE, la reprise de croissance des arbres survivants contribuent à la restauration de la productivité écosystémique annuelle nette (PEN) basée sur l'âge de la forêt si la mortalité n'est pas excessive. Dans l'ensemble, le modèle TRIPLEX-Insect a la capacité de simuler la dynamique du C du sapin baumier suivant une perturbation par la TBE et peut être utilisé en tant qu'outil efficace dans la gestion des insectes forestiers.
2.2. Abstract
The spruce budworm (SBW) defoliates and kills conifer trees, consequently affecting carbon (C) exchanges between the land and atmosphere. Here, we developed a new TRIPLEX-Insect sub-model to quantify the impacts of insect outbreaks on forest C fluxes. We modeled annual defoliation (AD), cumulative defoliation (CD), and tree mortality. The model was validated against observed and published data at the stand level in the North Shore region of Québec and Cape Breton Island in Nova Scotia, Canada. The results suggest that TRIPLEX-Insect performs very well in capturing tree mortality following SBW outbreaks and slightly underestimates current annual volume increment (CAl). In both mature and immature forests, the simulation model suggests a larger reduction in gross primary productivity (GPP) than in autotrophic respiration (Ra) at the same defoliation level when tree mortality was low. After an SBW outbreak, the growth release of surviving trees contributes to the recovery of annual net ecosystem productivity (NEP) based on forest age if mortality is not excessive. Overall, the TRIPLEX-Insect model is capable of simulating C dynamics of balsam fir following SBW disturbances and can be used as an efficient tool in forest insect management.
2.3. Introduction
Spruce budworm (Choristoneurafumiferana (Clemens), Lepidoptera: Tortricidae) (SBW) outbreaks play a key role in the dynamics of eastern North America's boreal and temperate forest biome (Ludwig et al., 1978; Fleming et al., 2002; Gray 2013; Mac Lean 20 16). In recent centuries, SBW out breaks have occurred cyclically every 30--40 years in eastern North America (Boulanger et al., 2012) with a new outbreak beginning in 2006 (Aires infestees par la tordeuse des bourgeons de 1' epinette au Québec en 2017). Balsam fir (Abies balsamea (L.) Mill.), an important conifer in Canada's boreal forest, is also the tree species most vulnerable to SBW (MacLean 1996; Hennigar et al., 2008; Zhao et al., 2014; MacLean 2016). A modification of carbon (C) exchanges occurs in balsam fir forests during outbreaks as the defoliator destroys photosynthetic tissues, resulting in a reduction of tree growth and an increase in mortality (Richards 1993; Pothier and Mailly 2006; Dymond et al., 2010).
Defoliation varies with SBW population density and can be measured in terms of annual defoliation (AD) incurred. SBW mainly consumes foliage produced in the current year. Given that needles typically remain on the tree for five to six years, it can take many years for the SBW to kill a tree, especially at moderate or low defoliation levels (i.e., when not all foliage produced within a given year is consumed) (Sainte-Marie 2016). The last SBW outbreak started in the 1970s and 1980s in eastern North America, continued for almost two decades and was considered extremely severe (e.g., 80%-100% annual defoliation) (Gray et al., 2000). Tree defoliation and ultimately mortality vary greatly between stands during an outbreak as well as between outbreaks themselves (Kneeshwa and Bergeron 2016). Older stands are more vulnerable than younger, more vigorous stands (Hennigar et al., 2008a). Generally, C dynamics and insect disturbances lead to temporary changes in environmental conditions. However, insect outbreaks can cause long-term changes to ecosystem structure and function (Seidl et al., 2011; Goetz et al., 2012; Flower and Conzalez-Meler 2015), which can result in long-tenu impacts in C dynamics. We therefore need to better understand how insect
outbreaks interact with stand structure ( e.g., how defoliation severity and duration interact with stand age) to improve our estima tes of forest C !osses and our understanding of regional and global C cycles.
Modeling is a complementary tool to traditional observation and experimental approaches that can provide long-term and large spatial-scale perspectives on the effects of forest insect epidemies as weil as evaluate interactions among multiple factors (Landry et al., 20 16). In recent years, there are sorne studies that have been conducted on C dynamics following insect outbreaks (Hicke et al., 2012; Flower et al., 2013). For example, Albani et al. (2010) used an ecosystem demography model in conjunction with a stochastic model to predict the impact of hemlock woolly adelgid (Ade/ge tsugae, Armand) on C dynamics in the eastern United States. Medvigy et al. (20 12) also simulated a linear decrease in net eco system productivity (NEP) with increasing defoliation intensity by the gyspsy moth (Lymantria dispar L.). In addition, Edburg et al. (2011) used the Community Land Model version 4 (CLM4) to simulate coupled C and nitrogen (N) dynamics following mountain pine beetle (Dendroctonus ponderosae (Hopkins), Coleoptera: Curculionidae, Scolytinae) outbreaks in the western United States of America. They found that the severity of the outbreak itselfwas an important factor which led to the initial decline in NEP, and required 80 to 100 years or more following the disturbance to recover. However, because CLM4 does not explicitly contain an age-class distribution model for trees, the impact of tree age on C dynamics following insect out breaks is not known. In Canada, the Carbon Budget Model of the Canadian Forest Sector (CBM-CFS3) has been used to simulate and forecast ecosystem C dynamics impacted by SBW disturbances (Kurz et al., 2008; Dymond et al., 2010; Hennigar and MacLean 20 1 0). Such studies found that a decrease in NEP may con vert boreal forests from C sinks into C sources after SBW outbreaks. However, CBM-CFS3 is an empirically driven model that is not designed to estimate gross primary productivity (GPP) and respiration in forest ecosystems. It is therefore unable to exp lain in detail the flow of C dynamics under such conditions.