Introduction
Most current research in the consumer choice literature deal with brand choice. However, understanding patronage patterns in grocery stores is relevant for various reasons. First of all, what happens at store level may have consequences at brand level, because the type of shopping trip acts as a contextual cue, inducing particular choice behaviours; more specifically, store-patronage behaviour may influence brand choice, purchase timing, as well as deal-proneness (Bucklin and Lattin, 1991; Kahn and Schmittlein, 1992; Grover and Srinivasan, 1992; Mulhern and Padgett, 1995). Secondly, the retail sector has a considerable and growing importance in modern economies, and retail units managers may benefit from a deeper understanding of store-patronage behaviour.
Building on previous research, we focus on a key aspect of store-patronage which has not been fully investigated so far: the light-trip behaviour (i.e., frequent shopping trips for small amounts). More precisely, we raise three research questions: do we detect a 2 to 4 days peak in the shopping patterns, as Kahn and Schmittlein (1989) did, and do light trips specifically account for this phenomena? Further, what are the correlates of light-trip behaviour? And finally, is a segmentation scheme based on light-trip behaviour meaningful and relevant?
In this study, we replicate some of the main conclusions of recent research on store-patronage behaviour (Kahn and Schmittlein, 1989; East, Lomax, Willson and Harris, 1994; Uncles, 1995; Leszczyc and Timmernans, 1997). We also extend these results, as we account for the effect of geographical separation and selected household psychographics (i.e., self-reported involvement toward shopping and attitude toward sales promotion).
We first present a conceptual model of light-trip behaviour (section1). We then detail the methodology (section 2) and expose the main results of the research (section 3). We conclude this article with a discussion about the managerial relevance of the findings, as well as further research questions (section 4).
1. A conceptual model of light-trip behaviour
Store patronage has been a field of academic inquiry for decades (Uncles and Ehrenberg, 1990; Fotheringham, 1991; Brown, 1992; Laaksonen, 1993; East, Lomax, Willson and Harris, 1994; Uncles and Hammond, 1995; Mulhern, 1997). The effect of geographical separation and store
image on store choice has been established in numerous studies (e.g., Doyle and Fenwick, 1974; Arnold, Oum and Tigert, 1983; Wrigley and Dunn, 1984; Fotheringham and Trew, 1993). However, it is not the purpose of this article to review thoroughly the broad literature on store choice and store patronage. In the following, we briefly review previous research on the geographic, behavioural, demographic and psychographic antecedents of light trip behaviour, leading to the conceptual model presented in Figure 1.
Based on previous research, we expect light-trip behaviours to be negatively related to the size of the household, the income level, and loyalty to the store; we also expect inter-shopping time to be shorter for light trips compared to regular trips (Kahn and Schmittlein, 1989; Leszczyc and Timmernans, 1997). The role of store location and convenience for minor shopping trips was established by Uncles (1995); the result of this research would lead us to expect a negative relationship between distance to the store and light trip behaviour.
The role of enduring involvement toward shopping on light trip behaviour is unclear, as stronger recreational motivations are associated with higher shopping frequencies, whereas higher functional motivations are associated with lower shopping frequencies (Roy, 1994). Finally, a favourable attitude toward sales promotion (a proxy for deal proneness) should be negatively related light trip behaviour (Roy, 1994): deal prone shoppers might wait for special sales before making a visit, or might stock up on special deal items, therefore reducing the number of visits and increasing the amount bought per visit.
Figure 1 - Conceptual model Demographics
Size of the household (-) Income level (-)
Behaviorals
Previous trip is a light trip (+) Store loyalty (-) Inter-shopping time (-)
Geographics Distance to the store (-)
Psychographics
Probability of light-trip behaviour
Involvement / shopping (+ / -) Attitude / sales promotion (+)
2. Methodology of the research 2.1 The data
The data provided by SECODIP (SOFRES Group) originates from an instrumented market with scanners in all major grocery stores. Here, we consider the Château-Thierry market (Aisne,
FRANCE) where 5 discount stores ranging from 1,200 m² to 4,500 m² represent more than 90 % of the local grocery market. There are 1,043 households in the sample, who made 37,058 visits during 24 weeks (January to June 1995). Each record indicates the household identification number, the store visited, the date of the visit, the number of items purchased, and the amount spent for this particular shopping trip. Self-reported psychographic variables were measured through a questionnaire sent to the same households.
2.2 The operationalization of the variables (households and shopping trips)
Household variables – Various household-level variables were collected from the members of the panel: size of the household, income level, behavioural store loyalty, distance to the stores, enduring involvement toward shopping, and attitude toward sales promotions. The income level is computed from the income per head; while doing so, we separate the size effect from the pure revenue effect.
Store-loyalty is measured as in Leszczyc and Timmermans (1997); there could be many other ways for measuring loyalty (e.g., Jacoby and Chesnut, 1978), but this measure has the desirable property of being scaled between 0 and 1, and allow us to compare our findings to publish results. The road distance was used as a measure of geographical separation between households and stores (i.e., distance to each store, and distance to the main store - the one in which the household spend the highest share of his budget). The overall level of enduring involvement toward shopping was measured with a scale that accounts for the relevance, the attractiveness and the interest of the activity; the original enduring involvement scale (Strazziéri, 1994) was shortened into 3 items 1 and adapted to grocery shopping. The attitude toward sales promotion was measured with 2 items 2, in order to distinguish the intrinsic enjoyment of hunting for promotions (Mittal, 1994) from the « smart shopping » feeling (Schindler, 1984). The reliability of the scales is satisfactory, both for involvement toward shopping (α = 0.83) and for attitude toward sales promotions (α = 0.76).
1 These items were (indicative translation): I particularly like shopping for groceries; Shopping for groceries is an
activity to which I attribute a special importance; One can say shopping for groceries is an activity I am interested in.
2 These items were: Buying products on promotion gives me a feeling of satisfaction; Buying products on promotion is
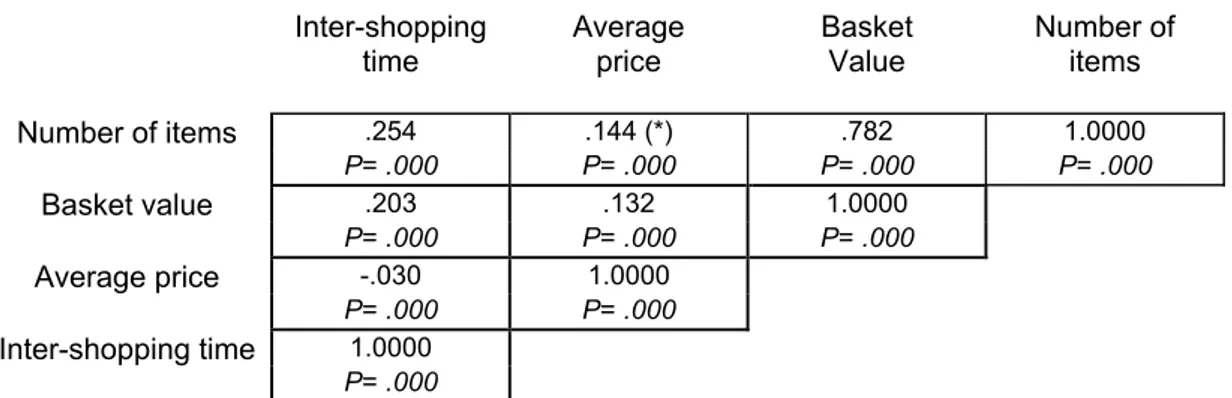
Light trips - Classification of shopping trips as light or regular trips has been shown to yield challenging results in previous research (e.g., Kahn and Schmittlein, 1989; Uncles, 1995; Leszczyc and Timmernans, 1997). A preliminary issue has been to choose a cut point to separate light from regular trips: is the cut-point computed for each household or identical across households? how many, and which characteristics should be considered to classify the shopping trips (e.g., number of items, basket value, average price)? We propose a cut-point based on the number of items purchased, and the same across the sample 3. Our definition of light trips is based on the number of items bought because this characteristic is highly correlated with basket value and weakly correlated with other characteristics of the shopping trips (see Table 1); moreover, the number of items is a one-dimensional variable, whereas basket value also captures differences in average price per item 4. The cut-point is identical for all households, because characterising a given trip as light or “regular” should not depend on the sequence of previous trips made by the household, if we are to hypothesise that trips are independent as it is postulated in most econometric models.
Table 1 - Correlation between shopping trip characteristics
Inter-shopping
time Average price Basket Value Number of items
Number of items .254 .144 (*) .782 1.0000 P= .000 P= .000 P= .000 P= .000 Basket value .203 .132 1.0000 P= .000 P= .000 P= .000 Average price -.030 1.0000 P= .000 P= .000 Inter-shopping time 1.0000 P= .000
(*) These coefficients are significant because of the number of observations used (i.e., 37,058)
Based on the distribution of the variable, we decide that light trips are baskets containing up to 10 items 5. Similar to other studies, this definition of light trips is purely ad hoc, but will yield interesting conclusions later. Based on our definition, 30 % of shopping trips are considered as light trips, which is more discriminating than other procedures published so far (circa 50 %).
3 A one-dimensional household-specific cut-point based on basket value as been retained by Kahn and Schmittlein
(1989), whereas Leszczyc and Timmermans (1997) have chosen a two-dimensional absolute cut-point based on basket value and inter-shopping time (less than 4 days); Uncles (1995) has used a multi-dimensional classification method with no a priori concerning the characteristics of the shopping trips to be retained.
4 Average prices per item have a high variance here, as supercenters sell a large variety of goods from food to
appliances etc.
3. Main results of the research
3.1 The 2 to 4 days peak in store patronage pattern and the light trips hypothesis
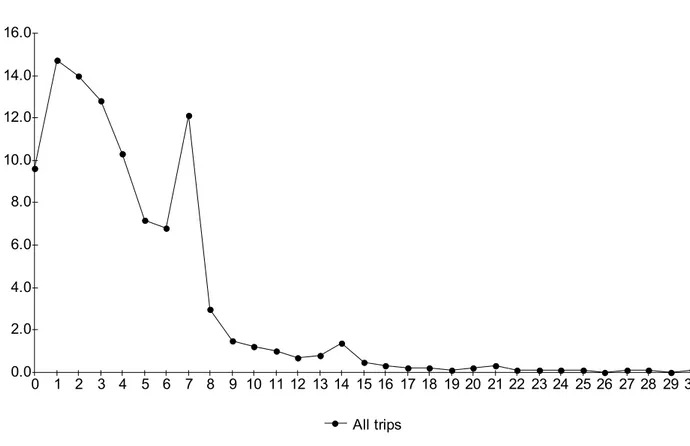
The average inter-shopping time is 4.52 days; nearly 10 % of the trips are made within the same day, 50 % are made within 3 days, and more than 87 % are made within a week from the last purchase. Similar to Kahn and Schmittlein (1989), we find inter-shopping time peaks at 2 to 4 days, 7 days, and 14 days; the major peak being between 2 and 4 days (Figure 2).
Figure 2 - Inter-shopping times (all trips)
0.0 2.0 4.0 6.0 8.0 10.0 12.0 14.0 16.0 0 1 2 3 4 5 6 7 8 9 10 11 12 13 14 15 16 17 18 19 20 21 22 23 24 25 26 27 28 29 30 All trips
Kahn and Schmittlein (1989) have shown that store patronage is very different from brand purchase, as product inter-purchasing times tend to be multiples of 7 days in the latter case. Two explanations have been proposed by these authors to account for the difference between stores and brands: shoppers show strong preferences for a given shopping day, and at least some shoppers make a number of fill-in, or light trips that would account for short inter-shopping times.
We found strong empirical support for the “day-of-the-week” hypothesis, as 43 % of the trips are made on the first favourite day, and 22 % of the trips are made on the second favourite day 6.
Compared to published results, we even find a higher loyalty toward certain days of the week (East et al., 1994).
KS proposed a second hypothesis to account for short inter-shopping times: shoppers do not shop evenly ; they make quite a lot of frequent and small trips (i.e., light trips). Our data also support the “light trips” hypothesis. Indeed, we find that average inter-shopping time are significantly shorter for light trips than for regular trips (i.e., 3.12 versus 5.12 days; difference significant at p < 0.001).
3.2 The correlates of light-trip behaviour
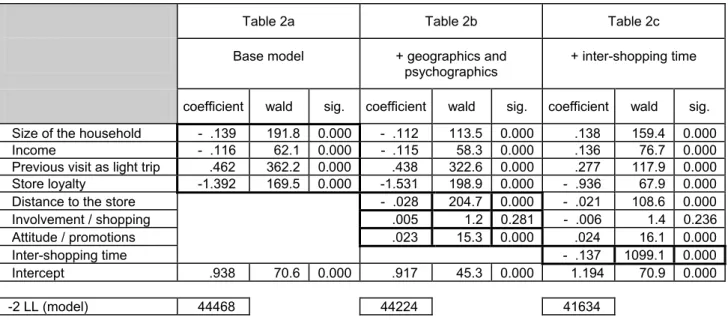
We have established that light trips are made within a shorter time span than regular trips, but this distinction has consequences on other dimensions of the trip profile; light trips are characterised (by definition) by less items bought (5.9 versus 31.6) and higher average price per item (29.8 FF versus 14.4 FF). More systematically, as each trip can be considered either “light” (coded 1) or “regular” (coded 0), we apply logistic regressions to the data. The base model (Table 2a) reveals that all variables are significant. The probability of getting a light trip is lower for larger families, higher income households, and more loyal shoppers. This probability is also higher when the previous trip was a light trip ; this suggest that light-trip behaviour is not (just) a random process. Our conclusion is similar to Kahn and Schmittlein (1989) as well as Leszczyc and Timmermans (1997), while extending their results to the impact of distance and (some) psychographics on light-trip behaviour (Table 2b). Indeed, light trips are also associated with visits to closer stores and with shoppers reporting a more favourable attitude toward promotions (we expected a negative relation).
Table 2 - Estimation of the logistic regressions for “light” versus “regular” trips Table 2a Table 2b Table 2c Base model + geographics and
psychographics
+ inter-shopping time
coefficient wald sig. coefficient wald sig. coefficient wald sig. Size of the household - .139 191.8 0.000 - .112 113.5 0.000 .138 159.4 0.000 Income - .116 62.1 0.000 - .115 58.3 0.000 .136 76.7 0.000 Previous visit as light trip .462 362.2 0.000 .438 322.6 0.000 .277 117.9 0.000 Store loyalty -1.392 169.5 0.000 -1.531 198.9 0.000 - .936 67.9 0.000 Distance to the store - .028 204.7 0.000 - .021 108.6 0.000 Involvement / shopping .005 1.2 0.281 - .006 1.4 0.236 Attitude / promotions .023 15.3 0.000 .024 16.1 0.000 Inter-shopping time - .137 1099.1 0.000 Intercept .938 70.6 0.000 .917 45.3 0.000 1.194 70.9 0.000 -2 LL (model) 44468 44224 41634
-2 LL (0) 45249 45249 45249
Chi square 781 0.000 1024 0.000 2452 0.000
The probability of getting a light trip is not related to the level of enduring involvement toward shopping (the expected relationship was unclear). Lastly, the shorter the time since the last visit, the more chances to have a light trip, and the introduction of inter-shopping times in the model noticeably improves the fit (Table 2c). These last results demonstrate explicitly the “light-trip” hypothesis proposed by Kahn and Schmittlein (1989).
Our results suggest that some shoppers have more chance to make light trips than others; we thus investigate this issue in the following (the unit of analysis now becomes the household).
3.3 The household segmentation based on shopping-trips profile
Following Kahn and Schmittlein (1989), we divide our sample into two segments on the basis of their proportion of light trips: shoppers making more light trips than regular trips are assigned to the “Lights” segment, whereas others are assigned to the “Regulars” segment. Based on this simple segmentation scheme, 11.8 % of the households belong to the Lights segment (n = 123).
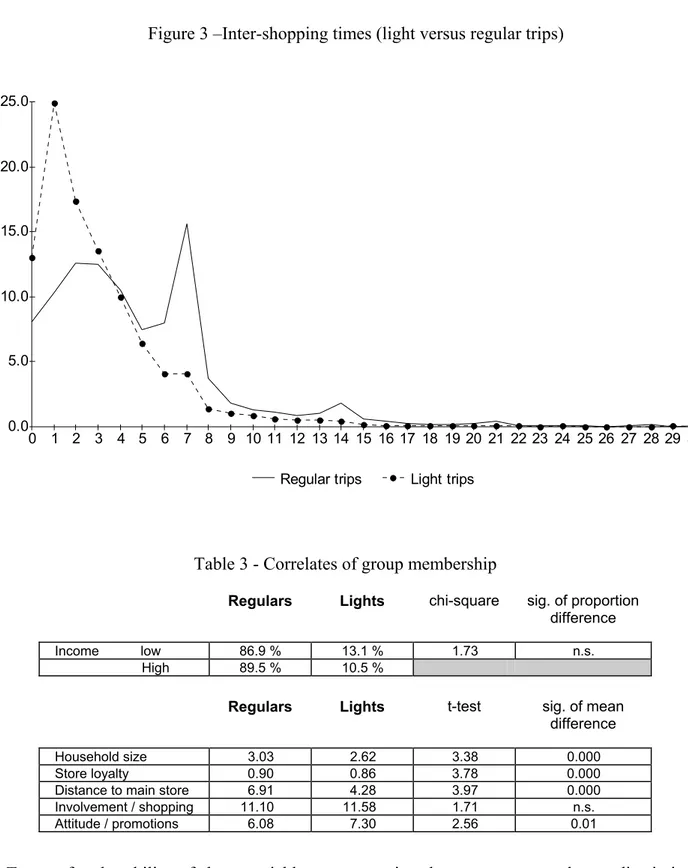
Do Lights and Regulars have effectively different store-patronage behaviours? Indeed, Lights make on average 51.4 visits a year, while Regulars make only 33.4 visits (difference significant at p < 0.001). Moreover, inter-shopping times reveal a clear-cut difference between the 2 segments (Figure 3). Lights make nearly 38 % of their trips within one day, and the peak is on the first day (24 % of the trips); afterwards the percentage of trips decreases steadily. Regulars show a slightly different pattern as 22 % of the trips are still made within one day, the peak being the 14th day (14 % of the trips). It means that Regulars also make light trips but, in the main they go shopping on a weekly basis.
This analysis gives some face validity to the segmentation scheme, insofar as we highlighted store-patronage differences between the Light and the Regular segments; nevertheless, to test for external validity, we need to establish the differences between segments on variables which have not been used at the segmentation stage (Saunders, 1994), i.e., demographics, geographics, psychographics, and other store-patronage behaviours. Further, are these differences substantial enough to discriminate between households?
Concerning the correlates of segment membership, most variables are related to the segmentation scheme, apart from the income level and the involvement construct (Table 3). Compared to Regulars, Light shoppers belong to smaller families, and are less store-loyal.
Moreover Light shoppers live closer to their main store, which encourages more frequent lighter trips. Lastly, Light shoppers report a more favourable attitude toward sales promotions.
Figure 3 –Inter-shopping times (light versus regular trips)
0.0 5.0 10.0 15.0 20.0 25.0 0 1 2 3 4 5 6 7 8 9 10 11 12 13 14 15 16 17 18 19 20 21 22 23 24 25 26 27 28 29 30
Regular trips Light trips
Table 3 - Correlates of group membership
Regulars Lights chi-square sig. of proportion difference
Income low 86.9 % 13.1 % 1.73 n.s. High 89.5 % 10.5 %
Regulars Lights t-test sig. of mean
difference
Household size 3.03 2.62 3.38 0.000 Store loyalty 0.90 0.86 3.78 0.000 Distance to main store 6.91 4.28 3.97 0.000 Involvement / shopping 11.10 11.58 1.71 n.s. Attitude / promotions 6.08 7.30 2.56 0.01
To test for the ability of these variables to categorise shoppers, we complete a discriminant analysis. We find one discriminant function (eigen value = 0.49; Wilks’ lambda statistic = 0.953, significant at p < 0.001) in which all variables enter with the expected signs ; 64.1 % of the shoppers are properly classified, the performance being very similar for Lights and Regulars. As a
conclusion, the behavioural, geographic, demographic and psychographic variables considered in this study are clearly related to light-trip behaviour; still, they are not sufficient to discriminate between Light and Regular shopper in a reliable way.
4 - Managerial implications and further research questions 4.1 – Summary
The purpose of this study was to shed light on an important aspect of store patronage i.e., light- trip behaviour. We replicated published results and extended these research while taking into account the role of distance and some psychographic on the behaviour under investigation. More specifically, we cross-validated the 2-4 days peak in overall store patronage patterns and related this peak to the presence of light trips; we then identified the correlates of these light trips and established that a segmentation scheme based on light trip behaviour has some internal and external validity. However, Light shoppers (those making more light trips than regular trips) may be somewhat difficult to discriminate. The practical relevance of this segmentation scheme is thus questioned.
4.2 - Managerial implications
We believe that segmenting shoppers on the basis of their shopping trip behaviour is relevant and achievable. This segmentation scheme is relevant in a micro-marketing perspective, as light-trip behaviours are related to other behavioural variables (e.g., store loyalty); moreover, the number of light trips (or Light shoppers) can be used as a measure of performance for managers of retail units. This segmentation scheme is achievable, as Light shoppers can be identified on the basis of their location (e.g., higher density close to the store); Light shoppers can also be detected when they use fast check-outs.
The managerial relevance of this study may raise further questions which we do not address here:
- do Light shoppers require specific services (apart from fast check-outs)?
- are Light shoppers better candidates for home-shopping (they may need more home delivery, but on the other hand, they would view shopping as a social / recreational activity) and financial services (as a high frequency of visit is consistent with regular use of banking services)?
- are Light shoppers more profitable for retailers than Regular shoppers (we suggest that belonging to smaller families and being less loyal, Light shoppers would be less profitable)?
- are store promotions more efficient with Light shoppers (we suggest that being more deal prone, Light shoppers would make more impulse purchases as demonstrated by Kahn and Schmittlein (1992), and thus would be more profitable)?
- are Light shoppers motivated by different things, and should they be attracted differently to the store, compared to Regular shoppers?
Positive answers to (some of) these questions would definitively establish the managerial appeal of a segmentation scheme based on shopping trip behaviour.
4.3 - Further research questions
Further research questions may be raised concerning our shopping trip typology, the consequences of light-trip behaviours, and the modelling of store / brand choices conditional upon the type of shopping trip.
The shopping trip typology - Firstly, the number of items is relevant to discriminate between trips, as it is highly correlated with the basket value but still, it does not account for “destination” trips i.e., a minimal number of items bought, with a high basket value (e.g., shopping for a TV set or an appliance). Secondly, are light trips made by lights shoppers similar to light trips made by regulars shoppers? In fact, a 2-segment solution may not be adequate, and more work should be done on the typology. Moreover, a conceptual definition of the various types of trips would nicely complement and support pure empirical ad hoc definition.
The consequences of light-trip behaviours - Kahn and Schmittlein (1992) have demonstrated the moderating role of the different types of shopping trip on the use of coupons, in-store displays and features. We suggest that the type of shopping trip may also have an impact on the substitution effect between product categories, thus having an huge impact on the profitability of sales promotions for retailers i.e., Light shoppers would be less prone to trade-off between categories (as they mostly visit the store for specific items) and thus impulse purchasing of deal items would not reduce the overall basket value. We also suggest that Light shoppers may have different experiences in the store, thus having different store images.
The modelling of store / brand choices conditional upon the type of shopping trip - We finally suggest that taking into account the type of shopping trip in the modelling procedure of store and
brand choices would certainly improve the predictive validity and relevance of these models. Further, the use of a latent class procedure would avoid a priori classification of the shopping trips.
References
Arnold S.J., T.H. Oum and J.D. Tigert, 1983. Determinant Attributes in Retail Patronage: Seasonal, Temporal, Regional and, International Comparisons. Journal of Marketing Research, 20, May, 149-157.
Brown S.,1992. The Wheel of Retail Gravitation. Environment and Planning A, 24, 1409-1429.
Bucklin R.E. and J.M. Lattin, 1991. A Two-State Model of Purchase Incidence and Brand Choice. Marketing Science, 10, 1, Winter, 24-39.
Doyle P. and P. Fenwick, 1974-1975. How Store Image Affects Shopping Habits in Grocery Chains. Journal of Retailing, 50, Winter, 39-52.
East R., W. Lomax, G. Willson and P. Harris, 1994. Decision Making and Habit in Shopping Times. European Journal of Marketing, 28, 4, 56-71.
Fotheringham A.S., 1991. Statistical Modeling of Spatial Choice. in Research in Marketing, JAI Press Inc, 5, 95-117. Fotheringham A.S. and R. Trew, 1993. Chain Image and Store-choice Modeling: The Effects of Income and Race.
Environment and Planning A, 25, 179-196.
Grover R. and V. Srinivasan, 1992. Evaluating the Multiple Effects of Retail Promotions on Brand Loyal and Brand Switching Segments. Journal of Marketing Research, 29, February, 76-89.
Jacoby J. and R.W. Chesnut, 1978. Brand Loyalty: Measurement and Management, New York, Ronald Press.
Kahn B.E. and D.C. Schmittlein, 1989. Shopping Trip Behavior: An Empirical Investigation. Marketing Letters, 1, 1, 55-69.
Kahn B.E. and D.C. Schmittlein, 1992. The Relationship Between Purchases Made on Promotion and Shopping Trip Behavior. Journal of Retailing, 68, 3, Fall, 294-315.
Laaksonen M., 1993. Learning about Daily Shopping Behavior in Context of Changing Retail Structures. Journal of Business Research, 28, 3-174.
Leszczyc P.T.L. and H.J.P. Timmernans, 1997. Store-Switching Behavior. Marketing Letters, 8, 2, 193-204.
Mittal B., 1994. An Integrated Framework for Relating Diverse Consumer Characteristics to Supermarket Coupon Redemption. Journal of Marketing Research, 31, November, 533-544.
Mulhern F.J., 1997. Retail Marketing: From Distribution to Integration. International Journal of research in Marketing, 14, 103-124.
Mulhern F.J. and D.T. Padgett, 1995. The Relationship Between Retail Price Promotions and Regular Price Purchases. Journal of Marketing, 59, October, 83-90.
Roy A., 1994. Correlates of Mall Visit Frequency. Journal of Retailing, 70, 2, 139-161.
Saunders J. (1994), Cluster Analysis, In: Hooley G.J. and M.K. Hussey Eds., Quantitative Methods in Marketing, Aston University, Academic Press, Harcourt Brace Publishers, 13-28.
Schindler R., 1984. How Cents-off Coupons Motivate the Consumer. In: K. Jocz ed., Research on Sales Promotion., Cambridge, Massachusetts, Marketing Science Institute.
Strazziéri A., 1994. Mesurer l’implication durable vis-à-vis d’un produit indépendamment du risque perçu. Recherche et Applications en Marketing, 9, 73-91.
Uncles M., 1995. Classifying Shoppers by their Shopping Trip Behaviour: A Polythetic-Divisive Method. In: Proceedings of the 24th EMAC Conference, Cergy-Pontoise, France, 1175-1193.
Uncles M.D. and A.S.C. Ehrenberg, 1990. The Buying of Packaged Goods at US Retail Chains. Journal of Retailing, 66, 3, Fall, 278-296.
Uncles M. and K. Hammond K., 1995. Grocery Store Patronage. The International Review of Retail, Distribution and Consumer Research, 5, 3, July, 287-302.
Wrigley N. and R. Dunn, 1984. Stochastic Panel-Data Models of Urban Shopping Behaviour: 1. Purchasing at Individual Stores in a Single City. Environment and Planning A, 16, 629-650.