HAL Id: hal-01438385
https://hal.archives-ouvertes.fr/hal-01438385
Submitted on 17 Jan 2017
HAL is a multi-disciplinary open access
archive for the deposit and dissemination of
sci-entific research documents, whether they are
pub-lished or not. The documents may come from
teaching and research institutions in France or
abroad, or from public or private research centers.
L’archive ouverte pluridisciplinaire HAL, est
destinée au dépôt et à la diffusion de documents
scientifiques de niveau recherche, publiés ou non,
émanant des établissements d’enseignement et de
recherche français ou étrangers, des laboratoires
publics ou privés.
Performance and robustness of HDR objective quality
metrics in the context of recent compression scenarios
Toinon Vigier, Lukáš Krasula, Aurélien Milliat, Matthieu Perreira da Silva,
Patrick Le Callet
To cite this version:
Toinon Vigier, Lukáš Krasula, Aurélien Milliat, Matthieu Perreira da Silva, Patrick Le Callet.
Per-formance and robustness of HDR objective quality metrics in the context of recent compression
sce-narios. Digital Media Industry and Academic Forum 2016, Jul 2016, Santorini, Greece. pp.59 - 64,
�10.1109/DMIAF.2016.7574903�. �hal-01438385�
Performance and robustness of HDR objective
quality metrics in the context of recent compression
scenarios
Toinon Vigier∗, Luk´aˇs Krasula∗†, Aur´elien Milliat∗, Matthieu Perreira Da Silva∗, Patrick Le Callet∗
∗IRCCyN CNRS UMR 6597, Universit´e de Nantes, France
†Czech Technical University in Prague, Technick´a 2, 166 27 Prague 6, Czech Republic
Email:{toinon.vigier, lukas.krasula, aurelien.milliat, matthieu.perreiradasilva, patrick.lecallet}@univ-nantes.fr
Abstract—The new High Dynamic Range (HDR) technologies intend to increase the immersiveness and quality of experience of the observers thanks to much larger luminance and contrast characteristics. This increase of the amount of information requires the development of new sophisticated compression algo-rithms. Moreover, well-known objective quality metrics designed for Low Dynamic Range (LDR) systems may not be directly used for assessing HDR videos. To address this issue, several different ways have been proposed. However, their performance and robustness in the context of the most recent HDR com-pression software solutions need to be assessed and validated on various types of content. In this paper, four objective metrics are benchmarked from data obtained in a new subjective test conducted on various HDR video sequences.
I. INTRODUCTION
High Dynamic Range (HDR) Imaging attempts to capture and reproduce the exact luminance values of the real scene. That enables us to maintain all the details which would be lost in underexposed or overexposed areas if a classical Low Dynamic range (LDR) imaging system was used. However, together with the obvious advantages brought by the HDR technology such as more realistic scene reproduction, higher quality of experience (QoE) of the observers, more space for post-processing, etc., it also brings several drawbacks. One of these is the amount of information necessary for storing the HDR images and videos. The estimated ratio between the file size of a LDR and an HDR image is about 1:4 [1].
The development of sophisticated compression algorithms for HDR videos is therefore essential. Currently, a lot of effort has been dedicated to this topic and different schemes for HDR compression have been proposed in order to address the augmentation of information, the augmentation of contrast, the backward compatibility with existing schemes, etc., As a matter of fact, any new video compression technology possibly introduces new artifacts and distortions which brings the need to evaluate their impact on the video quality. This can be done either subjectively or objectively. For the objective quality assessment mainly full-reference objective metrics are used. These metrics are designed to predict video quality by comparing the original video signal against the encoded video signal. In order to address the new possible artifacts, it is
necessary to evaluate the performance and the robustness of these metrics in the recent HDR compression scenarios.
The goal of this study is to benchmark the existing objective metrics for video quality and, more specifically, evaluate their robustness in one of the most recent HDR compression solu-tions. The rest of this paper is organized as follows: Section II describes some previous work on the performance of objective metrics for HDR video quality assessment; Section III presents the subjective experiment; subjective results are analyzed and metrics are benchmarked in Section IV; conclusion ends the paper in Section V.
II. RELATED WORKS
There are two main approaches in full-reference objective HDR image and video quality assessment. In the first one, the metrics are applied on the physical luminance directly. This is in parallel with processing in human visual system (HVS), thus this approach is mostly called HVS-based. The main representatives come from the work of Daly [2] and his Visual Difference Predictor (VDP). The concept was adapted for HDR images by Mantiuk et al. [3] and later on revised in [4] and [5]. The second possibility is to work with the values close to the perceived luminance rather than the physical one. The advantage is that standard full-reference image/video quality metrics can be used. The first HDR metric focusing directly on video quality, HDR-VQM, proposed by Narwaria et al. [6] belongs to this category. The approach is dependent on what function is used to obtain the perceived luminance values. One popular approach is employing the logarithmic function with is in line with Weber’s law. More sophisticated function, resulting in perceptually uniform (PU) values, was proposed by Aydin et al. [7]. It should be noted that no matter which of the approaches is selected, it is of crucial importance to calibrate the metrics according to the truly displayed values depending on the parameters of the screen.
Several studies have attempted to determine the abilities of the metrics regarding HDR compression algorithms. Hanhart et al. [8] compared 13 metrics on still images compressed with backwards-compatible JPEG XT profile A algorithm. The best performance was achieved by HDR-VDP-2 [4]. Valenzise
et al. [9] showed in a similar study that LDR metrics can perform as well as complicated HVS-based algorithms when the mapping to perceived luminance is performed. Recently, Hanhart et al. compared the performance of 35 objective metrics on 240 compressed HDR images [10]. They showed that HDR-VQM, HDR-VDP-2 and MS-SSIM computed in the PU space are the most reliable predictors of perceived quality. Metrics performance on HDR video compression has been studied by Azimi et al. [11]. Here, the best performing method was also HDR-VDP-2 (if only compression is considered). The same result was obtained also by ˇReˇr´abek et al. [12]. First experiment including HDR-VQM performed by its authors in [6] showed its superiority over HDR-VDP-2. In [13], the performance of HDR-VQM, HDR-VDP-2.2 [5], as well as LDR metrics SSIM [14] and VIF [15] (after the PU mapping) are very similar. In [16], the authors compared the classifica-tion errors of various different metrics. In terms of objective measures, PSNR and HDR-VDP-2 can reliably differentiate results between pair comparisons. However, the metric HDR-VQM shows low performance and cannot distinguish differ-ence of quality.
III. SUBJECTIVE EXPERIMENT
A. Dataset
The dataset used for this subjective test consists of HD resolution HDR video sequences from the MPEG Call for Evidence for HDR and WCG video coding [17] and from EBU Zurich Athletics 20141. The length of video sequences
was between 4 and 18 seconds. The spatial and temporal information of the HDR reference streams is presented Figure 2 (SI and TI are calculated as described in [18]). Sources 1 to 5 correspond to EBU streams and sources 6 to 15 correspond to MPEG ones (Figure 1).
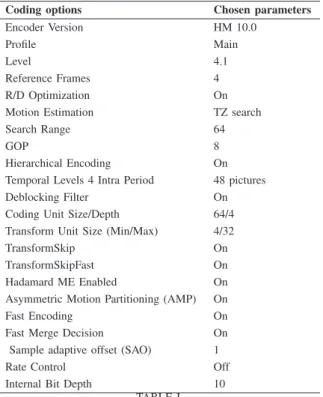
B. Compression scenario
We used the test model HEVC Main 10 Profile with six fixed quantization parameters (QP) to compress videos. The coding options are detailed in Table I. The used QP values were 20, 24, 28, 32, 36 and 40 for each content. All video sequences were non-linearly quantized (with PQ EOTF) before compression. Inverse quantization was then applied to transform uncompressed streams to linear RGB OpenEXR format.
C. Test environment
The video sequences were displayed on the SIM2 Solar47 HDR dispay which has a maximum displayable luminance of 4000 cd/m2. The viewing distance was set to three times the height of the screen, i.e., approximately 178 cm.
The experiments was conducted in a test environment equipped with a controlled lighting system of a 6500 K color temperature which fulfills the standard test condition according to ITU-R BT.500 [19].
1https://tech.ebu.ch/testsequences/zurich athletics
Coding options Chosen parameters
Encoder Version HM 10.0
Profile Main
Level 4.1
Reference Frames 4
R/D Optimization On
Motion Estimation TZ search
Search Range 64
GOP 8
Hierarchical Encoding On
Temporal Levels 4 Intra Period 48 pictures
Deblocking Filter On
Coding Unit Size/Depth 64/4
Transform Unit Size (Min/Max) 4/32
TransformSkip On
TransformSkipFast On
Hadamard ME Enabled On
Asymmetric Motion Partitioning (AMP) On
Fast Encoding On
Fast Merge Decision On
Sample adaptive offset (SAO) 1
Rate Control Off
Internal Bit Depth 10
TABLE I HEVCCODING OPTIONS.
D. Test methodology
For rating the stimuli, the absolute category rating with hidden reference (ACR-HR) method was used [18]. It is based on rating sequences independently on a 5-point category scale from 5 (Excellent) to 1 (Bad). The hidden reference condition means that the present test procedure includes a reference (undistorted) version of each source sequence shown as any other test sequence. This methodology allows the direct computation of mean opinion scores (MOS) as well as differential quality score (DMOS) between each test sequence and its corresponding hidden reference. This method is more suitable here because it evaluates perceived quality more than perceived fidelity.
E. Participants
25 remunerated viewers participated in this subjective ex-periment (13 female and 12 male), aged between 19 and 43 (mean= 26.56± 7.39SD). All are non-expert in subjective experiment, image processing or HDR related fields. All participants have either normal or corrected-to-normal visual acuity which was assured prior to this experiment with a Monoyer chart. Ishihara color plates were used to test color vision. All of the 25 viewers passed the pre-experiment vision check.
IV. RESULTS
A. Analysis of subjective results
A post-experiment screening of these subjects was em-ployed to reject any outliers in accordance with the ITU 500
Fig. 1. Tone-mapped and resized versions of the first frames of the 15 reference HDR sources used in the experiment.
Fig. 2. Spatial and temporal information.
Fig. 3. Subjective scores distribution.
recommandation [19]. None of them was rejected. In addition, as it can be observed in Figure 3, the test was well-balanced: the subjective scores are quite equally distributed across the five classes. The fact that some reference video sequences were not evaluated as Excellent (5) but as Good (4) can explain the superiority of the class 4.
From the observer results, the Mean Opinion Score (MOS) as well as the associated 95% confidence interval were com-puted for each video stimulus. Figure 4 shows the subjective results for each content.
B. Benchmarking of objective metrics
In this study, the performance of the following full-reference objective metrics is evaluated:
• PU-PSNR (#1): Peak Signal-to-Noise Ratio computed on
the perceived luminance (PU mapping),
• PU-SSIM (#2): Signal-to-Noise Ratio computed on the
perceived luminance [14],
• PU-VIF (#3): Visual Information Fidelity computed on
the perceived luminance [15],
• HDR-VDP2.2 (#4): High Dynamic Range Visible
Differ-ence Predictor for video [5],
Since the first three metrics are originally criteria of image quality, they were calculated per frame and averaged.
To compare the performance of the metrics, criteria de-scribed in ITU-T Rec. P.1401 [20] are used. These include Pearson’s Linear Correlation Coefficient (PLCC) to mea-sure linearity, Spearman’s Rank Order Correlation Coefficient (SROCC) and Kendall’s Rank Order Correlation Coefficient (KROCC) to determine the monotonicity, Root-Mean-Squared Error (RMSE) and epsilon-insensitive RMSE (RMSE*), and Outlier Ratio (OR) to determine the accuracy. Before the calculation of PLCC, RMSE, RMSE* and OR, the objective scores were mapped on the subjective scores using 3rd order polynomial monotonic mapping.
Moreover, to gain more insight into the metrics’ behav-ior, the performance evaluation methodology from [21] has also been employed. This method provides information about metrics’ abilities to distinguish between significantly different and similar videos (Different/Similar analysis) and to rec-ognize which video is better (Better/Worse analysis). The performance is reported in the form of area under curve (AUC) values. Higher AUC value signifies better performance. For the Better/Worse analysis, also the percentage of correct classification (CC0) is reported. For more information about
the analyses and interpretation of their results, refer to [21]. The results are depicted in Figures 5 and 6. Each per-formance measure is accompanied with the indication if the results are statistically significantly different. White rectangle
Fig. 4. Mean Opinion Scores for each content.
means that the method in the column performs significantly better than the method in the row. Black rectangle signifies the opposite case and gray rectangle identifies cases where the performances are not significantly different. To compensate for the multiple comparisons, the procedure proposed by Benjamini and Hochberg [22] has been used.
The results indicate that PU-VIF and HDR-VDP2.2 perform significantly better than PU-PSNR and PU-SSIM. The perfor-mance of the two best performing metrics are not statistically significantly different with respect to all the performance measures with the exception of C0 for Better/Worse
Analy-sis, where PU-VIF significantly outperforms HDR-VDP2.2. According to the SROCC, both AUCs, and C0, PU-SSIM
significantly outperforms PU-PSNR. Its results are also not statistically different from HDR-VDP2.2 in terms of OR. The good performance of HDR-VDP2.2 and PU-VIF is in parallel with the related studies. However, the first one mostly works slightly better than the latter. Our study therefore provides a very interesting outcome, since the results suggest the op-posite. Considering the higher computational requirements of HDR-VDP2.2, PU-VIF seems to represent more than adequate alternative.
1) Metrics performance within content: We also decided to check the metrics’ abilities within the individual contents. Given that there were only six compressed versions per source content, we only report the results of the AUC measures which allow us to meaningfully congregate the individual results.
The pairs for analyses were therefore taken from within the content only (i.e. no cross-content pairs were considered). The results are depicted in Figure 7. Because of much smaller number of pairs, we were not able to find any statistically significant differences in performance. Nevertheless, we can observe some trends.
HDR-VDP2.2 seems to be very reliable in terms of
distin-guishing between different and similar videos when no cross-content pairs are considered. We can also see than all of the metrics are perfectly capable of recognizing more and less distorted versions of the same content (as testified by 100% correct classification in Better/Worse analysis).
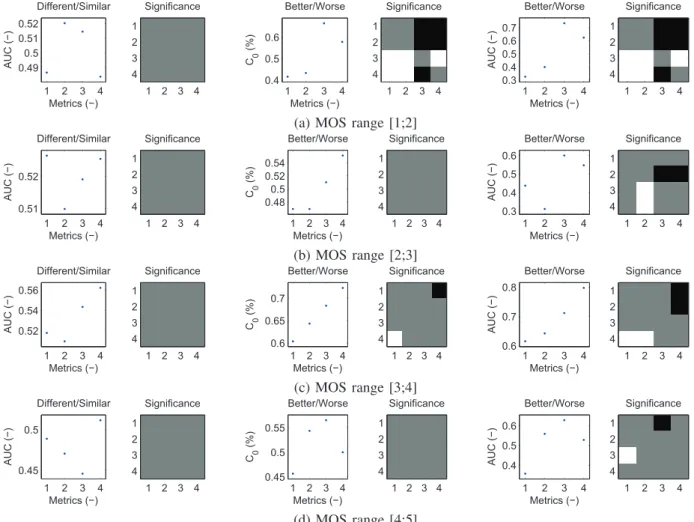
2) Metrics performance according to the quality range:
Finally, we provide the results per quality range. We split the dataset according to the MOS values into four intervals: [1;2], [2;3], [3;4], [4;5]. Since many of the MOS values in these intervals are expected not to be statistically significantly different, correlation based measures not considering statistical significance would be misleading. We therefore report only the AUC measures again. The results can be found in Figure 8.
With respect to the Different/Similar analyses, no statisti-cally significant differences can be seen. The performances are generally very low (AUC around 0.5 corresponding to the random guessing). In some cases they also drop under 0.5 indicating systematical errors in judgment which videos are qualitatively different and which are similar. For the higher qualities, only HDR-VDP2.2 reaches values higher than 0.5. However, for the lower qualities, its reliability drops. This could have been expected, since the metric is mainly focused on the distortions around the visibility threshold.
In Better/Worse Analysis, the performance of the PU-VIF is significantly better than the rest of the metrics in the lowest quality range. In the higher ranges, results are not significant but generally speaking, PU-VIF and HDR-VDP2.2 work better than the other two criteria. Their performance also never drops under 0.5 which corresponds to the systematical evaluation of the better video as the worse.
V. CONCLUSION
In this paper, we have presented a benchmarking of four objective metrics on a new HDR video dataset. This dataset
1 2 3 4 0.2 0.4 0.6 0.8 PLCC PLCC (−) metrics (−) Significance 1 2 3 4 1 2 3 4 1 2 3 4 0.2 0.4 0.6 0.8 SROCC SROCC (−) metrics (−) Significance 1 2 3 4 1 2 3 4 1 2 3 4 0.2 0.4 0.6 KROCC KROCC (−) metrics (−) Significance 1 2 3 4 1 2 3 4 1 2 3 4 0.6 0.8 1 RMSE values RMSE (−) metrics (−) Significance 1 2 3 4 1 2 3 4 1 2 3 4 0.4 0.6 0.8 RMSE* values RMSE* (−) metrics (−) Significance 1 2 3 4 1 2 3 4 1 2 3 4 0.5 0.6 0.7 0.8 0.9 Outlier Ratio OR (−) metrics (−) Significance 1 2 3 4 1 2 3 4
Fig. 5. Performance of the metrics according to the ITU-T Rec. P.1401 [20] with statistical significance indication. White rectangle means that the metric in the column outperforms the metric in the row, blqck rectangle signifies the opposite case and gray rectangle identifies cases where the performances are not significantly different. 1 2 3 4 0.5 0.55 0.6 0.65 A UC (−) Metrics (−) Different/Similar Significance 1 2 3 4 1 2 3 4 1 2 3 4 0.6 0.7 0.8 C0 (%) Metrics (−) Better/Worse Significance 1 2 3 4 1 2 3 4 1 2 3 4 0.6 0.7 0.8 0.9 A UC (−) Metrics (−) Better/Worse Significance 1 2 3 4 1 2 3 4
Fig. 6. Performance of the metrics according to Krasula et al. [21] with statistical significance indication. White rectangle means that the metric in the column outperforms the metric in the row, blqck rectangle signifies the opposite case and gray rectangle identifies cases where the performances are not significantly different. 1 2 3 4 0.7 0.8 A UC (−) Metrics (−) Different/Similar Significance 1 2 3 4 1 2 3 4 1 2 3 4 0.9 1 1.1 C0 (%) Metrics (−) Better/Worse Significance 1 2 3 4 1 2 3 4 1 2 3 4 0.9 1 1.1 A UC (−) Metrics (−) Better/Worse Significance 1 2 3 4 1 2 3 4
Fig. 7. Performance of the metrics within content according to Krasula et al. [21] with statistical significance indication. White rectangle means that the metric in the column outperforms the metric in the row, blqck rectangle signifies the opposite case and gray rectangle identifies cases where the performances are not significantly different.
is composed of 105 HDR video sequences subjectively as-sessed by 25 observers with ACR methodology. Results show that HDR-VDP2.2 and PU-VIF, i.e. VIF calculated on the perceived luminance obtained with PU mapping, perform the best. Considering the higher complexity of HDR-VDP2.2, PU-VIF seems to be a good alternative to predict perceptual quality of HDR videos. In addition, further analyses in term of metric performance within content show that all the metrics are perfectly enabled to detect the more distorted version between any two of them of the same content. The performance analysis on the different ranges of quality was performed as well, providing more insight into metrics’ behavior.
REFERENCES
[1] F. Banterle, A. Artusi, K. Debattista, and A. Chalmers, Advanced High Dynamic Range Imaging: Theory and Practice. Natick, MA, USA: AK Peters (CRC Press), 2011.
[2] S. Daly, “The Visible Differences Predictor: An Algorithm for the Assessment of Image Fidelity,” in Digital Images and Human Vision. MIT Press, 1993, pp. 179–206.
[3] R. Mantiuk, S. J. Daly, K. Myszkowski, and H.-P. Seidel, “Predicting visible differences in high dynamic range images: model and its cali-bration,” in Proc. SPIE, B. E. Rogowitz, T. N. Pappas, and S. J. Daly, Eds., vol. 5666, mar 2005, pp. 204–214.
[4] R. Mantiuk, K. J. Kim, A. G. Rempel, and W. Heidrich, “HDR-VDP-2: A calibrated visual metric for visibility and quality predictions in all luminance conditions,” ACM Transactions on Graphics (Proc. of SIGGRAPH’11), vol. 30, no. 4, 2011.
[5] M. Narwaria, R. K. Mantiuk, M. P. Da Silva, and P. Le Callet, “HDR-VDP-2.2: a calibrated method for objective quality prediction of high-dynamic range and standard images,” Journal of Electronic Imaging, vol. 24, no. 1, p. 010501, jan 2015.
[6] M. Narwaria, M. Perreira Da Silva, and P. Le Callet, “HDR-VQM: An objective quality measure for high dynamic range video,” Signal Processing: Image Communication, vol. 35, pp. 46–60, jul 2015. [7] T. O. Aydin, R. Mantiuk, and H.-P. Seidel, “Extending Quality Metrics
to Full Luminance Range Images,” in Proc. SPIE 6806, Human Vision and Electronic Imaging XIII, B. E. Rogowitz and T. N. Pappas, Eds., vol. 6806, feb 2008.
1 2 3 4 0.49 0.5 0.51 0.52 A UC (−) Metrics (−) Different/Similar Significance 1 2 3 4 1 2 3 4 1 2 3 4 0.4 0.5 0.6 C0 (%) Metrics (−) Better/Worse Significance 1 2 3 4 1 2 3 4 1 2 3 4 0.3 0.4 0.5 0.6 0.7 A UC (−) Metrics (−) Better/Worse Significance 1 2 3 4 1 2 3 4
(a) MOS range [1;2]
1 2 3 4 0.51 0.52 A UC (−) Metrics (−) Different/Similar Significance 1 2 3 4 1 2 3 4 1 2 3 4 0.48 0.5 0.52 0.54 C0 (%) Metrics (−) Better/Worse Significance 1 2 3 4 1 2 3 4 1 2 3 4 0.3 0.4 0.5 0.6 A UC (−) Metrics (−) Better/Worse Significance 1 2 3 4 1 2 3 4 (b) MOS range [2;3] 1 2 3 4 0.52 0.54 0.56 A UC (−) Metrics (−) Different/Similar Significance 1 2 3 4 1 2 3 4 1 2 3 4 0.6 0.65 0.7 C0 (%) Metrics (−) Better/Worse Significance 1 2 3 4 1 2 3 4 1 2 3 4 0.6 0.7 0.8 A UC (−) Metrics (−) Better/Worse Significance 1 2 3 4 1 2 3 4 (c) MOS range [3;4] 1 2 3 4 0.45 0.5 A UC (−) Metrics (−) Different/Similar Significance 1 2 3 4 1 2 3 4 1 2 3 4 0.45 0.5 0.55 C0 (%) Metrics (−) Better/Worse Significance 1 2 3 4 1 2 3 4 1 2 3 4 0.4 0.5 0.6 A UC (−) Metrics (−) Better/Worse Significance 1 2 3 4 1 2 3 4 (d) MOS range [4;5]
Fig. 8. Performance of the metrics for different quality ranges according to Krasula et al. [21] with statistical significance indication. White rectangle means that the metric in the column outperforms the metric in the row, blqck rectangle signifies the opposite case and gray rectangle identifies cases where the performances are not significantly different.
Pinheiro, and T. Ebrahimi, “HDR image compression: A new challenge for objective quality metrics,” in 2014 Sixth International Workshop on Quality of Multimedia Experience (QoMEX). IEEE, sep, pp. 159–164. [9] G. Valenzise, F. De Simone, P. Lauga, and F. Dufaux, “Performance evaluation of objective quality metrics for HDR image compression,” in Proc. SPIE 9217, Applications of Digital Image Processing XXXVII, A. G. Tescher, Ed., vol. 9217, sep 2014.
[10] P. Hanhart, M. V. Bernardo, M. Pereira, A. M. G. Pinheiro, and T. Ebrahimi, “Benchmarking of objective quality metrics for HDR image quality assessment,” EURASIP Journal on Image and Video Processing, 2015. [Online]. Available: http://dx.doi.org/10.1186/s13640-015-0091-4 [11] M. Azimi, A. Banitalebi-dehkordi, Y. Dong, M. T. Pourazad, and P. Na-siopoulos, “Evaluating the Performance of Existing Full - Reference Quality Metrics on High Dynamic Range (HDR) Video Content,” in International Conference on Multimedia Signal Processing (ICMSP), 2014.
[12] M. ˇReˇr´abek, P. Hanhart, P. Korshunov, and T. Ebrahimi, “Subjective and
objective evaluation of HDR video compression,” in 9th International Workshop on Video Processing and Quality Metrics for Consumer Electronics (VPQM), 2015.
[13] M. Narwaria, M. Perreira Da Silva, and P. Le Callet, “Study of high dynamic range video quality assessment,” in Proc. SPIE 9599, Applications of Digital Image Processing XXXVIII, A. G. Tescher, Ed., 2015.
[14] Z. Wang, A. Bovik, H. Sheikh, and E. Simoncelli, “Image Quality Assessment: From Error Visibility to Structural Similarity,” IEEE Trans-actions on Image Processing, vol. 13, no. 4, pp. 600–612, apr 2004.
[15] H. Sheikh and A. Bovik, “Image information and visual quality,” IEEE Transactions on Image Processing, vol. 15, no. 2, pp. 430–444, feb 2006.
[16] P. Hanhart, M. ˇReˇr´abek, and T. Ebrahimi, “Towards high dynamic range
extensions of HEVC: subjective evaluation of potential coding technolo-gies,” in Proc. SPIE 9599, Applications of Digital Image Processing XXXVIII, vol. 9599, sep 2015.
[17] ISO/IEC JTC1/SC29/WG11 MPEG, “Call for Evidence (CfE) for HDR and WCG Video Coding,” 2015.
[18] ITU-T Recommendation P.910, Subjective video quality assessment methods for multimedia applications, ITU-T Std., 2008.
[19] ITU-T Recommendation BT.500-13, Methodology for the subjective assessment of the quality of television pictures, ITU-T Std., 2012. [20] ITU-T Recommendation P.1401, Methods, metrics and procedures for
statistical evaluation, qualification and comparison of objective quality prediction models, ITU-T Std., 2012.
[21] L. Krasula, K. Fliegel, P. Lecallet, and M. Kl´ıma, “On the accuracy of objective image and video quality models: New methodology for performance evaluation,” in International Conference on Quality of Multimedia Experience (QoMEX), 2016.
[22] Y. Benjamini and Y. Hochberg, “Controlling the false discovery rate: A practical and powerful approach to multiple testing,” Journal of the Royal Statistical Society, vol. 57, no. 1, pp. 289–300, 1995.


![Fig. 5. Performance of the metrics according to the ITU-T Rec. P.1401 [20] with statistical significance indication](https://thumb-eu.123doks.com/thumbv2/123doknet/8137175.273160/6.892.98.782.123.352/fig-performance-metrics-according-itu-statistical-significance-indication.webp)