HAL Id: hal-00275327
https://hal.archives-ouvertes.fr/hal-00275327
Submitted on 23 Apr 2008
HAL is a multi-disciplinary open access
archive for the deposit and dissemination of
sci-entific research documents, whether they are
pub-lished or not. The documents may come from
teaching and research institutions in France or
abroad, or from public or private research centers.
L’archive ouverte pluridisciplinaire HAL, est
destinée au dépôt et à la diffusion de documents
scientifiques de niveau recherche, publiés ou non,
émanant des établissements d’enseignement et de
recherche français ou étrangers, des laboratoires
publics ou privés.
From SD to HD television: effects of H.264 distortions
versus display size on quality of experience
Stéphane Péchard, Mathieu Carnec, Patrick Le Callet, Dominique Barba
To cite this version:
Stéphane Péchard, Mathieu Carnec, Patrick Le Callet, Dominique Barba. From SD to HD television:
effects of H.264 distortions versus display size on quality of experience. International Conference on
Image Processing, Oct 2006, Atlanta, United States. pp.409-412, �10.1109/ICIP.2006.312480�.
�hal-00275327�
FROM SD TO HD TELEVISION: EFFECTS OF H.264 DISTORTIONS
VERSUS DISPLAY SIZE ON QUALITY OF EXPERIENCE
Stéphane Péchard, Mathieu Carnec, Patrick Le Callet, Dominique Barba
Institut de recherche en communication et cybernétique de Nantes (IRCCyN)
Équipe Image et vidéocommunication – UMR CNRS 6597
Polytech’Nantes, rue Christian Pauc, La Chantrerie
BP 50609, 44306 Nantes, Cedex 3, France
{stephane.pechard ; mathieu.carnec ; patrick.lecallet ; dominique.barba}@univ-nantes.fr
ABSTRACTHigh Definition Television (HDTV) is the new broadcasting system designed to take the place of Standard Definition Tele-vision (SDTV) at home in the near future. This system re-quires modification of many features in the broadcasting chain with an overall objective of reaching a noticeably higher qual-ity of experience. Since broadcasters desire a high level of service acceptability, they require efficient measurements of quality of experience. The purpose of this paper is to pro-vide such measurements concerning the noticeable artifacts in H.264 distortions over a range of display sizes and com-paring HDTV to SDTV. A subjective characterization of some HDTV quality of experience aspects is proposed and the re-sults are discussed.
Index Terms— HDTV, Communication equipment test-ing, Technology assessment.
1. INTRODUCTION
HDTV services have already been introduced in USA, Aus-tralia, Japan, Canada and Korea. They are expected in Eu-rope and China in 2006. Such systems are motivated by psy-chophysical considerations. Subjective tests [1, 2] have shown that the ideal distance to watch moving pictures is about three times the screen’s height. Therefore, in order to avoid percep-tion of pictures defects when standing at this distance, HDTV relies on a wider display screen and a higher source definition. First generation HDTV is broadcast using MPEG-2 in two definitions: 1920×1080 in interlaced mode (named 1080i) and 1280×720 in progressive mode (720p). Subjective tests tend to suggest that 720p is visually of better quality than 1080i [3] for video with rather high motion. But as most video cameras are currently in 1080i format, this is more likely to be used in production. Effectively, a larger image would be more appealing commercially and consumers would probably be influenced by the misnomer “the larger the im-age the better” and prefer 1080i over 720p. Second genera-tion HDTV is developed with the same definigenera-tions but using
an H.264/MPEG-4 AVC compression standard. Quality met-rics should therefore be defined for H.264 specificities. Third generation HDTV will use 1920×1080 definition in progres-sive mode. At present however, too few capture materials are available in this format. Moreover, important investments have been made in the two first generations, so they must make a profit before new investments are made.
Since a user’s quality expectations are increased in HDTV and display screens are larger, broadcasters have to allocate higher bitrates for HDTV than for SDTV. Therefore this study can assist in determining the service satisfaction threshold. But there are very few references on HDTV quality measure-ments. This paper attempts to fill this gap in part.
Previous work investigated the design of HDTV subjec-tive quality assessment protocols [4]. Since HDTV provides a new experience for the end-user, his/her habits in terms of television viewing are expected to change. The observation distance has been particularly studied. Tests have been con-ducted to evaluate viewing differences between HDTV and SDTV. Observers are likely to prefer the larger image which is proposed by HDTV but if too many distortion artifacts are present, some of them may prefer SDTV. These tests have been designed to determine the preference threshold between HDTV and SDTV and to evaluate the effect of a larger image. The next section describes the subjective tests performed. Particular attention is given to material, observers and proto-col. In Section 3, experimental results are given along with a discussion. The paper is concluded in Section 4.
2. SUBJECTIVE TESTS
2.1. Video material
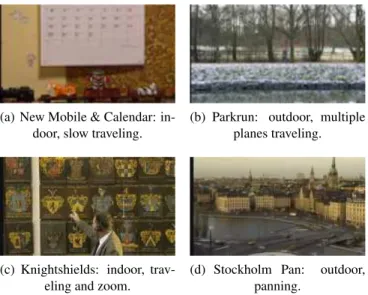
Four ten-second long 1080i HDTV sequences from SVT re-search [3] have been used. Example frames are presented in Figure 1. Sequences have been distorted through the use of H.264 JM reference software [5]. Seven bitrates have been produced per HD sequence. Bitrates differ from one sequence
(a) New Mobile & Calendar: in-door, slow traveling.
(b) Parkrun: outdoor, multiple planes traveling.
(c) Knightshields: indoor, trav-eling and zoom.
(d) Stockholm Pan: outdoor, panning.
Fig. 1. Example of HDTV sequences usable for test protocol.
HD codingH.264 decodingH.264 coded HD half band ↓2 QHD H.264 coding H.264 decoding coded QHD insertion in HD QHD in HD
Fig. 2. Subjective tests protocol sequences obtaining scheme. to another and are presented in Table 1. The selection of these bitrates has been done during preliminary tests by the authors in order to cover the useful quality range from a poor to an excellent visual quality.
SDTV sequences are computed from these HD sequences through a half band filtering followed by sub-sampling by a factor of 2 (both along horizontal and vertical directions). Both fields are decimated separately before reconstitution in progressive format. A general scheme is presented in Fig-ure 2. This results in an approximation of SD 576i sequences (the actual definition is 960×540). This technique is moti-vated by the fact that this definition is very close to “real 16/9” SDTV (1024×576) and no interpolation is required. Further-more, this results in a half-height video (QHD in figure 2, for Quarter HD), which can satisfy both recommended distances for SD (D = 6H) and HD (D = 3H), H being the video’s height [1, 2, 6, 7].
As with HD sequences, SD videos have been encoded us-ing the H.264 reference software [5], with the same parame-ters. MPEG-2 has not been used in order to avoid introducing another difference in the comparison. Each SD sequence has been encoded with two bitrates corresponding to two common
Sequence HDTV Bitrates (Mbps) New Mobile & Calendar 2.25 ; 2.5 ; 3.15 ; 4 ; 5 ; 7 ; 10
Parkrun 8 ; 12 ; 16 ; 18 ; 20 ; 24 ; 28 Knightshields 2.25 ; 3 ; 4 ; 5 ; 6 ; 7 ; 8 Stockholm Pan 1.625 ; 1.875 ; 2.25 ; 3 ; 3.6 ; 4 ; 6
Sequence SDTV Bitrates (Q60, Q80)
New Mobile & Calendar 1.8 ; 3 Parkrun 5.3 ; 9 Knightshields 1.6 ; 3 Stockholm Pan 1.2 ; 1.8 Table 1. Chosen bitrates (in Mbps) per video sequence.
Fig. 3. Example of a SD image inserted in a HD image. SD broadcast qualities. They have been chosen to be repre-sentative of an excellent (Q80) and of a rather good (Q60)
sub-jective visual quality, respectively. It means to get scores of around 80 and 60 on a continuous subjective quality scale of 1 to 100. Selected bitrates are given in Table 1. These will be compared to the seven different HD quality levels. To avoid screen flickering and screen’s manual switching between HD and SD, SD videos have been inserted at the center of an HD video with gray background. An example of a SD image in-serted in a HD image is presented in Figure 3.
2.2. Test room material
Tests have been performed in a specific showroom. Light-ning conditions, display parameters and observation distances have been precisely measured as required in recommenda-tions [6, 7]. The HDTV screen used was a CRT JVC DT-V 1910CG which can display 1080i sequences. Its height D equals 20.5 cm, which means that an observer is positioned at a distance of about 61.5 cm. Uncompressed 1080i video se-quences were played with a V1-UHD player from the Dorémi company.
2.3. Protocol
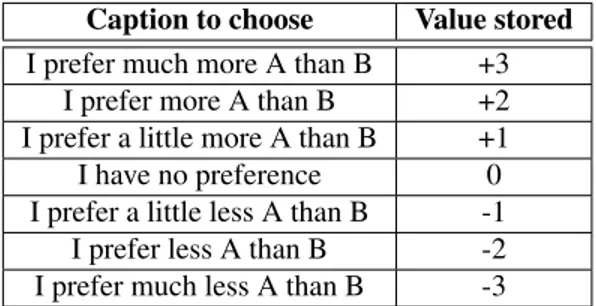
Specific protocols have been designed for these tests since no such experiments have been normalized yet. The
pro-Caption to choose Value stored I prefer much more A than B +3
I prefer more A than B +2 I prefer a little more A than B +1 I have no preference 0 I prefer a little less A than B -1
I prefer less A than B -2 I prefer much less A than B -3
Table 2. Comparison scale for comparison test protocol. tocol utilised is derived from the comparative method with adjectival categorical judgment described in BT.500-11 ITU Recommendation [6]. Before the actual comparison test, ob-servers were simply asked to determine their preferred obser-vation distance from the HDTV screen. This information is important since some distortions may be visible at a certain distance and invisible at another one. Furthermore, no preci-sion were given about the recommended observation distance. Thus, people mostly determined their preferred distance with their own television culture. The criterion for determination is observer’s comfort of visualization. Then he/she was asked to take place at the recommended distance of 3H.
Series of comparison tests were made of the presentations. A presentation consisted of one or several visualizations of two video sequences labeled “video A” and “video B”. HD and SD videos were assigned letter A or B randomly. A vi-sualization was the viewing of both videos A and B. Dur-ing each visualization, the observer compared A and B. Af-ter an initial visualization, he/she could replay any video as much as he/she wanted before voting. This random access in-creases reliability, as shown in the EBU’s SAMVIQ method-ology [8]. After each presentation, the observer had to report the existence and direction of perceptible differences he/she perceived. The comparison scale used is shown in Table 2. Values stored were not shown to the observer. Words asso-ciated with quality such as better or worse were not used. This way, the observer reports his/her global preference, not through a quality criterion.
2.4. Observers
Every observer was first checked for color blindness with Ishi-hara test [9] and for acuity with Monoyer’s plates [10]. Peo-ple with at least one error in Ishihara’s test or less than 9/10 in Monoyer’s test were rejected. 21 people took part in these tests (a minimum of 15 is recommended [6]).
Observers were mostly male students in their mid twen-ties. All are familiar with SDTV and cinema but not with HDTV. When asked about the difference between standing at their preferred distance and at the recommended 3H, most of them were not specifically disturbed, but some indicated they felt too close to the screen and needed to stand back.
3. RESULTS
3.1. User’s experience
When users were asked to determine their ideal HDTV obser-vation distance, all went farther than 3H. Average viewing distance measured was 161 cm (which is about 8H) with a standard deviation of 36 cm. This result is due to the habit of SDTV usual observation distance. People have a certain television viewing culture, and without informing them that HDTV is supposed to be watched closer, they don’t adapt their habits to the new media.
It is also interesting to notice that when positioned at 3H, most observers expressed the feeling that there was too much information to process, therefore observers often needed to stand back in order to consider so much information. The screen was so close that motion in the peripheral area of the retina was disturbing for many.
The replay option was not used much, as every sequence was played 1.15 times on average.
3.2. Image size and distortions effects
PSNRs of the sequences have been computed to measure the artifact importance. PSNR of a sequence is taken as the mean PSNR along all frames. For each sequence and each SDTV bitrate, ∆P SNR is defined as ∆P SNR = P SNRH D −
P SN RSD. It measures the artifact difference between HD
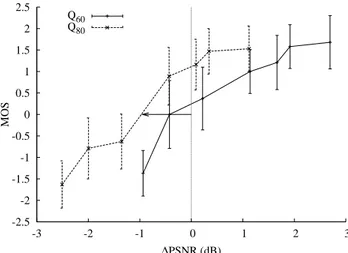
and SD. Figure 4 presents the mean opinion score (MOS) as a function of ∆P SNR with 95% confidence intervals for the Stockholm Pan sequence. This figure indicates that users pre-fer HD over SD depending on the artifact importance difpre-fer- differ-ence. Results with other sequences are similar. The arrow indicates the ∆P SNR0 value, which equals the ∆P SNR
value for MOS = 0. If it is negative, it means that when users have no preference between HD and SD, the HD se-quence contains more artifacts. In Table 3, the ∆P SNR0
and P SNRH D values are given for each sequence. These
values have been obtained by linear interpolation.
Some conclusions can be drawn from Figure 4 and Ta-ble 3. First, with a decreasing ∆P SNR, SD is preferred to HD, which is the expected behavior. Then, when HD is compared to SD of a good visual quality (Q80), ∆P SNR is
always negative. This means that HD may contain more arti-facts and still obtain the same preference level. Therefore, the impact of the large screen effect is predominant and rules the observer’s preference in this case. On the contrary, when HD is compared to SD of lower but still rather good quality (Q60),
this effect decreases and is even reversed in some cases with ∆P SN R0 > 0. Distortions in HD become more prevalent
and disturbing. Here observers tend to prefer SD implying distortions on a large image is more disturbing than on a small one. In this case, the effect of distortions is predominant over the large image effect.
-2.5 -2 -1.5 -1 -0.5 0 0.5 1 1.5 2 2.5 -3 -2 -1 0 1 2 3 MOS ∆PSNR (dB) Q60 Q80
Fig. 4. ∆PSNR values in function of MOS for Stockholm Pan sequence.
Sequence Q80 ∆P SN R0 P SN RH D
New Mobile & Calendar -0.65 37.60 Parkrun -2.65 34.36 Knightshields -0.46 37.81 Stockholm Pan -0.97 37.81 Sequence Q60 ∆P SN R0 P SN RH D
New Mobile & Calendar 1.27 37.39 Parkrun -0.87 33.23 Knightshields 1.5 37.00 Stockholm Pan -0.43 36.78 Table 3. P SNRH Dand ∆P SNR0for both SD sequences.
4. CONCLUSION
In this paper, subjective tests and results have been presented. These tests were performed in order to characterize differ-ences in quality of experience between High Definition Tele-vision (HDTV) and Standard Definition TeleTele-vision (SDTV). Results show that HDTV is a change in customer’s habits. People have cultural prejudices about television and may need information to change it.
Two important effects have been identified as critical in switching from SDTV to HDTV. Comparison tests prove that distortions and a larger image both influence the observer’s preference. Results tend to show that distortions are the pre-dominant factor when HDTV sequences are compared with low quality SDTV. However, in the case of high quality SDTV, the image effect becomes more important. This means that image size is a factor of visual comfort when images are only slightly distorted. But larger image size becomes a drawback when the level of distortions increases. Observers then pre-fer standard definition, as this reduces the visual impact of the distortions. Therefore HDTV has to reach a high level of quality to be successfully adopted by consumers.
5. ACKNOWLEDGMENT
This work is supported by HD4U European project. Its aim is to study the best conditions to deploy HDTV in Europe. Sev-eral actors from consumer devices industries (Philips, Thom-son, etc.) and broadcasters (TF1, Euro1080) are involved. Authors would also like to thank SVT for the freely avail-able HDTV sequences, Thomson for the HDTV screen and Arnaud Tirel and Sylvain Tourancheau for their assistance in performing the subjective tests described in this paper.
6. REFERENCES
[1] Tetsuo Mitsuhashi, “Fundamental requirements for High-definition television systems – Scanning specifica-tions and picture quality,” NHK technical monograph, pp. 21–26, NHK, 1982.
[2] Ichiro Yuyama, “Fundamental requirements for High-definition television systems – Large-screen effects,” NHK technical monograph, pp. 14–20, NHK, 1982. [3] SVT, “Overall-quality assessment when targeting Wide
XGA flat panel displays,” Tech. Rep., SVT corpo-rate development technology, 2002, ftp://ftp.ldv.e-technik.tu-muenchen.de/pub/test_sequences/.
[4] Stéphane Péchard, Sylvain Tourancheau, Patrick Le Callet, Mathieu Carnec, and Dominique Barba, “To-wards Video Quality Metrics for HDTV,” in Proceed-ings of the Second International Workshop on Video Processing and Quality Metrics for Consumer Electron-ics, VPQM2006, Scottsdale, 2006.
[5] Joint Video Team (JVT), “H.264/Advanced Video Coding reference software version 10.1,” 2005, http://iphome.hhi.de/suehring/tml/.
[6] ITU-R BT. 500-11, “Methodology for the subjective assessment of the quality of television pictures,” Tech. Rep., International Telecommunication Union, 2004. [7] ITU-R BT. 710-4, “Subjective assessment methods for
image quality in high-definition television,” Tech. Rep., International Telecommunication Union, 1998.
[8] Jean-Louis Blin, “SAMVIQ - Subjective assessment methodology for video quality,” Tech. Rep. BPN 056, EBU Project Group B/VIM Video in Multimedia, 2003. [9] Shinobu Ishihara, “Tests for colour-blindness,”
Kane-hara Shuppen Company, Ltd., Tokyo, Japan, 1967. [10] Ferdinand Monoyer, “Échelle typographique pour la
détermination de l’acuité visuelle,” Académie des Sci-ences, Comptes rendus, vol. 80, no. 113, 1875.