Titre:
Title
: A flexible data-driven approach for execution trace filtering
Auteurs:
Authors
: Kadjo Gwandy Kouamé, Naser Ezzati-Jivan et Michel R. Dagenais
Date: 2015
Type:
Communication de conférence / Conference or workshop itemRéférence:
Citation
:
Kouamé, K. G., Ezzati-Jivan, N. & Dagenais, M. R. (2015, juin). A flexible data-driven approach for execution trace filtering. Communication écrite présentée à IEEE International Congress on Big Data (BigData Congress 2015), New York, NY, USA (6 pages). doi:10.1109/bigdatacongress.2015.112
Document en libre accès dans PolyPublie
Open Access document in PolyPublie
URL de PolyPublie:
PolyPublie URL: https://publications.polymtl.ca/2985/
Version: Version finale avant publication / Accepted versionRévisé par les pairs / Refereed Conditions d’utilisation:
Terms of Use: Tous droits réservés / All rights reserved
Document publié chez l’éditeur officiel
Document issued by the official publisher
Nom de la conférence:
Conference Name: IEEE International Congress on Big Data (BigData Congress 2015)
Date et lieu:
Date and Location: 2015-06-27 - 2015-07-02, New York, NY, USA
Maison d’édition:
Publisher: IEEE
URL officiel:
Official URL: https://doi.org/10.1109/bigdatacongress.2015.112
Mention légale:
Legal notice:
© 2015 IEEE. Personal use of this material is permitted. Permission from IEEE must be obtained for all other uses, in any current or future media, including
reprinting/republishing this material for advertising or promotional purposes, creating new collective works, for resale or redistribution to servers or lists, or reuse of any copyrighted component of this work in other works.
Ce fichier a été téléchargé à partir de PolyPublie, le dépôt institutionnel de Polytechnique Montréal
This file has been downloaded from PolyPublie, the institutional repository of Polytechnique Montréal
A flexible data-driven approach for execution trace
filtering
Kadjo Kouame
Ecole Polytechnique MontrealMontreal, Quebec h3t 1j4 [email protected]
Naser Ezzati-jivan
Ecole Polytechnique MontrealMontreal, Quebec h3t 1j4 [email protected]
Michel R. Dagenais
Ecole Polytechnique MontrealMontreal, Quebec h3t 1j4 [email protected]
Abstract—Execution traces are frequently used to study system run-time behaviour and to detect problems. However, the huge amount of data in an execution trace may complexify its analysis. Moreover, users are not usually interested in all events of a trace, hence the need for a proper filtering approach. Filtering is used to generate an enhanced trace, with a reduced size and complexity, that is easier to analyse. The approach described in this paper allows to define custom filtering patterns, declaratively in XML, to concentrate the analysis on the most important and interesting events. The filtering scenarios include syntaxes to describe various analysis patterns using finite state machines. The patterns range from very simple event filtering to complex multi-level event abstraction, covering various types of synthetic behaviours that can be captured from execution trace data. The paper provides the details on this data-driven filtering approach and some interesting use cases for the trace events generated by the LTTng Linux kernel tracer.
I. INTRODUCTION
”the most commonly adopted approach for observing and analyzing the behaviour of distributed systems has been event-driven monitoring[...]. System behaviour is monitored in terms of a set of primitive events representing the lowest observable system activity, Users specify composite events using compo-sition operators relating to event sequences which may span events from several processes and temporal constraints. For example a composite event can be defined s event e1 followed by event e2 within a window of 5 seconds. A composite event is detected w hen the specified pattern of events is recognized but the variable event delays make detection of distributed composite events particularly challenging- how to detect a composite event which is not invalidated as a result of a late-arriving event to which it refers. Current systems either do not address this problem or provide limited flexibility to deal with it.” ”another issue that needs more attention is the changing monitoring requirements. As the system evolves there may be a need to dynamically change the patterns of activity which is monitored without having to bring the operation of the system to a halt so there is a need to dynamically change event specifications. For efficiency purposes it would be best to perform monitoring activities as close to the source of event reports as possible. This stipulates a dynamic and distributed event monitoring service.
GEM allows the programmer to specify arbitrarily complex (composite) events and guards in the LHS of the rules. ”
With the increasing core count and sophistication of today’s complex computer systems, it becomes difficult to find and locate flaws because they are usually running distributed applications and cannot be stopped for debugging, or because the suspected problems occur rarely. Tracing is hence a good way to collect information about system run-time behaviour, since it is collected on live systems but can be analyzed later by developers and administrators, in order to understand the system’s behaviour and finally detect and resolve its problems. The tracing of the Linux kernel using the Linux Trace Toolkit next generation (LTTng) [1] is a mature process that records the complete interaction of the different kernel modules in an events log.
However, there can be a huge log of trace data, even for a small system execution duration, but with only a small subset of events that are significant to the users, complicating the analysis. Thus, it becomes necessary to reduce the size and complexity of the trace. One proper solution to this problem is trace abstraction [2], [3], which generally consists of grouping raw trace data and generating synthetic and high-level events that could replace the raw data in the trace. Another solution is events filtering which allows to only analyze an interesting sequence of events from a trace. Trace filtering actually eliminates outlier trace events and noise, and highlights a selected set of trace data based on either the type of events, timestamps, process name, event arguments or even the priority or importance of an event [4], [5].
Both trace abstraction and trace filtering techniques may need to match some patterns within the trace to be fully helpful and effective. There are many techniques in the literature that use pattern based techniques to abstract or filter out the trace data [6], [7], [8]. However, they usually use a constant set of patterns, mostly hard-coded in the system, which reduces the flexibility of the approach. Users are only limited to the predefined patterns of abstraction scenarios. Our solution solves this problem by allowing users to define their analysis patterns using a XML-based language and import them dynamically during the analysis time, which can enhance the flexibility and usability of the approach.
The remainder of the paper is organized as follows: after discussing the related work, the architecture of the approach and the syntax of our XML-based language is presented. Then are discussed some use-cases, the strengths and weaknesses of
the approach, and finally an outlook of future work.
II. RELATEDWORK
Research and development in the area of event filtering has already been addressed in prior work. Various papers have expressed opinions and findings on pattern description languages in the past filteringmalony, filteringsudanshu, fadel, wahab-correlation, ezzati. In [6], [8], the authors divided these description languages into several categories and give examples for each category. Their solutions, in general, are not a stateful approach, which would preserve the common and recent status of the analyzer and would avoid recalculating and regenerating this status frequently [3], [9]. Our solution solves this problem by providing a model database, to store the common and recent states of the pattern matching processes, to extract the recent data at any given point, and also to share the common data between the different processes, to increase the overall performance of the approach.
Steven Eckmann et al. [10] presented an automata-based language, called STATL, to describe scenarios for intrusion detection. They provide details on the syntax of the language before giving use-cases of attacks. Gabriel Matni et al. explain in [6] the interest of choosing a state machine approach to describe patterns. They express the benefits of this choice based on the ”simplicity and expressiveness” of the state-transition language ([6]), the domain independence advantage and the ease to generate synthetic events. Wasseem Fadel in [7] and also Naser Ezzati et al. in [3] generate synthetic events to realize trace abstraction, using state machines to describe patterns. The patterns are then stored in a library that will help to simplify the analysis and reduce the trace size.
Most of the patterns and scenario description languages pre-sented in the above literature are application-specific, and the semantics used sometimes hinders the extension and addition of new types of patterns. For example, the STATL language [10] is designed specially for intrusion detection, or the kernel trace analysis proposed in [8] is specific to fault identification. Our approach is somewhat generic. It supports different trace types and different filtering methods and does not force users to a specific usage or a specific type of detection.
Our solution can be used to filter out different types of trace data based on different criteria, including trace event names, timestamps, synthetic events, state of a system (or state of a system module), etc, which are defined and provided though an XML syntax. Our approach is somewhat similar to STATL [10]. However, we describe scenarios using an XML automated-based architecture, which makes the definition of patterns generic.
III. ARCHITECTURE
As mentioned earlier, the most advanced trace tools do support some sort of trace abstraction and filtering. However, one limitation of those tools is that they are only available for a specific trace format and analysis. They usually provide a few predefined filtering and analysis methods, so that users are forced to use only those available features.
The goal of this work is, however, to provide a generic trace filtering method, allowing users to define their own custom analysis patterns and views using a proposed XML-based language. In this data-driven approach, users can define their patterns and scenarios to abstract and filter information out of the trace data (at different granularity levels) and output the only interesting (aggregated) part of the trace data.
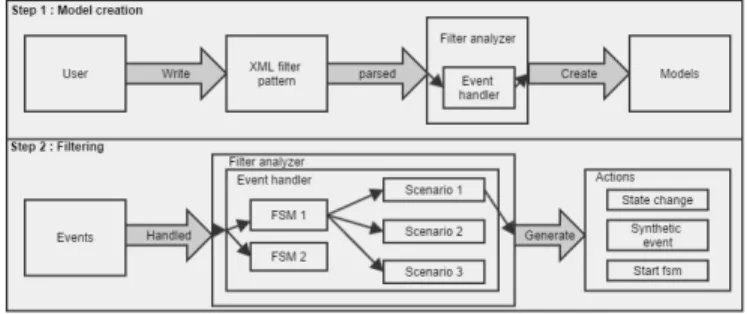
Fig. 1. Data processing in the filter analyzer
The architecture of the new system is displayed in Figure 1. This generic data-driven trace filtering method works in two main steps:
• Model creation, to create a model from the given user-defined XML pattern: users can define their filter patterns using the proposed XML pattern description language. Then the event handler, inside the analyzer, parses the XML file and creates models from that. The analyzer transforms all the FSMs, transitions and actions in the XML file into JAVA models. These JAVA models are used in the second step in order to parse and filter the data. • Event filtering, to use the generated models to scan and
analyze the trace events and generate the desired outputs: the Filter analyzer is the module designed to use the input XML patterns to filter out the data in the trace. It is a JAVA module implemented as a plug-in for the Trace Compass project1. The main section of this filter analyzer, as shown in Figure 1, is the event handler that applies the filtering patterns against the incoming events. The event handler receives the events one by one. The incoming event is passed to the FSMs. Each FSM has a list of running scenarios. It gives the receiving events to each of the running scenarios. Then, the scenarios process the filters and execute the needed actions before examining the next event.
A. XML language structure
In the following, we present the proposed XML language. It explains how the patterns are defined and modeled. First, the motivation for selecting XML to describe the scenarios is explained:
• Simplicity: Pattern descriptions are accessible since the XML syntax is fairly easy to understand. Users can define
their own scenario. Adding new patterns is then easy to do.
• Flexible patterns: Since the XML language is extensible, we design our own tags in a way such that possible scenarios are not limited to some specific application, such as attack detection or kernel interactions, etc. Our state machine operates through three main entities that are directly defined in the XML file by the users: FSM (Finite State Machine), Transition Inputs, and Actions. The example shown in Figure 2 is used to describe these different entities. This sample pattern is used to extract the ”current running thread for each CPU” at any given time of the execution.
Fig. 2. XML description to handle the CPU scheduling event
1) FSM: A FSM is a Finite State Machine to indicate the patterns to match. It has an ID and an attribute called ’multiple’ which is a boolean that tells if several instances of this state machine are allowed to run concurrently on the same event sequence. A FSM contains a state table that defines all the states in the scenario. The state table contains one or more state definitions. A FSM also supports conditions and pre-actions in its description. An XML file can have more than one FSM described within it. This allows to process more than one independent scenario at the same time, or even scenarios that depend on one another. It is then necessary to specify in the file which FSM should start running at the beginning.
State definition: A state definition is to define different states of a state machine and its possible transitions and actions. Each state definition has a mandatory unique name to label the state.
Transition: The transitions describe how to switch between the states. It contains an input attribute which is the ID of the transition input that will trigger this transition and an action to execute when the input is validated. The transition allows to know what is the next step in the state machine.
2) Transition Input: A transition input is the input of a transition in a state definition. It actually shows who can trig-ger a state transition. In general, the input can be any (group of) raw trace event(s), or any (group of) synthetic event(s), which may have resulted from another filtering pattern.
The input can also be based on conditions over the trace events. It is the validation of these conditions that will in fact trigger the corresponding transition(s) within the states. We
distinguish two types of conditions: conditions on the event data and conditions on the time values. The conditions based on event data can validate the name of the event and/or some fields of the current event. On the other hand, conditions based on the time are valid if the received event happened within a range of time from a starting point of that event, or if the received event happened between two specific timestamps.
Both condition types support basic boolean operations: and, or, not. The transition inputs used by the transitions are listed at the beginning of the XML file, so they can be used by all FSMs described in the file.
3) Action: An action is the operation that is executed when a pattern is matched (i.e., when a transition is valid). We define 4 types of actions:
• State changes: they are used to store data in the state system (which will be explained shortly). It allows to modify or add values in the state system. These values can be used in other states to validate conditions or to add information about the state of the system.
• Synthetic event creation: It is possible to generate a synthetic event within the execution of the state machine. They can then be used either to realize abstraction and reduce the size and complexity of the trace, or also as conditions for transition’s inputs for later analysis. • Starting of another FSM: A new instance of a state
machine can be generated by an action. The ID of the FSM must be specified.
• UI action: A UI action may be defined in the XML file. For example, we can select a range of events in the analysis. It is possible to select, either all the events from the start of the scenario until the current state or to only select the events that have triggered state changes. It is also possible to aggregate several actions either in the action tag and/or in the transition. The actions will then been executed in the order of their appearance.
B. Data Structure: State system
The reader may have noticed the existence of different notions of ”state” in the XML sample shown in Figure 2. There actually exists two main notions of ”states” here. One is used as part of any normal state machine, as widely used in the related literature. Another definition of ”state” is the one that is used here in the ”¡state change¿” (i.e., part of the ¡Action¿). The meaning of ”state” in ”state change” is somewhat different. It refers to a generic data model called ”State System” [11] that was used to store a model of the state of the traced system, built from the information in the events, as they are processed.
The state system is a set of data structures that acts like a temporal database [12]. It is actually a generic container in which users store their own custom-defined models. As mentioned earlier, in our design, there is no limitation on how users can define their models. They define their custom models using the aforementioned XML structure and then, while processing events, build and store the model into this generic model container which is called ”state system” . The
models stored in the state system are used later to retrieve, analyze and also visualize the information [9].
The state system uses an interval tree to store the state intervals [11] providing a complete description of the state history of the modeled system. This data structure is very convenient since it enables querying the stored values by time. It is then possible to access the stored data to use with transition’s inputs or at the analysis level. We create a ”state value” for each value that we want to save in the state system. The state system produces state changes to store each state value and ”each attribute value, between two changes, represents a state interval” [13]. The state system uses a state provider to build the state from the trace events. Thus, our pattern matching system proceeds with the analysis of the trace using a state provider. The use of the state system reinforces the generic side of the proposed XML approach.
We use the state system to store both the ”internal data” that give information about the state machine during its execution, and the ”external data” defined by the users. This makes the FSM state visible in order to easily verify and understand their operation and correct eventual errors in their definitions. The information saved in the ”state system” can be timestamps, status, number of matches, fields, etc. that will be useful for the analysis or debugging of the state machines.
It is also possible to specify at the top of the XML file a list of fields that we want to automatically save in the state system each time we see them in an event. Then, we can activate in the state definitions the transitions upon which we want to save these ”special fields”.
C. Visualization filter view
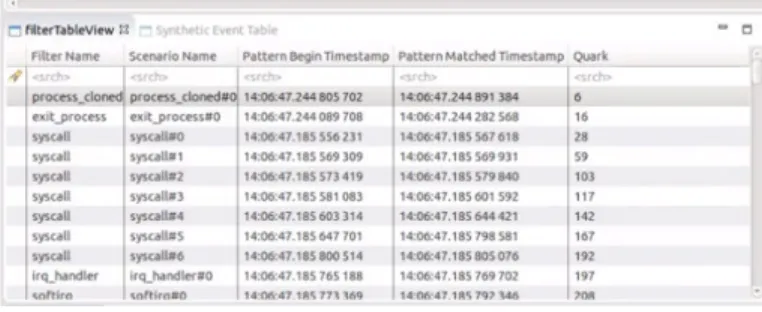
A few visualization views are designed to display the output of the filtering patterns. The filter view is a tabular view to display the matched patterns. It shows those patterns that are matched during the analysis. For each matched pattern, it gives the timestamps of the matching duration, the number of events included, the pattern name and some other information. Figure 3 displays this view.
Fig. 3. A filter table view to display the matched patterns.
Synthetic events view
Another view is to display the synthetic events that are generated during the trace analysis. As explained earlier, the filtering module may generate some synthetic events to show
high level aspects of the trace or to use as an input in the future filtering phases. Figure 4 depicts the synthetic events view.
Fig. 4. A synthetic table view to display the resulting abstract events.
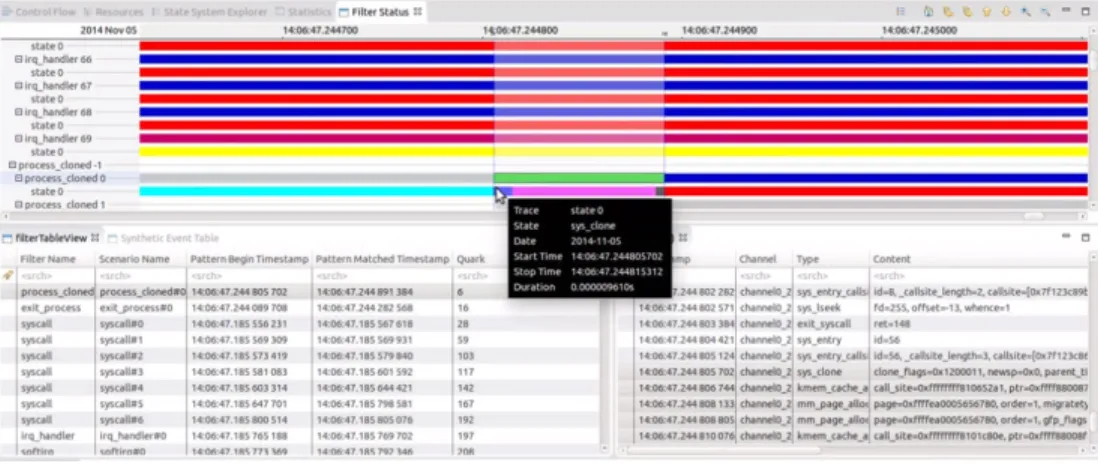
Filter status (Debug) view
Another interesting view is the filter status view (or debug view) used to debug the pattern matching process. It enables users to go back and forth in the trace and display the different internal states of the pattern matching processes. It can be used to follow and dig into a pattern to see how and why it is matched (or not matched). Figure 5 depicts this filter status (debug) view.
The view shown in Figure 5 displays the status of the matched pattern (i.e., process cloned) for the given time (i.e., state 0). Users can go back and forth to follow other possible states of this pattern.
IV. ILLUSTRATIVEEXAMPLE ANDDISCUSSION
In this section, we provide an example of our approach: a fault detection scenario that can be performed using our proposed system. The ”SYN flood”2is a well-known attack in computer network security. A system is under attack when the number of half-open TCP [14] connections reaches a certain threshold. A half-open TCP connection is globally an attempt at a connection that fails at the last step of the TCP three-way handshake. Instead of receiving an ACK response from the client, the server reaches a timeout event, meaning that the client never answered. It is a kind of denial-of-service attack which aims at making the server unavailable by flooding it with queries. For this scenario, we use 2 FSMs: One FSM to match or detect the half-open TCP connections pattern in the trace and another one to match the threshold of synthetic events of half-open TCP connections generated by the first FSM.
The steps for an half-open TCP connection are:
• The client sends a request for connection. The SYN flag of the TCP header is then set to 1.
• The server responds with a SYN and ACK in the TCP header flags. The acknowledgment sequence number of the server is equal to the sequence number of the client plus 1.
• The pattern is matched when a timeout is generated because the client never answers to the server with an
Fig. 5. A synthetic table view to display the resulting abstract events.
ACK, or if the client tries to reset the connection with the server by setting the RST flag to 1 and using the acknowledgment sequence number of the server in the previous step as its sequence number.
We used the flags and the value of the sequence numbers to define the conditions for transition inputs in the XML description of the scenario. We generated a synthetic event for each half-open TCP connection we found. Then, when the number of half-open TCP connections reaches a predefined threshold, we generate a ”SYN flood attack” synthetic event. For our testing, we used a timeout of 3 seconds and a threshold of 100 attempts. The main part of this filtering pattern is shown in Figure 6.
Fig. 6. Pattern for detecting syn-flood attack.
The hping3 tool3is used to simulate a SYN flood attack on the system. We used LTTng version 2.4.0 to record information about the network connections by enabling the ’inet’ events
3http://www.hping.org/hping3.html
and all the kernel events. We sent requests to an Apache server running on Ubuntu SPM 14.10 (running kernel version 3.13.0-43). We instrumented an Intel core i7 with 8 GB of RAM. We traced the system for a small duration, but long enough to have a lot of half-open TCP connections. The whole XML file that describes this scenario is accessible from our public web page 4. Our described pattern has 2 coexisting FSMs. Our pattern has generated 569 half-open TCP synthetic events and 1 SYN flood synthetic event5
1) Discussion:
Generic-ness: The proposed solution uses an XML based language to define filtering patterns. Using these patterns, users can define and generate their own custom trace analysis models to extract and visualize their desired outputs. Although we have tested it using kernel traces, since there is no limitation on the models that users can define, using a generic container called ”state system”, the proposed method can be used for other types of trace data. In this system, users can define their patterns based on their custom trace events (as we did for kernel trace events as an example) and can define the custom structure of their internal model (to be stored in the ”state system”). As explained, there is no constraint on the the format of the traces supported by this solution. It can be used for any trace data including the trace events of the LTTng (kernel/user space) Tracer, DTrace, Event Tracing for Windows (ETW) or any other trace formats.
Performance: First of all, we compare our method when it uses hard-coded patterns versus the case where it imports patterns from an XML file. As mentioned in the Architecture section, and as shown in Figure 1, the proposed method works by importing the XML pattern and converting it to a Java-driven model. Then for processing the trace (which can be the time-consuming phase) the Java-based model is used. Thus, the only performance difference between this data-driven approach, and a similar approach that uses hard-coded patterns, is the time required to convert the XML patterns to
4http://secretaire.dorsal.polymtl.ca/ jckouame/xml files/
5A full video demo of this work can be found here:
the java-based model. Since it is a one-time process, it can be negligible as compared to the magnitude of the whole trace analysis time. Table I, an experimental comparison of the two methods, clearly illustrates our claim.
150 MB Trace XML JAVA Average Time (second) 70.092 67.663 Min 66.902 65.891 Max 73.724 73.358
TABLE I
MODEL CONSTRUCTION TIME FOR A150 MBKERNEL TRACE.
However, since the method is still under further develop-ment, it might be difficult to give a comprehensive perfor-mance evaluation. However, we can discuss the criteria that affect the performance and suggest potential optimizations. In a similar previous work [6], mentioned in the literature, Gabriel Matni et al. [6] discussed the performance of their solutions. The criteria they listed are similar to ours. First, the performance of our solution is directly related to the number of instances of scenarios running at the same time. In our SYN flood example, we have 569 instances of the half-open TCP scenarios running at the same time, if we remove the timeout condition and wait directly for the reset flag. For a received event, each of the 569 instances of scenarios will attempt to validate its corresponding transition, which means that with an average of 3 transitions per state. Our analyzer will thus process 1707 conditions per event. This number increases with the number of coexisting scenarios and is even worse with a trace full of irrelevant events. A solution to that issue, as describe in [6], could be to only activate the relevant events.
Filter events, provided only by a specific thread, could reduce the data computation. We can achieve this by defining a precondition for the thread in the FSM definition in XML, in the same way that we could define preconditions in order to only analyze events that may change the state of the scenario. In addition, the complexity of the conditions could be a bottleneck since the conditions can be complex and have several subconditions. Users should optimize their state machines and reduce conditions as much as they can. This will help to reduce the analysis time. Moreover, longer conditions, and complex scenarios, even if they may be easy to write, become difficult to understand and to debug.
V. CONCLUSION ANDFURTHERWORK
In this paper, we presented a data-driven approach to match generic filtering patterns within the trace. The difficulties related to the amount of information were then reduced. This work will complete previous research from [6], [7], [3], [8]. It provides a pattern description language and user-friendly analysis that reflects the matched patterns. We use the state system to store scenario’s temporary data. It is easy to use and the data backup is already managed. An analyzer creates mod-els from the XML file and uses them in order to process and filter the trace data. The simplicity of the XML language eases
both the description and the understanding of the patterns. Our proposed language runs with some simple key concepts that users should use. Patterns for several applications can be created. Synthetic events can be generated and are used to locate the patterns in the analysis, and can provide details about the matched scenarios.
This research is still in progress. We have yet to describe more patterns with this language in order to refine our pro-posed XML-based language. Also, more optimization will further improve the effectiveness and performance of our solution.
ACKNOWLEDGMENT
The support of the Natural Sciences and Engineering Re-search Council of Canada (NSERC), and Ericsson Software Research is gratefully acknowledged. The authors would also like to thank Genevieve Bastien for her help in the open source project Trace Compass.
REFERENCES
[1] M. Desnoyers and M. Dagenais, “Lttng: Tracing across execution layers, from the hypervisor to user-space,” in Linux Symposium, p. 101, 2008.
[2] A. Hamou-Lhadj and T. C. Lethbridge, “A survey of trace exploration tools and techniques,” in Proceedings of the 2004 conference of the Centre for Advanced Studies on Collaborative research, CASCON 04, pp. 42–55, IBM Press, 2004.
[3] N. Ezzati-Jivan and M. R. Dagenais, “Stateful synthetic event generator from kernel trace events,” Advances in Software Engineering, January 2012.
[4] H. Pirzadeh, S. Shanian, A. Hamou-Lhadj, and A. Mehrabian, “The concept of stratified sampling of execution traces,” in Program Comprehension (ICPC), 2011 IEEE 19th International Conference on, pp. 225 –226, june 2011.
[5] N. Ezzati-Jivan and M. R. Dagenais, “An efficient analysis approach for multi-core system tracing data,” in Proceedings of the 16th IASTED International Conference on Software Engineering and Applications (SEA 2012), 2012.
[6] G. N. Matni and M. R. Dagenais, “Operating system level trace analysis for automated problem identification,” The Open Cybernetics and Systemics Journal, April 2011.
[7] W. Fadel, “Techniques for the abstraction of system call traces,” Master’s thesis, Concordia University, 2010.
[8] H. Waly, “A complete framework for kernel trace analysis,” Master’s thesis, Laval University, 2011.
[9] A. Montplaisir, N. Ezzati-Jivan, F. Wininger, and M. Dagenais, “Efficient model to query and visualize the system states extracted from trace data,” in Runtime Verification (A. Legay and S. Bensalem, eds.), vol. 8174 of Lecture Notes in Computer Science, pp. 219–234, Springer Berlin Heidelberg, 2013.
[10] S. Eckmann, G. Vigna, and R. Kemmerer, “Statl: An attack language for state-based intrusion detection,” Journal of Computer Security, vol. 10, no. 1/2, pp. 71–104, 2002.
[11] A. Montplaisi, “Stockage sur disque pour acces rapide d attributs avec intervalles de temps,” Master’s thesis, Ecole polytechnique de Montreal, 2011.
[12] A. Montplaisir, N. Ezzati-Jivan, F. Wininger, and M. Dagenais, “State history tree : an incremental disk-based data structure for very large interval data,” in 2013 ASE/IEEE International Conference on Big Data, 2013.
[13] F. Wininger, Conception flexible d’analyses issues d’une trace syst`eme. PhD thesis, ´Ecole Polytechnique de Montr´eal, 2014.