Feature-based tracking of urethral motion in low-resolution trans-perineal
ultrasound
This paper describes a novel algorithm for tracking the motion of the urethra from trans-perineal ultrasound. Our work is based on the structure-from-motion paradigm and therefore handles well structures with ill-defined and partially missing boundaries. The proposed approach is particularly well-suited for video sequences of low resolution and variable levels of blurriness introduced by anatomical motion of variable speed. Our tracking method identifies feature points on a frame by frame basis using the SURF detector/descriptor. Inter-frame correspondence is achieved using nearest-neighbor matching in the feature space. The motion is estimated using a non-linear bi-quadratic model, which adequately describes the deformable motion of the urethra. Experimental results are promising and show that our algorithm performs well when compared to manual tracking.
Frédéric Jean
Alexandra Branzan Albu Chantal Dumoulin
SECTION I.
INTRODUCTION
Stress Urinary Incontinence (SUI) can be defined as the involuntary leakage of urine due during coughing, sneezing, and moderate to intense physical activities. SUI is considered a “hidden epidemic” since it affects a large part of the female population, particularly at later stages in life [1]. SUI has a significant negative impact on the quality of life of elderly women.
Urethral hypermobility and loss of pelvic-floor muscle support have been identified as primary causes of female SUI [2]. These two phenomena are typically studied using imaging technologies and force-based measures of contractility via vaginal probes.
As mentioned in Constantinou et al [3], most visualization studies to date have focused on measuring the displacement of the urethra and bladder neck occurring from the initial to the final moments of a cough, a pelvic floor contraction or a Valsalva maneuver (i.e. an attempt to forcibly exhale while keeping the mouth and nose closed). However, in the study of SUI, the dynamic information regarding the motion of the anatomic structures of interest (urethra, bladder, pelvic floor muscle) cannot be disregarded. Motion trajectories of the structures of interest can be extracted from 2D ultrasound videos with computer vision techniques.
Peng et al [4] propose an algorithm for tracking the motion of the urethra and the ano-rectal junction based on edge detection and automatic segmentation of the tissue boundaries. However, in trans-perineal
ultrasound, the boundary of structures are often times ill-defined as fast motion blurs the image. Moreover, these structures exhibit a high inter-patient variability in terms of contrast, brightness, and signal to noise ratio.Fig. 1 shows an example of a well defined (left) and a ill-defined (right) structure within red bounding box.
Fig. 1. Example of trans-perineal ultrasound for two different subjects.
Fig. 2. Approach overview.
Bonneau et al [5] have recently proposed a tracking method based on optical flow, which is based on the structure-from-motion paradigm. We adopt the same structure-from-motion viewpoint. To quantify kinematic parameters of the urethra during contraction and effort, we propose a novel feature-based tracking algorithm. The main strength of feature-based tracking is that the segmentation of moving structures is not required for tracking. Moreover, no over-simplifying assumption about the nature of the motion is made, since the motion is estimated using a non-linear, bi-quadratic model. The remainder of the paper is structured as follows. Section 2 presents the proposed approach, while section 3 describes the experimental results and their evaluation. Section 4 draws conclusions and outlines future work directions.
SECTION II.
PROPOSED APPROACH
An overview of the proposed approach is presented in Fig. 2. The first step, which is shown as a blue box, is an initialization performed by the user off-line. It consists in manually defining the Region of Interest (ROI) and the Object of Interest (OOI) in the first frame of the ultrasound (US) video sequence. The OOI is
the object for which the user wants to obtain the motion trajectory. In the context of our application, the urethra is the only tracked object of interest. The ROI is defined as a rectangular region which contains the OOI during the whole sequence.
Fig. 3. Example of ROI and OOI, feature points detection, and feature points correspondence. In (a), the
red rectangular area and the red curve represent respectively the ROI and the OOI defined by the user in the first frame. In (b), the position of the detected feature points for a given frame are shown as blue squares. In (c), the position of the detected feature points for the next frame are shown as yellow circles. In (d), the correspondences between the feature points of the two frames are shown as yellow lines.
The automatic part of the proposed approach lies in the dashed box of Fig. 2 and consists in four steps that are performed on a frame by frame basis. For a given frame, the first step consists in detecting feature points in the ROI. Next, these feature points are matched with the ones that were detected in the previous frame. The matched points are then used to fit a model describing the motion in the area covered by the ROI. Finally, the OOI in the previous frame is transformed according to the motion model obtained in the current frame. The following sections provide details for all steps of the proposed approach.
A. Definition of the ROI and the OOI
The Object of Interest (OOI) is represented by a list of ordered points representing the contour or a border of the object in the first frame of the video sequence. The M points specified by the user at frame n=1 are denoted pm,n, where m=1,2,…,M. The ROI is defined by the user by defining a rectangular area in the image. It is mostly used to speed up the processing time and to limit the complexity of motion model needed to represent the motion in the surrounding area of the OOI. An example of defined ROI and 00I is shown in Fig. 3(a). The rectangular red area represents the ROI, and the red curve represents the OOI, which is the urethra.
B. Detection of the Feature Points
The detection and the description of the features points is performed using SURF [6], which is a robust, scale and rotation invariant feature points detector and descriptor. In each frame n of a video sequence, there are Sn detected feature points. The position in the frame n of each 2- D feature point is denoted si,n ‘ with i=1,2,…,Sn. In this work, we use the extended version of the feature point descriptor, which is a
128-D vector denoted di,n. An example of detected feature points for two consecutive frames is shown in Fig. 3(b) and 3(c). Only the position of the feature points are shown in the frames (the size and the orientation of the feature points is not used in this work).
C. Correspondence of the Feature Points
In order to match the feature points of two consecutive frames n−1 and n, the Euclidean distance is computed between each pair of feature descriptors (di,n−1, dj,n):
zi,j=∥di,n−1−dj,n∥, (1)
where i=1,2,…,Sn−1 and j=1,2,…,Sn. The set of feature point pairs that are considered to correspond between frames n−1 and n is defined as
Cn:{(si,n−1,sj,n)|zi,jzi,k<ρ, i=1,2,…,Sn−1
j=argminℓ(zi,ℓ), k=argminℓ≠j(zi,ℓ),
ℓ=1,2,…,Sn}. (2)
Thus, a feature point sj,n corresponds to the feature point si,n−1 if and only if the descriptor dj,n is closer to the descriptor di,n−1 than to any other descriptor in frame n, and that the distance zi,k to the second closest descriptor dk,n in frame n is at least ρ−1zi,j. This modified nearest neighbor increases the robustness of the correspondence by discarding uncertain matches. One assumption made in the correspondence process is that the acquisition frame rate of the US system is high enough so that the features remain recognizable when the motion is fast in the ROI At frame n, there will be Cnpair of points in correspondence, with c=1,2,…,Cn. The position of this feature points pair will be referred to as (pc, qc) in the following, where pc is a point in the previous frame n−1, and qc is the corresponding point in frame n.
A typical case of feature points correspondence is shown in Fig. 3(d). The feature points that were detected in the previous and the current frame are shown in Fig. 3(b)and 3(c) respectively. The correspondence between two feature points is presented as a yellow line segment joining the position of the feature points. Here, a value of ρ=0.8was used by the correspondence procedure. Since the motion between the two frames was slow, the line is mostly invisible for a good feature points correspondence. The lines become visible only for incorrect correspondences, while correct ones show the feature points in partial or total overlap. One may conclude that most feature point correspondences established between the two shown frames are correct.
D. Estimation of the Motion Transform
The motion between frame n−1 and n is estimated by fitting a model on the set of corresponding feature points. The motion can be quite different in some parts of the ROI, therefore a non-linear model of the
motion in the ROI is necessary. A good compromise between flexibility and complexity is the bi-quadratic model. A bi-quadratic model can be represented by a 2×6 matrix T that transforms a 2-D point uinto a 2-D point v=Tf(u):
(3) where vx and vy are the x and y component of the point v respectively. The vector function f(u) transforms a 2-D points u into a 6-D vector defined as
(4)
A bi-quadratic model has 12 parameters and thus requires at least six pairs of corresponding points to be fitted, as each pair provides two constraints on the model parameters. Given a number K>6 of corresponding points vk and uk, k=1,2,…,K, a bi-quadratic model can be fitted by solving a linear equations system of the form Ax=b:
(5)
where A is a 2K×12 matrix, 0 are 6 ×1 vectors of zeros, x is a 1×12 vector, and b is a 2K×1 vector. A least square solution can be obtained as x=A+b, where A+≈VD−10U⊤. The matrices V and U are obtained from the decomposition A=UDV⊤ (Singular Value Decomposition), and D−10 is a diagonal matrix where the non-zero values are the inverse of the non-zero singular values in the diagonal matrix D.
A robust fit for the bi-quadratic model at frame n is obtained by performing an adaptive RANSAC procedure, where the number of iterations is automatically determined as described in [7]. For each RANSAC iteration i, a samples set Si of six points pairs (pc,qc) is randomly chosen from the set of feature point pairs Cn. These points pairs are used to compute an estimated model transform matrix T^. A points pair (pc,qc)∉Si is added to the consensus set Ri at iteration i if
∥qc−q′c∥=∥∥qc−T^f(pc)∥∥≤ α,(6)
that is, if the transformation error is less that α pixels. In this paper, we use a value of α=5.0 pixels. The sets Ri and Si at iteration i are kept only if the cardinality of Ri is greater than the consensus sets that have been obtained in the preceding iterations. Once the RANSAC algorithm has converged, the transformation matrix Tn at frame nis computed using all the points pairs in the best consensus set along with the set of six points that led to it.
Fig. 4. Examples of computed urethra motions for US video sequences of three different subjects. The list
of points representing the urethra is coloured with a different colour at each frame, from yellow to red.
E. Transformation of the Object of Interest
The points list pm,n representing the OOI at frame n is computed from the points list pm,n−1 at frame n−1 using the obtained bi-quadratic transform matrix Tn:
pm,n=Tnf(pm,n−1),m=1,2,…,M.(7)
Since the bi-quadratic model encodes the motion (and thus the deformation) that occurred in the ROI between frame n−1 and n, the list of points representing the OOI in frame n−1 will be transformed accordingly. Fig. 4 shows examples of urethra motions that were computed by our algorithm. The list of points representing the urethra is coloured with a different colour, ranging from yellow to red, for each frame. From the three examples, one may note the variability in the shape of motion, which ranges from translational to a twisting motion. This confirms the need of a non-linear, biquadratic model for motion estimation.
SECTION III.
EXPERIMENTAL RESULTS
The ultrasound video sequences were acquired during an observational study that characterized the morphology and function of the female pelvic floor in urinary incontinent older women. Women 60 years and older were recruited and included in the study, if they were independently ambulatory, were incontinent and reported, at least, weekly symptoms of stress urinary incontinence. Women were excluded if they reported other conditions or were taking medications likely to interfere with the study. An experienced pelvic floor physiotherapist taught the women to perform pelvic contractions correctly; their technique was confirmed by digital palpation. Imaging used an Acuson Antares TM ultrasound machine (Siemens, USA Inc) with a 5−3 MHz curvilinear probe. During the imaging, the women were positioned in the supine position with their knees bent. Trans-perineal 2D ultrasound was used to study the kinematics of the urethra during pelvic floor contractions, coughs, and valsalva maneuvers.
The proposed approach was tested over a set of 15 ultrasound sequences where the OOI was the urethra. The frame resolution is 800×600, and the acquisition frame rate varied between 20 and 25 fps. The urethra was manually specified as a list of contiguous points in the first frame of each sequence, along with the ROI.
Fig. 5. Validation with ground truth for test sequence #4. In (a), the ground truth urethra. In (b), result from
Fig. 6. Validation with ground truth for test sequence #13. In (a), the ground truth urethra. In (b), result
from the proposed approach. In (c), error statistics on the test frames.
In order to evaluate the effectiveness of the approach, lists of contiguous representing the urethra were also manually fitted for a subset of frames of the test sequences. This is how the ground truth was generated for the validation of the proposed tracking approach. The manual fitting was performed on every tenth frame of the ultrasound sequences. However, the number of the fitted points is not always the same, and is thus different than the number of points specified in the first frame. The lists of transformed points obtained with the proposed approach were therefore sampled at each evaluated frame in order to be able to compute a point-to-point error with the ground truth points. The sampling process consists in interpolating points on the transformed OOI curve that will be compared to the ground truth points. It is based on the relative position of each ground truth point on the ground truth curve.
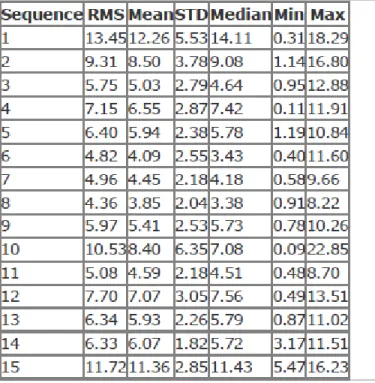
Figures 5 and 6 shows two examples where the point-to-point error statistics were computed on each evaluated frame. Table I presents the error statistics that were computed over all evaluated frames of a video sequence. One can see that the error is relatively small and it has a tendency to accumulate. However, the cumulative tendency does not yield large values for the absolute errors on frames with higher indexes. One must also consider that it is relatively difficult for a human evaluator to perform the manual fitting on low resolution frames. Indeed, the OOI can be difficult to see and to track in some frame where the motion is fast. This introduces a level on uncertainty in the location of the ground truth points, which in turn may influence the magnitude of the error.
TABLE I Error statistics over all frames of each of the 15 sequences.
SECTION IV.
CONCLUSIONS
This paper proposes a novel algorithm for tracking the motion of the urethra from trans-perineal ultrasound. The algorithm is well-suited for video sequences of low resolution and variable levels of blurriness introduced by anatomical motions of variable speed. The proposed tracking method identifies feature points using the SURF detector/descriptor. Interframe correspondence is achieved using nearest-neighbor matching in the feature space. The motion is estimated using a non-linear bi-quadratic model, which adequately describes the deformable motion of the urethra. Experimental results are promising and show that our algorithm performs well. Ongoing work focuses on extending our tracking approach for other pelvic structures and salient points such as the pelvic floor muscle and the ano-rectal junction. Future work will integrate image-based measurements with force-based measurements in order to provide a comprehensive assessment of pelvic floor disorders in incontinent women.
REFERENCES
1. J. O. DeLancey, "The hidden epidemic of pelvic floor dysfunction: Achievable goals for improved
prevention and treatment," Am. J. Obstet. Gynecol., vol. 192, no. 5, pp. 1488-1495, 2005.
2. G. M. B. et al., "Urinary incontinence in nulliparous women and their parous sisters," Obstet. Gynecol.,
3. C. E. Constantinou, Q. Peng, and S. Omata, "Visualization of the dynamics of the female pelvic floor
reflex and steady state function," in Computational Vision and Medical Image Processing. Springer, 2011, vol. 19, pp. 37-75.
4. Q. Peng, R. C. Jones, and C. E. Constantinou, "2D ultrasound image processing in identifying responses
of urogenital structures to pelvic floor muscle activity," Ann. of Biomedical Engineering, vol. 34, no. 3, pp. 447-493, 2006.
5. P. Bonneau, A. Albu, and C. Dumoulin, "A motion-tracking algorithm to quantify kinematic parameters
of the urethra and pelvic floor on 2D transperineal US," in Proc. of CS/IUGA, Toronto, 2010.
6. H. Bay, A. Ess, T. Tuytelaars, and L. V. Gool, "SURF: Speeded up robust features," Comput. Vision
Image Understanding, vol. 110, no. 3, pp. 346-359, 2008.
7. R. I. Hartley and A. Zisserman, Multiple View Geometry in Computer Vision, 2nd ed. Cambridge
University Press, 2004.