1
Fate and trophic transfer of rare earth elements
in temperate lake food webs
Marc Amyot†,*, Meredith G. Clayden†, Gwyneth A. MacMillan†, Tania Perron† and Alexandre Arscott-Gauvin†
†Groupe de recherche interuniversitaire en limnologie et environnement aquatique (GRIL),
Département de sciences biologiques, Pavillon Marie-Victorin CP6128, Succ. Centre-Ville, Montréal, Québec H3C 3J7, Canada
* Corresponding author: Marc Amyot; phone: 514-343-7496; e-mail: m.amyot@umontreal.ca
This document is the unedited Author’s version of a Submitted Work that was subsequently accepted for publication in Environmental Science & Technology, copyright © American Chemical Society after peer review. To access the final edited and published work
see http://pubs.acs.org/doi/full/10.1021/acs.est.7b00739. KEYWORDS
Lanthanides, food webs, aquatic systems, bioaccumulation, biogeochemistry, trophic dilution, stable isotopes, depuration.
2 ABSTRACT
Many mining projects targeting rare earth elements (REE) are in development in North America, but the background concentrations and trophic transfer of these elements in natural environments have not been well characterized. We sampled abiotic and food web components in 14 Canadian temperate lakes unaffected by mines, to assess the natural ecosystem fate of REE. Individual REE and total REE concentrations (sum of individual element concentrations, ΣREE) were strongly related with each other throughout different components of lake food webs. Dissolved organic carbon and dissolved oxygen in the water column, as well as ΣREE in sediments, were identified as potential drivers of aqueous ΣREE. Log10 of median bioaccumulation factors ranged from 1.3,
3.7, 4.0 and 4.4 L/kg (wet weight) for fish muscle, zooplankton, predatory invertebrates and non-predatory invertebrates, respectively. [ΣREE] in fish, benthic macroinvertebrates and zooplankton declined as a function of their trophic position, as determined by functional feeding groups and isotopic signatures of nitrogen (δ15N), indicating that REE were subject to trophic dilution. Low concentrations of REE in freshwater fish muscle compared to their potential invertebrate prey suggest that fish fillet consumption is unlikely to be a significant source of REE to humans in areas unperturbed by mining activities. However, other fish predators (e.g., piscivorous birds and mammals) may accumulate REE from whole fish as they are more concentrated than muscle. Overall, this study provides key information on the baseline concentrations and trophic patterns for REE in freshwater temperate lakes in Quebec, Canada.
3 INTRODUCTION
The demand for rare earth elements (REE, which include lanthanide metals, Sc and Y) is expected to grow significantly over the next 25 years1, and many new mining projects are being developed across North America. In Canada alone, a country that has the fourth largest rare earth oxide resources in the world after China, Australia and Russia2, there are currently more than 200 exploration projects under development. While the general local impacts of REE mining are expected to be similar to those of other hardrock minerals, the environmental impacts of the increased prevalence of REE in global surface waters are unknown 3. Moreover, certain REE applications, such as their use in agricultural fertilizers 4, have the potential to contaminate relatively large areas of aquatic and terrestrial environments. While overall REE profiles from atmospheric deposition have changed since the onset of industrialization 5, there is also evidence
that the modern use of REE is associated with increases in levels of total REE in aquatic environments 3, 6, 7. Although REE are indeed toxic under certain conditions to a variety of organisms 8, 9, further research is needed to determine whether there are patterns of toxicity that apply to the whole group of elements.
In addition to their toxicity, and unlike well-studied trace metals (e.g. Hg, Cd and Pb), it is unclear to what extent REE accumulate or biomagnify in aquatic food webs, and whether accumulation patterns differ from one element to another. A field study conducted by Mayfield and Fairbrother10 reported negative relationships between age or body size and REE concentrations for some fish species and elements, and inferred that REE had limited potential for biomagnification based on qualitative trophic position assessments of these fish. Weltje et al. 11
4
showed that the ratios of REE concentrations in snails to those in their presumptive feed (Potamogeton pectinatus pond weed) ranged usually between 1 and 5, indicating that the extent of biomagnification in this food chain was low. To our knowledge, very few studies have quantitatively related REE bioaccumulation with trophic position through natural aquatic food webs. This has become a major field of research for other contaminants, whereby stable isotopes of nitrogen and carbon (δ15N and δ13C) are commonly used to quantify the degree of trophic
transfer and potential sources of energy (carbon) and contaminants to food webs12, 13. This technique has allowed researchers to compare trophic transfer of contaminants among disparate aquatic food webs and relate potential differences to ecosystem characteristics 14, 15.
In areas unimpacted by mining activities, natural geological sources and atmospheric deposition are likely the main sources of REE to aquatic ecosystems. The concentration of REE in freshwater systems will depend on weathering, pH, redox (Eh) conditions, adsorption on iron and manganese oxides16 and clay minerals, as well as complexation with inorganic and organic ligands (e.g. CO3-2, PO4-3, humic and fulvic acids)17. Some REE, such as Eu and Ce, have different
oxidation states that lead to geochemical anomalies under certain pH and Eh conditions.
In order to better characterize the fate of REE in aquatic ecosystems unaffected by mining activities in North America, we studied 14 temperate lake ecosystems in southern Québec (Canada) and determined: 1) whether individual REE elements behave similarly, i.e. as a group, with respect to their concentrations in water and sediments and bioaccumulation patterns in aquatic organisms; 2) whether potential environmental drivers controlling REE levels in water and animals could be identified; 3) whether REE concentrations were a function of trophic position of
5
organisms through food webs, and whether REE are biomagnified or undergo trophic dilution in lakes. This study on ecosystems unaffected by mining provides important baseline information on the trophic patterns of REE in natural aquatic systems.
MATERIAL AND METHODS
Study sites
Our study sites included 14 lakes in southern Quebec (Canada) located in two geological provinces (three lakes in the Appalachian province and eleven lakes in the Grenville province) and along a significant water quality gradient, with values of dissolved organic carbon ranging from 2.6 to 8.5 mg/L and calcium levels ranging from 47 to 379 µM in surface waters (Fig. S1; Table S1). These lakes are relatively small (surface: 0.1 to 4.7 km2) and shallow (maximum depth: 7.6 to 25 m; Dr. Richard Carignan, unpublished data.). Nine of 14 lakes developed hypoxic hypolimnia with dissolved oxygen levels below 1 ppm. These lakes are representative of many North American temperate lakes not affected by mining activities. To our knowledge, the results of this study represent the largest data set on background REE levels in temperate lake ecosystems. These lakes are not located in an area known for rare earth mineral deposits and should therefore not be affected by local geological point sources. According to interactive provincial mineral deposit maps (http://sigeom.mines.gouv.qc.ca), some lakes in the Grenville province are located in the vicinity of deposits of iron (Croche – St.-Hippolyte, Pin Rouge), nickel (Goulet, Héroux), titanium (Pin
6
Rouge), and uranium (Méduse, Second Roberge), whereas lakes from the Appalachian provinces are near deposits of copper (Argent, Choinière, Orford) and gold (Argent, Orford).
Field sampling
In each lake, sediments, water, zooplankton, and benthic invertebrates were sampled within a period of two consecutive days, in late July or August of 2011 (lakes Chicot, Croche – Mauricie, Croche – St.-Hippolyte, Goulet, Héroux, Méduse, Perchaude, Pin Rouge, Second Roberge, Trottier) or 2012 (lakes Argent, Choinière, Morency, Orford). Fish were collected in early September of the same sampling year (2011 or 2012) within each lake. Unfiltered water was sampled in the epilimnion (0.5 m below the surface) and the hypolimnion (1 m above the sediments) of each lake at its deepest point, after having assessed the position of the thermocline by depth profiles with a YSI600QS multiparameter probe. A peristaltic pump with Teflon and Norprene tubing was used to collect unfiltered water in triplicate in amber glass bottles; samples were double-bagged, preserved with a final HCl concentration of 0.2% (Omnitrace Ultra, EMD) and kept at 4 °C. Glassware was acid-washed (45% HNO3; 5% HCl) as were plastic ware and
tubing (10% HCl) for 12 h, then rinsed three times with milliQ water (18.2 MΩ•cm). A protocol of "clean hands, dirty hands" appropriate for ultra-trace metal sampling18 was used to sample water.
Integrated zooplankton samples from the first 6 m of the water column were collected during daylight with a plankton net (200 µm mesh size), rinsed with milliQ water and frozen (-20 °C). Sediments were sampled at the deepest point with an Ekman grab (15 x 15 x 15 cm) and samples of the top 10 cm of sediments were frozen (-20 °C).
7
Benthic invertebrates were either sampled with a benthic kick net in the littoral zone or with a sediment grab sampler at deeper locations. Samples were sieved, sorted and identified to the lowest practical taxonomic level19 with the help of a dissecting scope. Taxa collected included Amphipoda (Gammaridae), Bivalvia, Chaoborus species, Chironomidae, Ephemeroptera (Caenidae, Heptageniidae, Leptophlebiidae), Gastropoda, Hydracarina, Isopoda, Megaloptera (Sialidae), and Odonata (Aeshnidae, Coenagrionidae, Gomphidae, Libellulidae). After sorting, benthic invertebrates were rinsed with Milli-Q water before freezing, without a depuration step.
A side experiment was conducted to assess the impact of depuration on REE levels measured in benthic invertebrates. Chironomids were collected in Lake Triton, a small Precambrian Shield Lake located at the Station de biologie des Laurentides (Université de Montréal). After sampling, half of the chironomids were immediately placed in vials and frozen (7 vials containing 4 chironomids each). The other half were placed in another series of 7 vials and left to depurate for 50 h before being frozen.
Beach seine (1 m x 20 m) and minnow traps were used to collect fish which were euthanized with a clove oil solution. Captured species included brown bullhead (Ameiurus nebulosus), creek chub (Semotilus atromaculatus), pumpkinseed sunfish (Lepomis gibbosus), smallmouth bass (Micropterus dolomieu), white sucker (Catostomus commersonii) and yellow perch (Perca flavescens). Fish samples were kept at -20 °C in re-sealable plastic bags until processing in the lab, where they were measured for length and weight. A dorsal muscle sample was taken from each fish with acid-cleaned forceps and scalpel, and stored at -20 °C in plastic bags. For one sample lake, Lake Croche (St.-Hippolyte), carcasses were also kept to compare the
8
difference in REE concentrations between carcasses and muscles. Note that carcasses contained all tissues except the tissue sample taken from the dorsal muscle.
Chemical analysis
REE measured in this study include Y, La, Ce, Pr, Nd, Sm, Eu, Gd, Tb, Dy, Ho, Er, Tm, Yb and Lu. Sc was excluded due to known analytical interference with ICP-MS analysis 21. All
biota and sediment samples were freeze-dried and homogenized prior to chemical analysis. For benthic invertebrates, whole bodies were pooled within taxa in each lake for stable isotope and REE analyses. For fish, samples of dorsal muscle for each individual fish were analyzed for isotopes and REE. All REE concentrations in sediments and biota are reported in nmol/g on a dry weight basis (d.w.). REE analysis in lake water was conducted on unfiltered samples and all water REE concentrations are reported in nmol/mL or in nM. For convenience, we also included summary data in units of nmol/g and ng/g in Table S8.
All REE analyses were conducted at the Université de Montréal by inductively-coupled plasma mass spectrometry (ICP-MS, Perkin-Elmer NexION 300x). Details on detection limits are reported in Table S2. Filtered water samples were preserved with HNO3 (2%) before analysis. For
sediments and biota, 2 to 100 mg of dried sample were digested in clean Teflon tubes (HNO3 45%,
HCl 5%) with 3 mL of trace metal grade HNO3 (70%) for 15 minutes at 170°C. Two more 15
minute cycles were completed after adding 0.5 mL of ACS grade hydrogen peroxide (30% H202)
before each cycle. Samples were diluted with ultra-pure water into trace metal clean falcon tubes before analysis. Quality assurance procedures for REE analysis included the analysis of blanks
9
and intra-lab standards (TORT-2; lobster hepatopancreas, NRC) for REE concentrations which were compared against concentrations determined by the Centre d’expertise en analyse environnementale (CEAEQ, Government of Québec) using the same extraction methods. On average, water samples varied by 17% compared to CEAEQ (Table S3), sediment by 7% (Table S4) and TORT-2 results by 13% (Table S5). Note that for sediments, we were below certified values as we did not use a full extraction method with hydrofluoric acid (HF), but a partial extraction more representative of the labile fraction which is available to organisms.
Stable isotope analyses were conducted at the G.G. Hatch Stable Isotope Laboratory (University of Ottawa). Approximately 1 mg of each biological sample (fish, benthic invertebrate or zooplankton) was weighed into tin capsules and analysed for nitrogen stable isotopes (δ15N) using an elemental analyzer (Elementar Isotope Cube) interfaced to an isotope ratio mass spectrometer (Thermo Conflo III and Thermo Delta Advantage). Nitrogen isotope values in all samples were standardized to atmospheric nitrogen (N2). Quality assurance samples included
triplicate analyses of an intra-lab standard with each batch, as well as duplicate analyses of approximately 10% of samples (summary in Table S6).
Water chemistry analyses
All lakes were sampled for water chemistry, including dissolved organic carbon (DOC; IO Aurora 1030 carbon analyzer), anions (ion chromatography, Waters), and cations (atomic, absorption spectrophotometer, Agilent). Quality assurance was performed using certified materials, namely Perade-09 for DOC (Environment and Climate Change Canada, ECCC) and RN-10 for anions and
10
cations (ECCC). In addition, the physico-chemical properties of the water column, including temperature, pH, conductivity, and dissolved oxygen, were measured using a YSI 600QS meter (YSI Incorporated). The probe was calibrated for quality assurance using standard pH solutions (pH of 4, 7 and 10, Hanna Instruments) and a standard solution of 100 µS/cm (Anachemia) for conductivity. Analytical details can be found in MacMillan et al.20 Morphometric data on the study lakes was obtained using ArcGIS software.
Data handling and analysis REE concentrations
Total REE concentrations were calculated as the sum of the concentrations of each individual element (ΣREE; Sc was excluded 21 ) in nmol/g of dry weight (biota and sediments) or
nmol/mL (water). For each element, REE concentrations in blanks were subtracted from samples where the REE blank concentrations were higher than the detection limit (DL). When the concentration of a given element in a sample was below the DL (to the nearest ± 0.001 ng/L), we used half the DL in the calculations. The frequency of detection of each element, sorted by sample type, is shown in Table S7. In the text, we also refer to heavy and light REE. Heavy REE include Y, Gd, Tb, Dy, Ho, Er, Tm, Yb, Lu17; Y is technically not heavy but is usually pooled with heavy REE because of its chemical behavior. Light REE include La, Ce, Pr, Nd, Pm, Sm, Eu 17, although the specific elements in each group vary between studies.
11
The taxonomic groups of captured benthic invertebrates (as well as the level of identification that was possible for different samples) varied across the 14 study lakes (Table S8). This is a common feature of studies that include lacustrine invertebrates and is compounded by issues such as the differences in maturity of individuals among systems (since many freshwater invertebrate taxa are short-lived). Therefore, functional feeding groups were assigned to all benthic invertebrate samples based on Merritt et al. 22 and Barbour et al. 23 (Table S8). The presence of
these feeding groups varied across lakes, so invertebrates were further grouped into either non-predatory (filter-collectors, gatherer-collectors, scrapers and shredders) or non-predatory groups within each lake. All Ephemeroptera were assumed to be non-predatory, given that the families collected were primarily gatherer-collectors22 (Table S8). The predatory Tanypodinae sub-family of Chironomidae were excluded from statistical analysis, and all other Chironomidae were assumed to be non-predatory given that the other two major sub-families, the Chironominae and Orthocladiinae, can be classified as such22, 23. Although benthic invertebrate samples were collected both in the littoral zone and at depth, only samples from the epilimnion (littoral samples and depth samples above the thermocline) were used in comparisons of REE concentrations between predatory and non-predatory invertebrates. All statistical analyses herein are based on these predatory and non-predatory invertebrate groupings.
Baseline δ15N adjustments
Within each lake, the δ15N composition of the lowest non-predatory invertebrate was used to adjust the δ15N values (δ15N
12
it possible to compare δ15N of food web organisms while considering potential variation in baseline
δ15N values among different ecosystems 24, 25. Data from a large group of Canadian lakes, including from some of the same systems as in the current study, indicated that overall, predatory invertebrates had δ15N values approximately 2.12 ‰ higher than non-predatory invertebrates 26. Therefore, in the two current study lakes (Argent and Morency) where no δ15N data were available for a non-predatory group, this value of 2.12 ‰ was subtracted from the lowest individual δ15N
value of all predatory invertebrates within those two systems. This result was then used as an estimate of the non-predatory δ15N value, which was used to obtain δ15Nadj for all other organisms
in those lakes. This approach allowed us to maximize the number of systems that were included in our analysis of REE trophic transfer through lake food webs.
Statistical analyses
Prior to analysis, all data were examined for normality and homogeneity of variance using Kolmogorov-Smirnov and Levene’s tests, respectively (α = 0.05 for both tests). When necessary, data were normalized by log10-transformation to reduce skewness; this included all individual
element and ΣREE concentrations, as well as fish length and weight (Table S9; and see specific details of analyses that follow). Comparisons of log10-ΣREE concentrations among different
groups of organisms across lakes were conducted using Welch’s analysis of variance (ANOVA) and Games-Howell comparisons (α = 0.05). This approach allowed us to avoid assuming equality of variance between groups of organisms with different sample sizes.27
13
Pearson correlation analyses were used to explore relationships between mean lake physico-chemical characteristics (see Table S1) and ΣREE in biota. For these analyses, all variables were normalized by log10-transformation except calcium (square-root transformed) and
pH (not transformed) prior to analyses. The significance of correlations was assessed with and without Holm correction 28. Ordinary least-squares regression analyses and non-linear regression analyses were used to assess the relationship between log10-ΣREE concentrations and δ15Nadj using
all available data.
Data on pH and REE sediments concentrations were not available for all lakes (n = 10 lakes with sediment REE data and n = 13 lakes with pH data; Table S1). For this reason, two sets of principal component analyses (PCAs) were conducted with available lake water and sediment chemistry data. The first set of PCAs included the 10 lakes for which sediment REE concentration and pH data were available (Table S1). For these 10 lakes, separate PCAs were conducted using either lake water chemistry variables from the epilimnion and hypolimnion, in addition to sediment characteristics. The second set of PCAs included all 14 study lakes; again, two separate PCAs were conducted using either epilimnetic or hypolimnetic lake water chemistry variables. Sediment variables (ΣREE concentration and organic matter content) and pH were not included in the second set of PCAs in order to maximize the number of systems included in the analyses. For all PCAs, all lake characteristics were normalized by log10-transformation except calcium (square-root
14
RESULTS AND DISCUSSION Relationships between different REE
Individual rare earth elements and ΣREE were strongly related with each other through all components of the lake food webs, including biotic and abiotic matrices. Relationships between selected light and heavy elements as well as ΣREE are shown in Fig. S2. Regression coefficients were all statistically significant and ranged from 0.94 to 0.99. Although Ce, Eu and Gd have been shown to exhibit anomalous concentration patterns relative to the other REE11, 16, 29, their relationships were consistent with bioaccumulation patterns of the other elements. Relationships among individual elements and ΣREE were more variable within fish muscle data (Fig. S2); this may be a function of the generally low concentrations of all REE in fish muscle compared to other biota and sediments (Table S8). It is already well established that REE behave as a homogeneous group of elements in abiotic matrices, however these strong correlations between REE in biological matrices have not been well studied. As individual REE were all strongly related with each other, we focused on ΣREE in the following sections.
REE concentrations in water and sediments
ΣREE concentrations averaged 0.53 ± 0.39 nM (mean ± standard deviation) in epilimnetic lake water and 1.62 ± 2.35 nM in the hypolimnetic waters (Fig. 1). When comparing paired data for ΣREE in surface vs. bottom waters, bottom waters were on average 2.5 times more concentrated. Sediments averaged 1.15 ± 0.50 mmol SREE/kg (Fig. 1). Even though samples came from two
15
geological provinces (Fig. S1; Table S1), ΣREE concentrations varied by less than two orders of magnitude across lakes, with maximum / minimum value ratios (max:min; Table S1) of 3.7 for sediments, 12.5 for epilimnetic waters and 50.4 for hypolimnetic waters.
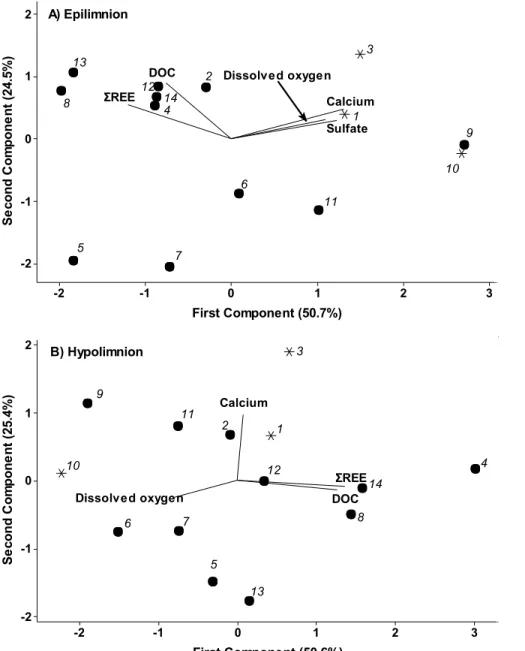
Principal component analysis (Fig. 2, S3) of the physico-chemical characteristics of the lakes revealed that ΣREE levels in surface waters and bottom waters were both positively correlated with DOC and with ΣREE in sediments. Although the number of lakes considered is small, lakes from the Appalachian geological province tended to form a distinct group from those located in the Grenville region (Fig. S3). When ΣREE in sediments was removed from the analysis (Fig. 2), dissolved oxygen concentration emerged as an important variable inversely related to ΣREE in water.
These findings are in general agreement with results from Weltje et al. 11 who reported REE
concentrations in the nM range in surface waters and in the sub-mmol/kg range in sediments of several highly industrialized sites of The Netherlands near Rotterdam. However, they are approximately up to three orders of magnitude lower than those reported in rivers affected by REE mining in China30. Moreover, our results indicate that ΣREE in sediments, and surface and bottom waters were positively correlated with each other, and with DOC. The correlation with DOC may be related to the high binding capacity of organic matter such as humic acids for dissolved metals
31 and could be related to cotransport of REE with DOC from the drainage basin. Higher
concentrations were also found in oxygen-poor waters, which could potentially be explained by REE desorption from Fe oxides31 and phosphates32 under reductive conditions in anoxic or hypoxic
16
waters. Weltje et al. 11 similarly reported higher REE levels in pore waters compared to surface
waters.
Concentrations of REE in aquatic organisms
When considering trophic transfer, REE concentrations in fish may be of interest for assessing transfer to humans (in which case fish muscle should be considered), or transfer to other predators (in which case whole fish may be more relevant). ΣREE were 32, 40 and 275 times higher in whole body than in muscles for brown bullhead, creek chub and white sucker, respectively (Fig. 1). ΣREE concentrations in benthic invertebrates were approximately 1000 times higher than those in fish muscle (median of 20 nmol/g versus 0.02 nmol/g, respectively). Non-predatory benthic invertebrates (mean ± SD; 60 ± 69 nmol/g) had significantly higher ΣREE than predatory benthic invertebrates (16 ± 14 nmol/g) and zooplankton (13 ± 12 nmol/g) (Welch’s ANOVA, F = 9.00, p = 0.001; Fig. 1).
To our knowledge, this is one of the first datasets on REE accumulation in natural aquatic food webs. Comparison of this data with published data is therefore difficult, particularly for zooplankton and benthic invertebrates. For fish, mean ΣREE concentrations in whole bodies ranged from 0.11 ± 0.13 (brown bullhead; size range: 125-157 mm) to 0.45 ± 0.44 mg/kg (white sucker; size range: 123-162 mm; Table S9) (using units of mg/kg dry weight for comparison with published data),. These concentrations lie within the range described for larger size classes (when available) of nine freshwater fish species collected from a North American reservoir (State of Washington, USA) unaffected by mining. In this study, the mean size range for whole fish was
17
from 330 mm for Kokanee to 527 mm for largescale sucker, and the REE concentration range was from 0.021 mg/kg for walleye to 0.47 mg/kg for longnose sucker10. When comparing with smaller size classes reported by Mayfield and Fairbrother10 (<300 mm) (where sample sizes are low and REE values are more variable) our results still lie within the corresponding range of values (0.05 to 1.98 mg/kg). This latter study also reported much lower concentrations in fish fillets compare to whole bodies. In contrast, a recent report on common freshwater species collected in markets from seventeen cities in Shandong (China) found ΣREE levels of around 0.175 mg/kg in muscles when converted to dry weight for comparison (assuming 80% moisture for the conversion)33. These results from China are approximately 30 times higher for fish muscle tissues than in this study (our range: 0.003 for white sucker to 0.010 mg/kg for creek chub), and suggest that geographical variations in REE levels that should be further investigated.
We determined the variation in REE levels in biota across all lakes through correlation analyses and bivariate regressions (Table S10; Fig. 3). Mean ΣREE levels in zooplankton were higher in lakes with higher ΣREE in both epilimnetic and hypolimnetic lake water and sediments. No significant correlation was found for any other biotic groups, when Holm correction was applied (Table S10). With respect to zooplankton, this taxonomic group has been shown to react rapidly to changes in aqueous metal concentrations34, and it may therefore be a good short-term integrator of REE in the aquatic environment. It is however surprising that ΣREE levels in benthic organisms were not correlated with levels in sediments. This lack of relationship may be partly due to the pooling of organisms in broad categories; this pooling was needed to maximize the amount of biomass available for analysis. A more in-depth analysis at higher taxonomic resolution would be
18
warranted to better understand the relationship between sediment contamination and bioaccumulation by benthic organisms.
Bioaccumulation factors of REE
We calculated the bioaccumulation factor (BAF), defined as the ratio of a chemical concentration in an organism to the concentration in water using field data; in this context, chemical concentration in the aquatic organism results from all possible routes of exposure (e.g., diet and respiratory surfaces)35. Concentrations in animals were converted to their wet weight equivalent (assuming 80% moisture), for literature comparison. Median log-BAF values spanned more than three orders of magnitude, ranging from 1.3, 3.7, 4.0 and 4.4 L/kg for fish muscle, zooplankton, predatory invertebrates and non-predatory invertebrates, respectively (Table S11).
For fish muscle (log BAF: 1.3 L/kg on a wet weight basis), these results are slightly lower than BAFs calculated by Mayfield and Fairbrother10 for La, Ce and Y with reported log of geometric means of 1.7, 2.4 and 1.9 L/kg, respectively. This indicates that, in general, fish muscle, the main tissue consumed by humans, have a low bioaccumulation potential for REE. In contrast, organisms lower in the food webs have higher BAFs, with maximum values found for non-predatory invertebrates.
When expressed as a function of ΣREE in water, BAFs displayed a significant inverse relationship with every taxonomic group except zooplankton (Fig. S3). This inverse relationship between BAF and aqueous ΣREE levels is consistent with trends reported for other metals by DeForest et al.35 who attributed this phenomenon to multiple factors including, for instance, active regulation and
19
saturable uptake kinetics at high concentrations. However, additional controlled studies are needed to determine whether this inverse relationship for REE is driven by real biochemical processes, or whether it is more a function of the mathematical coupling of BAF to aqueous contaminant concentrations 36.
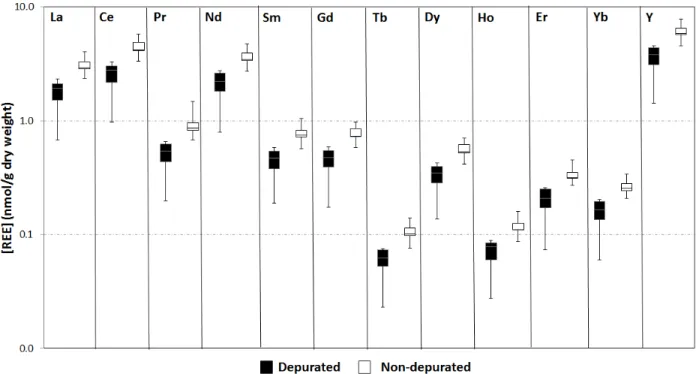
Note that in this study, we did not depurate benthic invertebrates to remove gut contents, since our main goal was to understand trophic transfer, and predators consume non-depurated prey. However, we performed a depuration experiment in parallel to this study on chironomids from Lake Triton, located in the Grenville geological province. Results indicated that depuration is needed for all REE considered (La, Ce, Pr, Nd, Sm, Gd, Tb, Dy, Ho, Er, Yb, Y), with an average ratio of REE in undepurated vs depurated animals of 1.75 ± 0.05 (Fig. 4). The BAFs reported here for benthic invertebrates should therefore be considered upper limits, and could be corrected using the ratio of undepurated to depurated levels. Note however that BAFs are often calculated using undepurated organisms, as is the case in the meta-analysis of metal BAFs by DeForest et al.35 In our depuration experiments, light REE (e.g. La, Ce, Nd, and also Y) tended to have higher concentrations than heavier REE. This general trend was also seen in all matrices from all lakes, namely water, sediments and biota (see detection frequencies, Table S7) and is consistent with results from other studies 17.
Trophic transfer of REE
ΣREE concentrations tended to decrease with increasing trophic level. This can be seen by the logarithmic decrease in ΣREE from non-predatory to predatory benthic invertebrates and
20
zooplankton, and subsequently to fish muscle and whole fish (Fig. 2). A more quantitative analysis is given using stable isotopic signature (δ15Nadj) to better trace trophic position (Fig. 5).
Approximately 73% of the variance in ΣREE levels in aquatic organisms was explained by δ15Nad,
with generally the same sequence of organisms found along the regression line (non-predatory benthos > predatory benthos > zooplankton > fish muscle) as was found using the functional feeding group approach. The trends reported here are for all 14 lakes combined because data sets from some lakes were incomplete for some trophic levels. However similar trends were apparent for individual lakes (see Fig. S4).
These trends are consistent with the concept of trophic dilution37 , according to which there is a decrease in contaminant concentration as trophic level increases. This decrease arises from the balance of ingestion and elimination processes, favouring a net loss of contaminant from prey to predator. We quantified the trophic magnification slope (TMS) 13 commonly calculated for other contaminants (slope = -0.59, Fig. 5). This approach showed the marked contrast between REE bioaccumulation and trophic transfer patterns in lake food webs compared to contaminants such as mercury (Lavoie et al. 14and references therein) and organic pollutants38, but is consistent with the relatively low trophic transfer factors found for most metals35, 39. For instance, in the
meta-analysis of 205 aquatic food webs worldwide reported by Lavoie et al. 14, TMS values for methylmercury ranged from +0.08 to +0.53. In contrast, in the study of Cui et al.40 on metal(loid) transfer in the Yellow River Delta in China, negative slopes were reported for As, Cr, Cu, Mn, Ni, and Pb, although these slopes were not significant.
21
Overall, these findings are encouraging from a human toxicological perspective, since fish muscle is the main fish tissue consumed by human populations and is found to be consistently low in REE in the study area. However, from an ecotoxicological perspective, our results indicate that whole fish is more concentrated than fish muscle. Fish predators (e.g., piscivorous birds and mammals) are therefore likely to be exposed to greater REE concentrations from whole fish as compared to only fish muscle.
This study provides a baseline for REE levels currently encountered in natural aquatic ecosystems at temperate latitudes in Canada, in the absence of mining activities related to REE extraction. REE behave as a relatively homogeneous group of elements and it appears that they tend to undergo trophic dilution along food webs. Future work should consider other types of North American ecosystems (marine and terrestrial) at different latitudes where mining projects are likely (e.g., northern latitudes in Canada). More in-depth analysis of specific elements and specific taxa is likely to uncover stronger environmental relationships. Finally, organ-specific and subcellular bioaccumulation41 could provide insight into REE handling strategies by aquatic organisms.
22 Ep ilim nio n Hy p olim nio n Bro wn bu llhe a d Cre e k c hu b Pu mp k in s ee d su nfi s h Sm a llm ou th b a ss Wh ite s uc k e r Ye l low pe r c h Bro wn bu llhe a d Cre e k c hu b Wh ite s uc k e r Zo op lan k to n Pre da t ory inv e rte b rate s No n-p red a to ry in v ert e bra tes Se d im e nt W a te r F is h m u s c le B e n th o s Z o o p la n k to n S e d im e n t 0 .0 0 0 1 0 .0 1 1 1 0 0 0 0 S R E E c o n c e n tr a ti o n 1 0 0 F is h w h o le b o d y 1 4 1 4 1 7 1 7 4 5 3 0 1 0 1 1 1 0 1 0 1 0 3 9 2 6 1 0 1 2
Figure 1. Concentrations of rare earth elements [ΣREE] in different components of lake ecosystems. Data are from 14 lakes in southern Québec, Canada. [ΣREE] in water are given in nmol/mL, whereas those for biota and sediments are given in nmol/g of dry weight. Sample sizes
23
are shown next to each box. Lower and upper margins of boxes show 25th and 75th percentiles,
respectively; whiskers delimit minimum and maximum values.
Figure 2: Correlation bi-plots showing the results of Principal Component Analysis (PCA) of chemical characteristics of 14 lakes in southern Québec, Canada. Separate PCAs were conducted using A) epilimnetic and B) hypolimnetic lake chemistry variables. The percentage of total
3 2 1 0 -1 -2 2 1 0 -1 -2 First Component (50.7%) S e co n d C o m p o n e n t (2 4. 5% ) Sulfate
DOC Dissolved oxygen
Calcium ΣREE A) Epilimnion 3 1 10 9 11 5 7 4 8 13 2 14 12 6 3 2 1 0 -1 -2 2 1 0 -1 -2 First Component (50.6%) S e co n d C o m p o n e n t (2 5. 4% ) DOC Dissolved oxygen Calcium ΣREE B) Hypolimnion 1 2 3 4 5 6 7 8 9 10 11 12 13 14
24
variance explained by each component is shown in parentheses. Solid and open circles represent lakes located in the Grenville and Appalachian geological provinces, respectively. Data points are numbered according to the corresponding lake: 1) Argent, 2) Chicot, 3) Choinière, 4) Croche (Mauricie), 5) Croche (St.-Hippolyte), 6) Goulet, 7) Héroux, 8) Méduse, 9) Morency, 10) Orford, 11) Perchaude, 12) Pin Rouge, 13) Second Roberge, 14) Trottier. Note that hypolimnetic sulfate data were unavailable for Second Roberge, so this variable was not included in the PCA shown in panel B). See Methods for further details of data handling and analysis.
Figure 3. Relationships between mean [ΣREE] in bulk zooplankton, lake water (left panel) and surface sediments (right panel) in up to 12 lakes in southern Québec, Canada. The linear regression relationship for hypolimnetic water was stronger (R2 = 0.679, p = 0.001, n = 12) than for epilimnetic water (R2 = 0.509, p = 0.009, n = 12) and sediment (R2 = 0.570, p = 0.019, n = 10)
25
across lakes. The triangles (bottom of the left panel) represent lake Pin Rouge (closed symbol for epilimnion, open symbol for hypolimnion), which had studentized residuals of -2.54 and -2.44 for epilimnetic and hypolimnetic water, respectively; when this lake was excluded from regression analyses, both relationships were stronger (epilimnion R2 = 0.646, p = 0.003, n = 11; and hypolimnion R2 = 0.761, p < 0.001, n = 11).
Figure 4. Concentrations of different REEs (on a log scale) in chironomids that were either depurated or not depurated. Samples were taken from Lake Triton, southern Quebec.
26
Figure 5. Decline in total rare earth element concentrations in predatory and non-predatory benthic invertebrates (whole bodies), bulk zooplankton and fish muscle with trophic position (δ15Nadj) from
11 lake food webs in southern Québec, Canada. Data from lakes Choinière, Croche (St.-Hippolyte), and Héroux were not included because it was not possible to adjust δ15N for these food webs (see Methods section for details). The linear regression for log10-[ΣREE] versus δ15Nadj is
27
contaminants (log10-[ΣREE] = 1.817 - 0.585* δ15Nadj, R2 = 0.728, p < 0.001, n = 87; Lavoie et al.
201314). Quadratic and cubic regression relationships had similar strength (R2 = 0.730, p < 0.001; and R2 = 0.774, p < 0.001, respectively).
28 ASSOCIATED CONTENT
Supporting Information. This material is available free of charge via the Internet at http://pubs.acs.org.
AUTHOR INFORMATION Corresponding Author
* Marc Amyot. Phone: 514-343-7496. E-mail: m.amyot@umontreal.ca. Author Contributions
The manuscript was prepared using contributions from all authors. All authors have given approval to the final version of the manuscript. TP and MA designed the study. TP and AAG collected data. Data was analyzed by MGC, TP, GAM and MA. Table and figures were prepared by MGC and AAG. MGC, MA and GAM prepared the manuscript.
Funding Sources
This research was funded through the Natural Sciences and Engineering Research Council (NSERC) Discovery grant, an ISI (Initiatives stratégiques pour l’Innovation) FQRNT grant and an NSERC strategic grant (TRIVALENCE) to MA. MA acknowledges support of the Canada Research Chair Program (CRC in Global Change Ecotoxicology). Different scholarships supported TP (FRQNT), GAM (NSERC; W. Garfield Weston Award; Richard J. Schmeelk Fellowship) and AAG (NSERC).
Notes
29 ACKNOWLEDGMENT
The authors would like to thank Dominic Bélanger for support in the lab and three anonymous reviewers for thoughtful comments. Louise Cloutier, Émilie Gingras, Anne-Élisabeth Laplane, Valérie DeMunk, Viengxay Matthayasack, Fei Tao Zhou and Andréanne Dupont helped in the field and the lab. Dr. Richard Carignan provided help with ArcGIS and acquisition of lake morphometry data. Dr. Maikel Rosabal provided guidance and field support for the experiment on depuration.
30 TOC/ABSTRACT ART
31 REFERENCES 1. Alonso, E.; Sherman, A. M.; Wallington, T. J.; Everson, M. P.; Field, F. R.; Roth, R.; Kirchain, R. E., Evaluating Rare Earth Element Availability: A Case with Revolutionary Demand from Clean Technologies (vol 46, pg 3406, 2012). Environ Sci Technol 2012, 46, (8), 4684-4684. 2. Weng, Z. H.; Jowitt, S. M.; Mudd, G. M.; Haque, N., A Detailed Assessment of Global Rare Earth Element Resources: Opportunities and Challenges. Econ Geol 2015, 110, (8), 1925-1952. 3. Kulaksiz, S.; Bau, M., Rare earth elements in the Rhine River, Germany: First case of anthropogenic lanthanum as a dissolved microcontaminant in the hydrosphere. Environ Int 2011, 37, (5), 973-979. 4. Gonzalez, V.; Vignati, D. A. L.; Pons, M. N.; Montarges-Pelletier, E.; Bojic, C.; Giamberini, L., Lanthanide ecotoxicity: First attempt to measure environmental risk for aquatic organisms. Environ Pollut 2015, 199, 139-147. 5. Krachler, M.; Mohl, C.; Emons, H.; Shotyk, W., Two thousand years of atmospheric rare earth element (REE) deposition as revealed by an ombrotrophic peat bog profile, Jura Mountains, Switzerland. J Environ Monitor 2003, 5, (1), 111-121. 6. Kulaksiz, S.; Bau, M., Anthropogenic dissolved and colloid/nanoparticle-bound samarium, lanthanum and gadolinium in the Rhine River and the impending destruction of the natural rare earth element distribution in rivers. Earth Planet Sc Lett 2013, 362, 43-50. 7. Hatje, V.; Bruland, K. W.; Flegal, A. R., Increases in Anthropogenic Gadolinium Anomalies and Rare Earth Element Concentrations in San Francisco Bay over a 20 Year Record. Environ Sci Technol 2016, 50, (8), 4159-4168. 8. Borgmann, U.; Couillard, Y.; Doyle, P.; Dixon, D. G., Toxicity of sixty-three metals and metalloids to Hyalella azteca at two levels of water hardness. Environ Toxicol Chem 2005, 24, (3), 641-652. 9. Tai, P. D.; Zhao, Q.; Su, D.; Li, P. J.; Stagnitti, F., Biological toxicity of lanthanide elements on algae. Chemosphere 2010, 80, (9), 1031-1035. 10. Mayfield, D. B.; Fairbrother, A., Examination of rare earth element concentration patterns in freshwater fish tissues. Chemosphere 2015, 120, 68-74. 11. Weltje, L.; Heidenreich, H.; Zhu, W. Z.; Wolterbeek, H. T.; Korhammer, S.; de Goeij, J. J. M.; Markert, B., Lanthanide concentrations in freshwater plants and molluscs, related to those in surface water, pore water and sediment. A case study in The Netherlands. Sci Total Environ 2002, 286, (1-3), 191-214. 12. Jardine, T. D.; Kidd, K. A.; Fisk, A. T., Applications, considerations, and sources of uncertainty when using stable isotope analysis in ecotoxicology. Environ Sci Technol 2006, 40, (24), 7501-7511. 13. Borga, K.; Kidd, K. A.; Muir, D. C. G.; Berglund, O.; Conder, J. M.; Gobas, F. A. P. C.; Kucklick, J.; Malm, O.; Powell, D. E., Trophic magnification factors: Considerations of ecology, ecosystems, and study design. Integr Environ Asses 2012, 8, (1), 64-84.
32 14. Lavoie, R. A.; Jardine, T. D.; Chumchal, M. M.; Kidd, K. A.; Campbell, L. M., Biomagnification of Mercury in Aquatic Food Webs: A Worldwide Meta-Analysis. Environ Sci Technol 2013, 47, (23), 13385-13394. 15. Walters, D. M.; Jardine, T. D.; Cade, B. S.; Kidd, K. A.; Muir, D. C. G.; Leipzig-Scott, P., Trophic Magnification of Organic Chemicals: A Global Synthesis. Environ Sci Technol 2016, 50, (9), 4650-4658. 16. Leybourne, M. I.; Johannesson, K. H., Rare earth elements (REE) and yttrium in stream waters, stream sediments, and Fe-Mn oxyhydroxides: Fractionation, speciation, and controls over REE plus Y patterns in the surface environment. Geochim Cosmochim Ac 2008, 72, (24), 5962-5983. 17. Migaszewski, Z. M.; Galuszka, A., The Characteristics, Occurrence, and Geochemical Behavior of Rare Earth Elements in the Environment: A Review. Crit Rev Env Sci Tec 2015, 45, (5), 429-471. 18. St. Louis, V. L.; Rudd, J. W. M.; Kelly, C. A.; Beaty, K. G.; Bloom, N. S.; Flett, R. J., Importance of Wetlands as Sources of Methyl Mercury to Boreal Forest Ecosystems. Can J Fish Aquat Sci 1994, 51, (5), 1065-1076. 19. Moisan, J., Guide d’identification des principaux macroinvertébrés benthiques d’eau douce du Québec, 2010 — Surveillance volontaire des cours d’eau peu profonds. 2010; p 82. 20. MacMillan, G. A.; Girard, C.; Chetelat, J.; Laurion, I.; Amyot, M., High Methylmercury in Arctic and Subarctic Ponds is Related to Nutrient Levels in the Warming Eastern Canadian Arctic. Environ Sci Technol 2015, 49, (13), 7743-7753. 21. Reed, N. M.; Cairns, R. O.; Hutton, R. C.; Takaku, Y., Characterization of Polyatomic Ion Interferences in Inductively-Coupled Plasma-Mass Spectrometry Using a High-Resolution Mass-Spectrometer. J Anal Atom Spectrom 1994, 9, (8), 881-896. 22. Merritt, R. W.; Cummins, K. W.; Berg, M. B., An introduction to the aquatic insects of North America. In 4th ed.; Kendall/Hunt Pub. Co.,: Dubuque, Iowa, 2008. 23. Barbour M.T., G. J., Snyder B.D., Stribling J.B. , Rapid bioassessment protocols for use in streams and wadeable rivers: Periphyton, benthic macroinvertebrates and fish. In Washington, DC, 1999. 24. Anderson, C.; Cabana, G., delta N-15 in riverine food webs: effects of N inputs from agricultural watersheds. Can J Fish Aquat Sci 2005, 62, (2), 333-340. 25. Cabana, G.; Rasmussen, J. B., Comparison of aquatic food chains using nitrogen isotopes. P Natl Acad Sci USA 1996, 93, (20), 10844-10847. 26. Clayden, M. G.; Kidd, K. A.; Wyn, B.; Kirk, J. L.; Muir, D. C. G.; O'Driscoll, N. J., Response to Comment on "Mercury Biomagnification through Food Webs Is Affected by Physical and Chemical Characteristics of Lakes". Environ Sci Technol 2014, 48, (17), 10526-10527. 27. MacDonald, J. H., Handbook of Biological Statistics. Third edition ed.; Sparky House Publishing: 2014.
33 28. Holm, S., A Simple Sequentially Rejective Multiple Test Procedure. Scand J Stat 1979, 6, (2), 65-70. 29. Sholkovitz, E. R.; Schneider, D. L., Cerium Redox Cycles and Rare-Earth Elements in the Sargasso Sea. Geochim Cosmochim Ac 1991, 55, (10), 2737-2743. 30. Liang, T.; Li, K. X.; Wang, L. Q., State of rare earth elements in different environmental components in mining areas of China. Environ Monit Assess 2014, 186, (3), 1499-1513. 31. Marsac, R.; Davranche, M.; Gruau, G.; Dia, A.; Pedrot, M.; Le Coz-Bouhnik, M.; Briant, N., Effects of Fe competition on REE binding to humic acid: Origin of REE pattern variability in organic waters. Chem Geol 2013, 342, 119-127. 32. Liu, X. W.; Byrne, R. H., Rare earth and yttrium phosphate solubilities in aqueous solution. Abstr Pap Am Chem S 1997, 213, 220-Geoc. 33. Yang, L. P.; Wang, X. N.; Nie, H. Q.; Shao, L. J.; Wang, G. L.; Liu, Y. J., Residual levels of rare earth elements in freshwater and marine fish and their health risk assessment from Shandong, China. Mar Pollut Bull 2016, 107, (1), 393-397. 34. Harris, R. C.; Rudd, J. W. M.; Amyot, M.; Babiarz, C. L.; Beaty, K. G.; Blanchfield, P. J.; Bodaly, R. A.; Branfireun, B. A.; Gilmour, C. C.; Graydon, J. A.; Heyes, A.; Hintelmann, H.; Hurley, J. P.; Kelly, C. A.; Krabbenhoft, D. P.; Lindberg, S. E.; Mason, R. P.; Paterson, M. J.; Podemski, C. L.; Robinson, A.; Sandilands, K. A.; Southworth, G. R.; Louis, V. L. S.; Tate, M. T., Whole-ecosystem study shows rapid fish-mercury response to changes in mercury deposition. P Natl Acad Sci USA 2007, 104, (42), 16586-16591. 35. DeForest, D. K.; Brix, K. V.; Adams, W. J., Assessing metal bioaccumulation in aquatic environments: The inverse relationship between bioaccumulation factors, trophic transfer factors and exposure concentration. Aquat Toxicol 2007, 84, (2), 236-246. 36. Pollman, C. D.; Axelrad, D. M., Mercury bioaccumulation factors and spurious correlations. Sci Total Environ 2014, 496, Vi-Xii. 37. Nordberg, M.; Templeton, D. M.; Andersen, O.; Duffus, J. H., Glossary of terms used in ecotoxicology (IUPAC Recommendations 2009). Pure Appl Chem 2009, 81, (5), 829-970. 38. Houde, M.; Muir, D. C. G.; Kidd, K. A.; Guildford, S.; Drouillard, K.; Evans, M. S.; Wang, X. W.; Whittle, D. M.; Haffner, D.; Kling, H., Influence of lake characteristics on the biomagnification of persistent organic pollutants in lake trout food webs. Environ Toxicol Chem 2008, 27, (10), 2169-2178. 39. Mathews, T.; Fisher, N. S.; Jeffree, R. A.; Teyssie, J. L., Assimilation and retention of metals in teleost and elasmobranch fishes following dietary exposure. Mar Ecol Prog Ser 2008, 360, 1-12. 40. Cui, B. S.; Zhang, Q. J.; Zhang, K. J.; Liu, X. H.; Zhang, H. G., Analyzing trophic transfer of heavy metals for food webs in the newly-formed wetlands of the Yellow River Delta, China. Environ Pollut 2011, 159, (5), 1297-1306.
34 41. Rosabal, M.; Hare, L.; Campbell, P. G. C., Assessment of a subcellular metal partitioning protocol for aquatic invertebrates: preservation, homogenization, and subcellular fractionation. Limnol Oceanogr-Meth 2014, 12, 507-518.
S35
SUPPORTING INFORMATION
Fate and trophic transfer of rare earth elements
in temperate lake food webs
Amyot M†,*, Clayden MG†, MacMillan GA†, Perron T†, Arscott-Gauvin A†
†Groupe de recherche interuniversitaire en limnologie et environnement aquatique (GRIL),
Département de sciences biologiques, Université de Montréal, 90 Vincent-d’Indy, Montréal, Quebec Canada
S36
Figure S1: Map of the study area in southern Québec, Canada (yellow square in left panel) and enlarged view (right panel) showing the locations of the 14 lakes sampled and their geological province (Ministère de l’énergie et des ressources naturelles du Québec; https://www.mern.gouv.qc.ca/english/mines/geology/geology-overview.jsp), July-September of 2011 or 2012 (right panel). 1. Croche (Mauricie); 2. Chicot; 3. Second Roberge; 4. Méduse; 5. Trottier; 6. Perchaude; 7. Goulet; 8. Héroux; 9. Croche (St.-Hippolyte); 10. Pin Rouge; 11. Morency; 12. Choinière; 13. Argent; 14. Orford.
S37
Figure S2: Relationships between concentrations of selected and total rare earth elements (ΣREE) through different sample matrices from 14 lake ecosystems in southern Québec, Canada. All concentrations are log10-transformed (nmol/g in sediments and biota; nmol/mL in water). Regression coefficients (R2) are shown for each relationship; all were highly significant (p < 0.001). Fishes refer to fish muscles, and not whole bodies. Scandium was excluded from the analysis. A related correlation matrix can be found in Table 7.
S38
Figure S3. Correlaton bi-plots showing the results of Principal Component Analysis (PCA) of chemical characteristics of 10 lakes in southern Québec, Canada for which sediment ΣREE concentration data were available. Separate PCAs were conducted using A) epilimnetic and B) hypolimnetic lake chemistry variables. The percentage of total variance explained by each component is shown in parentheses. Solid circles and asterisks represent lakes located in the Grenville and Appalachian geological regions, respectively. Data points are numbered according to the corresponding lake as in Figure 2 of the main text: 1) Argent, 3) Choinière, 4) Croche (Mauricie), 5) Croche (St.-Hippolyte), 7) Héroux, 8) Méduse, 9) Morency, 10) Orford, 11) Perchaude, 12) Pin Rouge. See Methods for further details of data handling and analysis.
3 2 1 0 -1 -2 -3 2 1 0 -1 -2 First Component (42.2%) S e co n d C o m p o n e n t (2 7. 8% )
Sediment organic matter Sediment ΣREE Sulfate DOC Dissolved oxygen Calcium Water ΣREE A) Epilimnion 1 3 10 4 5 7 8 12 11 9 4 3 2 1 0 -1 -2 3 2 1 0 -1 -2 First Component (47.5%) S e co n d C o m p o n e n t (3 0. 8% )
Sediment organic matter
Sediment ΣREEDOC Dissolved oxygen Calcium Water ΣREE 1 3 10 4 5 7 8 9 11 12 B) Hypolimnion
S39
Figure S3: Bioaccumulation factors (BAFs) for total rare earth element concentrations (ΣREE) in predatory and non-predatory benthic invertebrates and zooplankton (top panel) and fish muscle (bottom panel) in relation to ΣREE in lake surface water. BAFs were calculated as the ratio of mean ΣREE in each biotic group (nmol/g) per lake to ΣREE in lake surface water (nmol/L; Deforest et al. 2007). Linear regressions were significant for non-predatory (R2 = 0.313, p = 0.038) and predatory invertebrates (0.698, p = 0.001), but not significant for zooplankton (R2 = 0.252, p = 0.127). Regression was also significant for fish muscle (all species combined, R2 = 0.289, p = 0.032).
S40
Figure S4: Linear regression relationships between ΣREE concentrations (nmol/g of dry weight) versus trophic position inferred from δ15Nadj (see Methods section of the main text for details of δ15N adjustment) in four selected lake food webs in southern Québec, Canada. All regression
relationships were significant (p < 0.001) and regression coefficients were as follows: A) R2 = 0.706, n = 21; B) R2 = 0.699, n = 15; C) R2 = 0.891, n = 16; D) R2 = 0.679, n = 17. 1000 10 0.1 0.001 8 6 4 2 0 1000 10 0.1 0.001 8 6 4 2 0
δ N (‰ )
[Σ
R
E
E
]
(n
m
o
l/g
)
Non-predatory Predatory Pumpkinseed sunfish Smallmouth bass Yellow perch Zooplankton 15 adj A) Argent B) MorencyS41
Table S1: Physico-chemical characteristics of fourteen study lakes in southern Québec, Canada.*
Lake ΣREE (nmol/L) Ca2+ (µmol/L) Conductivity (µS/cm) DO (mg/L) DOC (mg/L) pH SO42- (µmol/L)
Epi Hypo Epi Hypo Epi Hypo Epi Hypo Epi Hypo Epi Hypo Epi Hypo
Argent 0.160 0.908 248.6 223.7 84 83 10.23 0.91 5.44 5.20 7.54 6.92 34.05 31.50 Chicot 0.848 0.862 166.0 192.0 71 99 9.51 0.48 5.54 3.17 8.01 7.11 39.00 53.74 Choinière 0.470 1.427 378.7 378.7 110 115 9.24 0.96 5.25 4.94 7.96 7.03 59.93 37.96 Croche (Mauricie) 1.228 9.320 114.0 194.0 43 125 9.23 0.48 5.06 9.25 6.76 6.32 40.20 20.21 Croche (St.-Hippolyte) 0.224 0.604 47.4 56.3 14 22 7.93 1.49 4.21 4.59 7.11 6.29 27.30 23.50 Goulet 0.393 0.646 86.0 98.0 32 42 9.61 2.76 3.37 2.31 6.99 6.78 39.60 42.12 Héroux 0.345 0.346 76.0 66.9 40 110 9.00 0.35 2.58 2.89 6.70 6.23 26.30 - Méduse 1.122 2.676 91.0 132.0 49 95 9.08 0.97 7.49 6.81 6.92 6.18 27.40 22.87 Morency 0.098 0.211 263.9 272.3 103 104 9.46 2.74 3.91 2.74 8.11 7.54 79.70 85.38 Orford 0.116 0.185 214.6 203.8 129 124 10.94 10.30 3.48 3.44 8.22 8.14 50.47 48.33 Perchaude 0.229 0.547 149.0 223.0 57 98 9.40 1.11 2.84 3.09 7.49 7.10 45.30 23.66 Pins Rouges 0.463 0.766 126.0 169.2 38 57 9.28 1.31 7.99 5.95 7.24 6.28 33.71 51.02 Second Roberge 1.032 1.594 84.0 70.8 28 33 9.26 6.47 8.50 6.21 - - 29.80 32.30 Trottier 0.736 2.637 84.0 160.0 29 51 8.89 0.75 6.63 6.95 7.14 6.93 52.20 56.94 Max:Min 12.53 50.38 7.99 6.73 9.21 5.68 1.38 29.43 3.29 4.00 1.23 1.32 3.03 4.22
*Water chemistry variables in each lake were measured at the surface (epilimnion; epi) and below the thermocline (hypolimnion; hypo); n = 1 for all chemical variables. Dashes are shown to indicate instances where data were unavailable for a given parameter. Water sampling was conducted in July and August of 2011 (lakes Chicot, Croche-Mauricie, Croche – St.-Hippolyte, Goulet, Héroux, Méduse, Perchaude, Pin Rouge, Second Roberge, Trottier) and 2012 (lakes Argent, Choinière, Morency, Orford). See Methods section of the main text for details. Lake depth data were provided by Dr. Richard Carignan (unpublished data) and other morphometric characteristics were determined using ArcGIS.
S42 Table S1 (continued) Lake Sediment ΣREE (nmol/g) Sediment % organic matter Surface area (km2) Maximum depth (m) Thermocline depth (m) Watershed area (km2) Geological region Argent 1018 20 1.1 16 5.0 56.5 Appalachian Chicot - - 0.9 21 3.5 15.7 Grenville Choinière 959 18 4.7 10 5.5 127.8 Appalachian
Croche (Mauricie) 2076 15 1.0 11 4.5 12.4 Grenville
Croche (St.-Hippolyte) 560 47 0.2 11 4.3 0.8 Grenville
Goulet - - 0.4 22.5 3.5 6.2 Grenville Héroux 1215 54 0.3 23 3.5 2.3 Grenville Méduse 1732 25 0.3 7.6 3.5 5.7 Grenville Morency 746 32 0.3 20 5.0 2.2 Grenville Orford 792 13 1.4 15 6.0 7.5 Appalachian Perchaude 1637 18 0.2 12 4.5 0.8 Grenville
Pin Rouge 763 41 0.2 14 2.5 7.4 Grenville
Second Roberge - - 0.6 20 5.0 8.7 Grenville
S43
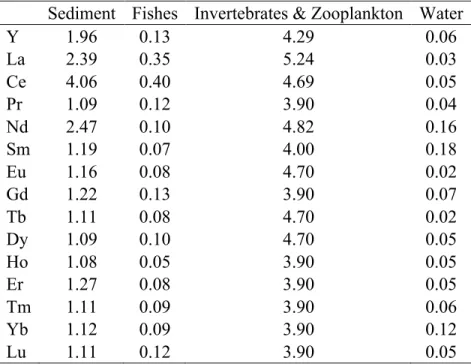
Table S2. Mean limits of detection (ng/L) of rare earth element concentration analyses in biotic tissues, water and sediment. Samples were analyzed in four separate batches: fishes, benthic invertebrates and zooplankton, water, and sediments.
Sediment Fishes Invertebrates & Zooplankton Water
Y 1.96 0.13 4.29 0.06 La 2.39 0.35 5.24 0.03 Ce 4.06 0.40 4.69 0.05 Pr 1.09 0.12 3.90 0.04 Nd 2.47 0.10 4.82 0.16 Sm 1.19 0.07 4.00 0.18 Eu 1.16 0.08 4.70 0.02 Gd 1.22 0.13 3.90 0.07 Tb 1.11 0.08 4.70 0.02 Dy 1.09 0.10 4.70 0.05 Ho 1.08 0.05 3.90 0.05 Er 1.27 0.08 3.90 0.05 Tm 1.11 0.09 3.90 0.06 Yb 1.12 0.09 3.90 0.12 Lu 1.11 0.12 3.90 0.05
TABLE S3: Intercalibration for four natural unfiltered water samples for the CEAEQ (Centre d'expertise en analyse environnementale du Québec) and the laboratory at Université de Montréal.
KJ4 KJ2 KJ8 KJ10
Element CEAEQ UdeM CEAEQ UdeM CEAEQ UdeM CEAEQ UdeM Y 0.083 0.083 0.176 0.16 0.042 0.04 0.256 0.24 La 0.339 0.335 0.601 0.555 0.149 0.145 0.687 0.615 Ce 0.452 0.482 0.353 0.332 0.21 0.222 0.444 0.412 Pr 0.063 0.065 0.111 0.11 0.029 0.032 0.135 0.13 Nd 0.208 0.204 0.373 0.344 0.093 0.092 0.459 0.424 Sm 0.026 0.03 0.047 0.042 0.014 0.011 0.063 0.057 Eu 0.019 0.004 0.011 0.008 0.004 0 0.025 0.012 Gd 0.026 0.023 0.044 0.032 0.012 0.011 0.059 0.044 Tb 0.003 0.002 0.005 0.004 0.001 0 0.007 0.006 Dy 0.013 0.012 0.025 0.025 0.006 0.007 0.037 0.035 Ho 0.002 0.002 0.005 0.005 0.001 0 0.008 0.006 Er 0.007 0.007 0.016 0.014 0.004 0.004 0.022 0.023 Tm 0.001 0.001 0.002 0.002 0 0.001 0.003 0.002 Yb 0.007 0.006 0.013 0.012 0.003 0 0.02 0.016 Lu 0.001 0.001 0.002 0.002 0.001 0 0.003 0.003
S44
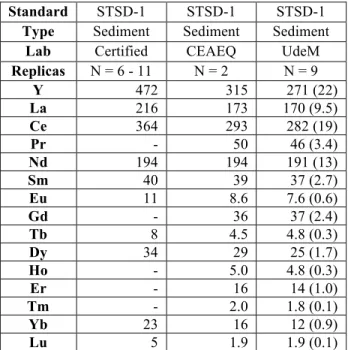
TABLE S4: Comparison of measured REE concentration in certified sediment reference materials (STSD-1, nmolg-1 d.w) for this study (UdeM, Université de Montréal) and an interlaboratory calibration (CEAEQ, Centre d'expertise en analyse environnementale du Québec, CEAEQ). Note: recovered concentrations are lower than certified values due to differences in extraction methods (total multi-acid dissolution versus partial extraction methods to estimate the labile fraction). There are no certified values for Pr, Gd, Ho, Er, Tm.
Standard STSD-1 STSD-1 STSD-1
Type Sediment Sediment Sediment
Lab Certified CEAEQ UdeM
Replicas N = 6 - 11 N = 2 N = 9 Y 472 315 271 (22) La 216 173 170 (9.5) Ce 364 293 282 (19) Pr - 50 46 (3.4) Nd 194 194 191 (13) Sm 40 39 37 (2.7) Eu 11 8.6 7.6 (0.6) Gd - 36 37 (2.4) Tb 8 4.5 4.8 (0.3) Dy 34 29 25 (1.7) Ho - 5.0 4.8 (0.3) Er - 16 14 (1.0) Tm - 2.0 1.8 (0.1) Yb 23 16 12 (0.9) Lu 5 1.9 1.9 (0.1)
TABLE S5: Intercalibration for REE concentrations (ngg-1) measured in TORT-2 reference material (National Research Council Canada) for the laboratory at the CEAEQ (Centre d'expertise en analyse environnementale du Québec) and this study (UdeM, Université de Montréal, n=3).
CEAEQ UdeM
Element Mean SD Mean SD
Y 510 ± 46 La 1700 ± na 1492 ± 137 Ce 1900 ± na 1337 ± 122 Pr 260 ± na 183 ± 16 Nd 940 ± na 731 ± 64 Sm 160 ± na 97 ± 6 Eu 18 ± na 19 ± 2 Gd 140 ± na 132 ± 8 Tb 16 ± na 13,5 ± 1 Dy 76 ± na 62 ± 4 Ho 14 ± na 12,6 ± 1 Er 34 ± na 34 ± 2 Tm 4.0 ± na 3,4 ± 0.4 Yb 17 ± na 16 ± 1.1 Lu 2.0 ± na 2,2 ± 0.3
S45
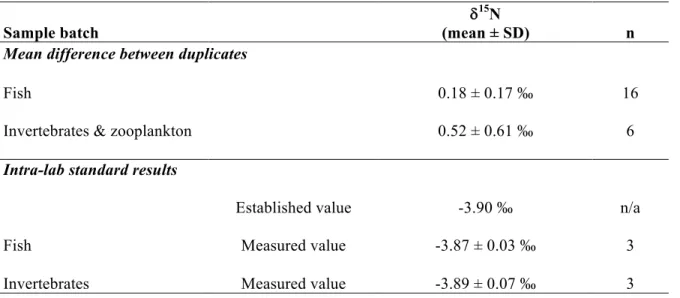
Table S6: Quality assurance results for duplicates and an intra-lab standard analyzed with each batch of samples (fish, invertebrates and zooplankton) for carbon and nitrogen stable isotopes.
Sample batch
d15N
(mean ± SD) n
Mean difference between duplicates
Fish 0.18 ± 0.17 ‰ 16
Invertebrates & zooplankton 0.52 ± 0.61 ‰ 6
Intra-lab standard results
Established value -3.90 ‰ n/a
Fish Measured value -3.87 ± 0.03 ‰ 3
Invertebrates Measured value -3.89 ± 0.07 ‰ 3
Table S7. Frequencies of detection of rare earth elements (REE) in biotic and abiotic samples from 14 lakes in southern Québec.*
Element
Non-predatory invertebrates
Predatory
invertebrates Zooplankton Water Sediment (n = 49) (n = 26) (n = 17) (n = 48) (n = 12) Y 0.96 0.65 1 1 1 La 1 0.96 1 1 1 Ce 1 0.92 1 1 1 Pr 0.86 0.50 0.92 1 1 Nd 0.98 0.77 1 1 1 Sm 0.76 0.35 0.83 1 1 Eu 0.37 0.12 0.08 1 1 Gd 0.84 0.35 0.83 1 1 Tb 0.27 0.12 0.08 1 1 Dy 0.61 0.31 0.50 1 1 Ho 0.29 0.12 0.08 0.98 1 Er 0.51 0.23 0.17 1 1 Tm 0.12 0.00 0.00 0.83 1 Yb 0.49 0.19 0.08 1 1 Lu 0.10 0.00 0.00 0.93 1
* Frequency of detection was calculated as the number of samples for which the concentration of a given REE was above the detection limit as a fraction of the total number of samples of a given type (fish, benthos, zooplankton, water, sediment).
S46
Table S7 (continued)
Fish Element Brown bullhead Creek chub Pumpkinseed
Smallmouth
bass White sucker
Yellow perch Muscle Whole Muscle Whole Muscle Muscle Muscle Whole Muscle (n = 17) (n = 10) (n = 17) (n = 10) (n = 45) (n = 30) (n = 10) (n = 10) (n = 11) Y 0.76 1.00 0.88 1.00 0.73 0.50 0.40 1.00 0.55 La 0.88 1.00 0.94 1.00 0.69 0.60 0.70 1.00 0.64 Ce 0.82 1.00 0.88 1.00 0.78 0.57 0.60 1.00 0.55 Pr 0.65 1.00 0.76 1.00 0.53 0.40 0.40 1.00 0.36 Nd 0.88 1.00 0.94 1.00 0.78 0.60 0.60 1.00 0.82 Sm 0.65 0.70 0.71 0.83 0.51 0.30 0.20 1.00 0.18 Eu 0.71 1.00 1.00 1.00 0.16 0.13 0.20 1.00 0.27 Gd 0.41 1.00 0.76 1.00 0.40 0.17 0.20 1.00 0.36 Tb 0.00 0.50 0.18 0.58 0.11 0.07 0.00 1.00 0.09 Dy 0.47 1.00 0.47 1.00 0.36 0.13 0.10 1.00 0.36 Ho 0.00 0.70 0.18 0.83 0.09 0.07 0.00 1.00 0.09 Er 0.06 1.00 0.24 1.00 0.20 0.03 0.00 1.00 0.09 Tm 0.00 0.30 0.12 0.50 0.09 0.03 0.00 1.00 0.09 Yb 0.06 1.00 0.24 1.00 0.13 0.03 0.00 1.00 0.09 Lu 0.06 0.30 0.12 0.33 0.11 0.07 0.00 1.00 0.09
S47
Table S8. Summary of total rare earth elements concentrations [ΣREE] and stable nitrogen isotope values (δ15N and adjusted δ15N or δ15Nadj*) in biota from 14 lakes in southern Québec, Canada.
[ΣREE] (ng/g) [ΣREE] (nmol/g) δ15N (‰) δ15Nadj (‰)
Taxonomic group and lake Mean SD** Min Max Mean SD Min Max n Mean SD Min Max n Mean SD n
NON-PREDATORY INVERTEBRATES
Amphipoda (Gammaridae):
Gatherer-Collectors
Argent 5566 41.0 1
Morency 2223 16.9 1 11.04 1 4.46 1
Bivalvia (freshwater mussels):
Filter-Collectors Héroux 276 2.1 1 Méduse 1469 10.8 1 Perchaude 644 4.8 1 Chironomidae (excluding Tanypodinae Argent 6909 51.1 51.1 51.1 1 Chicot 13770 101.7 101.7 101.7 1 7.41 1 2.285 1 Choinière 1686 12.42 12.42 12.42 1 Croche (Mauricie) 5276 38.91 38.91 38.91 1 7.935 1 1.055 1 Croche (Saint-Hippolyte) 1365 690 862 2150.9 10.2 5.3 6.6 16.2 3 Méduse 1167 965 1368.8 8.617 2.3 7.0 10.2 2 4.09 1 0.57 1 Morency 3710 28.18 28.18 28.18 1 Perchaude† 6439 1731.3 11147 47.89 49.61 12.81 82.97 2 2.86 1.53 4.18 2 1.33 2 Pin rouge 10730 81.07 81.07 81.07 1 7.74 1 2.65 1 Second Roberge† 14804 110.3 110.3 110.3 1 5.12 1 0 1 Trottier† 8920 65.24 65.24 65.24 1 1.05 1 0 1 Decapoda Pins Rouges 1.53 1 0 1 Ephemeroptera (Caenidae, Heptageniidae, Leptophlebiidae): Gatherer-Collectors Argent 2634 1214 4055 18.6 14.6 8.3 28.9 2 Croche (Saint-Hippolyte) 4216 2693 5738 32.4 17.4 20.1 44.7 2 Pin rouge 3889 29.1 1 5.09 5.09 5.09 1 0 1
![Figure 1. Concentrations of rare earth elements [ΣREE] in different components of lake ecosystems](https://thumb-eu.123doks.com/thumbv2/123doknet/8083327.271118/22.918.127.797.125.722/figure-concentrations-earth-elements-σree-different-components-ecosystems.webp)
![Figure 3. Relationships between mean [ΣREE] in bulk zooplankton, lake water (left panel) and surface sediments (right panel) in up to 12 lakes in southern Québec, Canada](https://thumb-eu.123doks.com/thumbv2/123doknet/8083327.271118/24.918.117.793.390.808/figure-relationships-zooplankton-surface-sediments-southern-québec-canada.webp)