O
pen
A
rchive
T
OULOUSE
A
rchive
O
uverte (
OATAO
)
OATAO is an open access repository that collects the work of Toulouse researchers and
makes it freely available over the web where possible.
This is an author-deposited version published in :
http://oatao.univ-toulouse.fr/
Eprints ID : 15434
The contribution was presented at :
http://www.sapienzaapps.it/chitaly2015/
Official URL:
http://dx.doi.org/10.1145/2808435.2808444
To cite this version :
Celentano, Augusto and Dubois, Emmanuel A Design Space for
Exploring Rich and Complex Information Environments. (2015) In: 11th Biannual
Conference of the Italian SIGCHI Chapter (CHItaly 2015), 28 September 2015 - 30
September 2015 (Rome, Italy).
Any correspondence concerning this service should be sent to the repository
administrator:
[email protected]
A Design Space for Exploring Rich and Complex
Information Environments
Augusto Celentano
DAIS, Università Ca’ Foscari Venezia Venice, Italy
[email protected]
Emmanuel Dubois
Université de Toulouse III & CNRS, IRIT Toulouse, France
[email protected]
ABSTRACT
In this paper we discuss the visualization and interaction paradigms based on overview+detail and focus+context mod-els, proposing a design methodology suitable for rich infor-mation environments, made of multivariate data and multi-device deployment. We propose to identify a set of mean-ingful categories of information visualization and interac-tion corresponding to different user goals and explorainterac-tion spaces, starting from a global universe of discourse and go-ing down into the ultimate data items, through discrete in-termediate steps corresponding to structured context and overview levels. Each category defines an association with a specific knowledge goal, the deployment on a suitable class of devices and the access through adequate interaction tech-niques. Such design methodology is applied to two case stud-ies, one in the domain of energy consumption management, the other in cultural heritage fruition.
Keywords
Analytical approach, Design space, Multidimensional data, Multi-device, Zooming interface
1.
INTRODUCTION
The benefits of analyzing and managing complex informa-tion at different levels of detail, switching between overview and detail exploration, moving the user focus within a con-tinuous reference context and changing the perspectives of information analysis, are well known and validated by a large body of literature (see [8] and [24] for a quite comprehen-sive review). Evidence exists in the literature that interfaces able to show different levels of details and different perspec-tives on data, to manage multiple views and to facilitate the navigation among them improve the user’s ability to
CHItaly 2015 September 28–30, 2015, Rome, Italy
DOI:http://dx.doi.org/10.1145/2808435.2808444
grab the overall meaning of the information, the relations between the information components, their details, and to filter, select and compare the information content according to his/her goals and needs.
Relevant cases in which multilevel data exploration has been used are represented by large data structures used to represent several different domains among which networks and social environments, and the visualization of multidi-mensional data in scientific analysis seems to be predomi-nant [9, 10, 19].
In frequent cases information is related to a map in a geographical or virtual space, that represents the overall in-formation environment, and the visualization and interac-tion environment on which informainterac-tion is overlaid [1, 12]. Maps are used not only for representing a true geographic information, but also metaphorically to make evident the relations between different parts of information and to help users to move into complex knowledge spaces [7, 27]. Indeed, representing space and reasoning about it is a fundamental property of human beings; according to Kuhn [16], “space is fundamental to perception and cognition because it provides a common ground for our senses as well as for our actions”. The growth of applications and services handling and rep-resenting data spatially (from Google Maps onwards) has boosted the interest and familiarity with map based infor-mation and promoted the development of user interfaces for interacting with it.
Data belongs to different types, can be aggregated at dif-ferent levels, visualized in difdif-ferent ways, organized in series and tables or synthetically represented as summary data. Data can be multimedia, and structured in multivariate ag-gregations relating different sets and different attributes; can link or refer other data, possibly resulting in worlds within
worlds as described in [11]. In summary, data can be
in-cluded in a potentially large hypermedia environment rich of information but complex to explore.
To cope with the variety of information type and struc-ture and with the amount of available data, links between the reality of space regions and abstract data, inherent to map based information visualization, are an opportunity to support a more efficient exploration of the information en-vironment: when exploring the reality part of the map, e.g., the buildings and other human artifacts, abstract data such as information belonging to several knowledge domains (de-mography, economy, environment, etc.) can be visualized in the proper context, and when navigating on abstract data collections, the objects and parts of space responsible of their origin, meaning and values can be highlighted/focused [6].
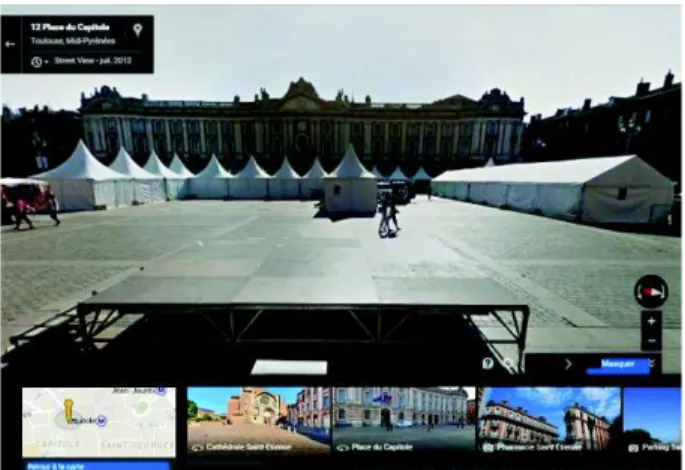
Figure 1: A screen of GoogleMap: streetview (top), global view (bottom left) and photo list (bottom center and right).
A balance between the space extension, the richness of in-formation and the availability of mixed personal and public presentation spaces, has led to the definition of multiple view interfaces and novel interaction techniques, extending the initial two-mode visualization introduced by overview+detail and focus+context interfaces (hereafter respectively referred to as OD and FC) to more complex multilevel and multide-vice architectures.
Informal examples of the presence of different levels of visualization with different goals and information content appear in many applications even if they are not explicitly committed to OD and FC models. For example when acti-vating the street view service in Google Maps, the page is automatically divided into subpages to present a pedestrian point of view from a road on the map, a fragment of the 2D map, and pictures taken from this point of view (Figure 1). These three sets of information can be navigated, zoomed in or out, annotated. The map can be shown in normal or satellite view, with several added information visible or hid-den at user’s will. Data can be viewed at different levels of details and under different perspectives switching between overview, context and details in a way that preserves the coherence of the whole information environment.
In this paper we primarily address map based interfaces, and propose a design space suitable for exploring rich and complex information environment, made of multivariate data and based on multi-device deployment. The proposed design space consists in a structured organization of OD and FC levels driven by the need to better take advantage of the va-riety of information types and structures in rich and complex information environment. It leads to the identification and description of a clear distinction between information lev-els at design time, each corresponding to different informa-tion categories required for different knowledge goal (multi-purpose). Such a structured organization encompasses the information deployment on different devices since there is to-day a multiplicity of mobile, handheld and wearable devices that can display information in different ways, with different interaction techniques and representations. Combining in-formation categories and deployment considerations allows a designer to choose the most appropriate device and inter-action functions (e.g., zooming into an overview, navigating
a detail with respect to an overview or to another detail) to apply on it, given the different views and interpretations (multi-perspective). The goal of this design methodology is therefore to lead to the design of interactive solutions that increase the understanding of a rich and complex informa-tion.
Our proposal stems from properties of both OD and FC interfaces. As in OD, different views can be allocated to different devices, subject to different interaction styles; as in FC, some views act as a continuous context of more de-tailed views, improving the ability to understand and inter-pret data meaning at each level.
After reviewing the relevant literature we introduce our design space based on extended OD–FC specification, give a rationale for it and discuss two case studies in the domains of energy management and cultural heritage promotion.
2.
RELATED WORK
Several studies have been done in the field of OD, FC and zooming interfaces. Cockburn et al [8] have reviewed three categories of information presentation interfaces based on multiple views: OD with separate visualization spaces, FC with a seamless interface joining the two views, and zoom-ing interfaces characterized by selective addition and sup-pression of details in a continuous visualization space. In a historical perspective the advantages and critical features of the three interfaces are discussed. The first FC representa-tions were based on geometric deformation principles similar to the optical effect of ultra-wide angle lenses, hence were called fisheye views [18, 25]. Generalized FC approaches in scientific visualization are discussed in [14]; Pietriga and Ap-pert [21] also discussed variants of the classic fisheye view for FC visualization.
Continuous interaction with dynamic filtering of visible information was at the core of the Pad system, a zooming interface for heterogeneous information based on informa-tion containers in the shape of sheets whose different com-ponents could be looked at a high level of generality or ex-plored in details, possibly changing the information repre-sentation [20]; an extension called Pad ++ is described by Bederson et al [5].
Today, almost all interfaces oriented to information seek-ing, even if differently organized and related to different interaction techniques (discrete vs continuous, localized vs distributed, with homogeneous vs heterogeneous represen-tations), comply with the so-called Shneiderman’s mantra of information visualization [26]: “Overview first, zoom and filter, details on demand”. A stepwise refinement of infor-mation based on progressive disclosure, selection of relevant content and proper representation is a common core. Differ-ences in the way such mantra is obeyed, however, exist and are often related to the underlying technology.
In principle, FC and zooming interfaces present different views at different times, while OD interfaces implement a parallel presentation of the overview and detail information. Multiple view systems aim at generalizing the simultaneous presentation of several levels or perspectives on data in the so called coordinated and multi-view systems. Roberts [24] has reviewed the state of art of about one decade ago from seven perspectives: data processing and preparation, view generation, exploration techniques, coordination and con-trol, tools and infrastructure, human interface, and usability and perception. A different approach was taken by
Baldon-ado et al in [2], where multiple views systems were analyzed from three perspectives: the selection of a view, the pre-sentation of a view, and the relations among different views, which can be based or not on similar affordances, suggesting a set of guidelines for their design. While not strictly related to interaction space hierarchies produced by OD, FC and zooming interfaces, these works are interesting in discussing how complementary views can support the understanding of complex information.
Notable examples of non-geography based complex infor-mation suitable for multi-level exploration come from graph based structures. May et al [19] propose a FC technique for exploring large graphs based on the off-screen represen-tation of context, which is suggested by signposts showing the direction of graph arcs leading to context regions. In-cremental techniques are used to avoid cluttering in case of dense context regions around a focus.
A specific problem in complex information representation is the need to reduce the dimensionality of data to accom-modate on a screen a too large or too deep representation of data. Folding techniques are proposed in [10], which dynam-ically summarize parts of data by folding the data space, a technique symmetric of the perspective deformation repre-sentation used in early FC systems [18, 25]. In [22] combined 3D representations and 2D projections are used to represent complex scatterplots, similar to the projected views used in 3D modelling programs; cues based on color shade, point sizes and selective fading suggest scene depth to capTure the overall 3D aspects of the scatterplot.
A different technological solution to the information vi-sualization scale change is provided by multi-resolution dis-plays, able to present two levels of information on a same screen, with a focus region displayed in high resolution sur-rounded by a low resolution screen surface acting as a con-text [4]. In [3] Baudisch et al compare such screens with zooming and OD interfaces in areas like graphic design, ar-chitecture, map analysis, photogrammetry, chip design, all characterized by the need to analyze a large and detailed in-formation environment; the authors observed that multires-olution displays are more effective in reducing the switch-ing between synthetic and detailed views. Hasan et al [13] discuss a multi-resolution approach based on the identifica-tion of regions of interest in an image, implemented through wavelet analysis leading to dynamic identification of the re-lations between focus and context regions. Usability studies and system analysis have been conducted and are discussed by Hornbæk et al [15] and by Lam et al [17].
3.
AN EXTENDED OD – FC DESIGN SPACE
As opposed to most of the existing works in the litera-ture, we are not focusing on the design of new, more flexible visualization and interaction techniques. We are rather tar-geting at the definition of a structured design space making more evident the complex relationships that exist between data, the different levels of zoom on detail at which data can be presented and the way they can be explored in a com-plex and rich information environment. The goal is to go towards a controlled zooming interface where the zooms are discretized into meaningful steps and qualified in terms of type of information displayed, interaction style and device deployment. This last perspective is in our opinion relevant to improve the design process. The systems relevant for this approach are naturally oriented to multi-device, and each
level has different knowledge goals and interaction modali-ties.
We propose five categories of information to present and interact with that define different goals of an exploring users and correspond to increasing levels of detail in information visualization. These goals are covering functions like the def-inition of the data space, the selection of a proper context for a specific application, the definition of a workspace for ac-curate data exploration, including the deployment on one or more devices and the definition of their coordination, down to the analysis of elementary data and their relationships. We propose also a filtering mechanism that can be applied to each category to define the perspective under which data is observed. In Section 4 we discuss a rationale for such proposal.
Universe. The category corresponding to the coarsest level of information environment is the Universe of Discourse (or simply the Universe). It is a structured space (e.g, a map, a 3D environment, an abstract diagram, etc.) possibly as-sociated to summary data.
The Universe is the frame of reference of the whole infor-mation managed by some interactive application. It defines the environment in which information has a meaning for the user and can be processed in the context of a knowledge do-main. It is indeed quite abstract: being possibly huge, an application is likely constrained to a part of it that serves as a general context for the coarsest level of detail needed. In the universe different “parts” can be defined, related by a common exploratory goal. Each part defines the envi-ronment for a specific application execution (session), and defines also a border (geographical, temporal, conceptual) in which the exploration is or can be uniform in type and modality.
Context. The second category is the Context, defining the part of the Universe used by an application session, and/or relevant for a user with respect to some knowledge goal. Re-ferring to the usual OD–FC parlance, it has properties both of a context and of an overview: as a context it defines the overall set of information within which the user can explore details, and visually links the environment in which details are meaningful; as an overview it represents the summary of all the detailed view the user can access, and also the summary of relevant information if synthetic quantitative representations are used.
At a very broad level and according to the paradigm of zooming interfaces, the Context is a detailed view of the Universe where the accuracy of the detail is limited to the identification of the part of information that can be explored, the remainder of the Universe being almost irrelevant for the user in that specific application session.
Region of interest. The third category is the Region of
Interest (ROI ), defining an area of the context that can be
explored in detail with proper interaction techniques, possi-bly on other devices than those used for the context. The ROI plays several roles. The ROI is the part of the Context that contains information of a given type, referring to the same exploratory goal and with a size adequate for a contin-uous interaction session. For example, it can be a portion of a map delimited by some concrete or conceptual border such as a set of streets enclosing buildings of a certain type, or a city district devoted to specific activities. As such it could
be defined as a focus for the Context and a context for the subsequent category, the Detail (defined later). It is an im-portant concept because it marks a point in the continuum of increasing detail levels where a change in the informa-tion deployment on devices can happen or where a change can be applied in terms of information dimensions that are presented; for example, by entering a world different from the initial one, adopting new dimensions to represent more detailed information, still highly rich and structured, and related to the current location in the previous context and in the previous level of detail.
We could define the ROI as the part of the information environment that supports interactive exploration (and pos-sibly modification) by the user, using proper devices to show and access the content. Rather than being a level of informa-tion with specific visualizainforma-tion properties, the ROI is char-acterized by the amount of information that can be actively explored in a continuous user session, showing its structure and making clear its semantic. A series of ROIs of increasing detail (and decreasing size in a spatially based visualization) makes thus sense as a way to refine information exploration. In terms of the visualization interface, the ROI represents an intermediate level between Context and Detail that fo-cuses on a part of the Context whose detailed representation requires a shift in the interaction, or different device deploy-ment, or a different visualization. Moving the ROI in the Context changes the borders of the accessible information. Detail. The fourth category is the Detail, corresponding to the set of structured and elementary data contained in the ROI, presented and accessed according to visualization and interaction modalities appropriate for the information type. The concept of Detail in our proposal is close to the tra-ditional concept of detail and focus of tratra-ditional OD and FC interfaces; being related to a ROI that can change its extension and coverage of the information environment, it can appear at different degrees of refinement according to the chosen visualization: 3D, symbolic or metaphoric rep-resentations can produce very different visualizations of a same information.
Data item. The fifth category is the Data item, the ulti-mate information of some type related to the context, whose knowledge is important for the user.
The distinction between the Detail and the Data item categories is especially relevant in the context of multivari-ate/multidimensional data, complex aggregations of simple data items or of data items of different type and represen-tation. The two levels might be merged in simple cases. However, our design space explicitly addresses information environments involving multidimensional and multivariate data, hence the separation of the two concepts is relevant.
Further levels of detail imply two different outcomes of this layering process: at one side, they can be considered
optical zooms that add no new knowledge but refine the
knowledge already accessed. At the other side, the selec-tion in a structured detail of an individual data item can set or change the perspective of the observer, leading to a recursion in the data analysis process, as much as described by Perlin and Fox [20] and by Feiner and Beshers [11]. As an example, in a cultural heritage application (like the one discussed in Section 6) the data item accessed at the end of the exploration of a historical city (the Context) can be a church which is the target of a path leading from the district
(the ROI) to its content; the church can be the start of a new exploration of the artworks contained in it, by selecting a proper temporal or authorial Context, then going into a new ROI defined by a part of the church (e.g., the apse) to a mosaic (the detail) and to the associated information (author, technique, historical references, images) which is the new Data item layer. In the first case, interactive fea-tures that apply to the church are limited to an observation and maybe a selection to access a textual description of the church or save the picture of the church. In the second case, interactive features that apply to the church include 3D nav-igation supports.
Perspective. A view modifier can act on all the levels below the universe to change the type of information explored: the
perspective. Different perspectives highlight different
prop-erties of data. A perspective can be the result of applying a filter to information, to select only a subset of instances or of their attributes. Or it can be a selection on an ontological description of the information structure [23]. Through the concept of perspective a multidimensional set of data can be projected on different subsets of its attributes allowing different features to be analyzed.
As the five categories are the results of an integration of OD and FC techniques, different sets of information coex-ist: some correspond to a detailed version of another, some are providing references to others, some are adding meaning and further information to another set. When exploring the information environment, all such sets of data cannot be per-ceived and manipulated in the same place and at the same time. Which data can be viewed and accessed depends on the level of presentation and the perspective: the decompo-sition offered by the five categories above helps reason about it by identifying different sets of information, interactive fea-tures and associating them on a set of suitable deployment devices.
4.
A RATIONALE FOR EXTENDING OD –
FC DESIGN SPACE
The reasons for identifying information categories in the information environment, thus putting into evidence a dis-crete, possibly recursive, hierarchy of OD and FC relations are supported by the need to offer to the user the best way to locate the needed information, to visualize it, and to ac-cess its details in the proper way. For rich and complex information environments this requires to identify at each level of analysis the better visualization and the amount of details (or information dimensions) to expose. In traditional OD–FC paradigm such identification is left to the designer skill. Even in presence of models and guidelines, there is no cue to identify the levels of detail in which a shift of device, visualization, representation, etc., is needed.
First, in terms of interface structuring, in a traditional OD context it is often assumed that the relations between the detail and the overview are simple. For example, the overview is a collection of data or a geographic region and the detail is an element of a collection or a magnified part of the region; alternatively, overview and detail provide dif-ferent views on the same data, the detail depending on the presentation and on the allowed interaction functions (e.g., map view vs street view in Google Maps). A radical shift in the visualized domain and in the interaction is considered
(a) (b) (c)
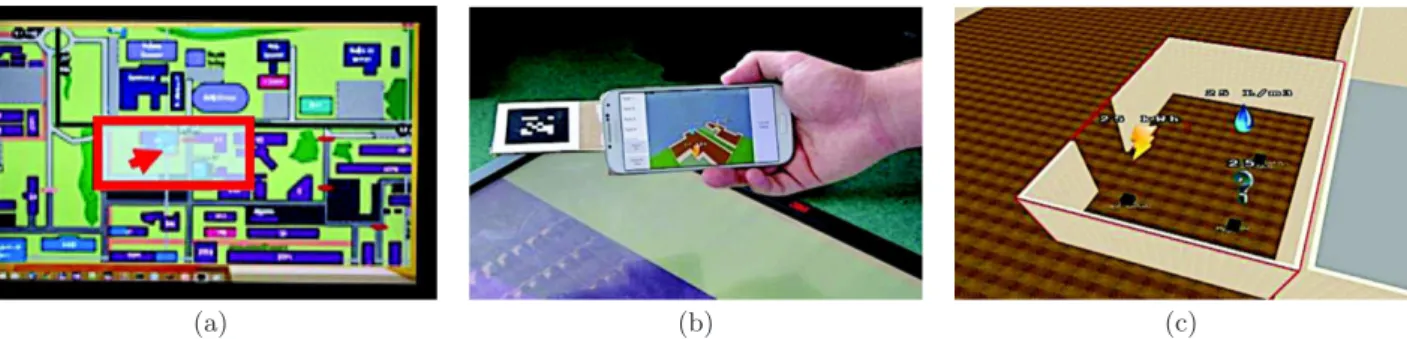
Figure 2: Three levels of visualization of energy consumption data: a Context of the information environment with a ROI highlighted (a); a Detail including building rendering and summary consumption data displayed on a mobile device hovering over the Context display (b); Data items with instant energy consumption information (c).
not usual (indeed, it is in the domain of multi-view represen-tations). But in rich information environments the relations between the overview and the detail (similarly, between the context and the focus in a seamless presentation) are more complex. Indeed, different types of information fill the infor-mation environment: all of them can normally not be visible at the overview and context level due to size/space and to the need to keep such view neutral with respect to the possi-ble tasks a user could do. More flexipossi-ble transitions from the overview and context to the data are required. As an ex-ample, in Google Maps a street view, even if detailed, does not include, e.g., the name of the inhabitants, the date of the next road-work, the place of the under-earth pipes, etc., but this set of information might be highly relevant when planning a replacement of the water pipes in the area.
In addition, to proceed with a rich set of information, the user will most probably not perceive all data together: de-pending on the information needs of a user different aggre-gations of elementary data may benefit from different detail views within the same overview (e.g., different levels of a space hierarchy, different information targets). Being able to adapt the set of data to visualize justifies the need for a structural discretization of the intermediate levels. As an example, in a geographic visualization, country can be detailed into states, which can be refined through the city names, county names, street names, house planes, etc.. Any level can be considered as an aggregation of all the layers below it.
In terms of interface manipulation, an OD paradigm based on two levels at a time is suitable (conceived) for random access to detail data; the overview presents the whole in-formation environment, the user selects the area of interest, details follow. In more complex applications and with richer information some form of feedback is required to assist and guide the user while exploring the data set. Having identified different information content in the overview and in the de-tail, information exploration should be structured according to the relations between overview and detail not only in pure spatial sense. Conforming to the five categories allows the user to structure interaction into subtasks, therefore assum-ing / enforcassum-ing a systematic and goal oriented exploration of (part of) the context and overview to access detail data: the user selects the area to explore according to a knowledge goal (a task) and then examines the details accordingly.
Finally, given the non trivial relation between overview and detail, such relations must be made evident across the
different steps of refinement in exploration. Feedback must thus be provided, as the discovery of detail information can lead the user to move to other details, to change the goal, to go back to previously explored details.
5.
A CASE STUDY IN ENERGY
CONSUMP-TION MONITORING
The neOCampus project initiated and funded by the Uni-versity of Toulouse is a multidisciplinary approach towards the definition of a smart, sustainable and innovative campus. Ecologists, computer scientists, material scientists, electric-ity specialists, thermal and acoustics experts together com-bine their expertise to offer new services on the campus and reduce the ecological footprint of the campus. In this con-text, the energy consumption monitoring is one of the sub-objectives identified that contributes to better manage the energy consumption. Accessing this information relies on a huge information system, including historical and instant en-ergy consumption, different types of enen-ergy (gas, electricity, heating, water, etc.), regarding buildings and floors, rooms and even individual devices. To refine this system and help provide the user with an appropriate interactive setting for visualizing this information, we proposed to project man-agers to design the application adopting our extended OD– FC approach.
The University is spread over different and clearly sepa-rated geographical sites of the city; adopting this point of view, altogether these sites and the associated information about energy related equipments and services define the Uni-verse of the targeted information system. Out of it, only one specific part is considered in this paper: the scientific cam-pus. All the buildings forming this campus are physically located on the same geographical area of the city. According to our model the scientific campus is therefore the starting Context.
In the Context, a user can view the spatial organization and names of the buildings, streets and trees of the cam-pus, and can annotate them. The Context corresponds to an overall 2D map of the campus. Elements of the entire campus can be viewed and the user can move a cursor in the map to point at the different buildings, identify their position and extension in the map. The user can zoom into the context by keeping constant the domain of the informa-tion displayed. Data related to energy consumpinforma-tion is not visible at this level.
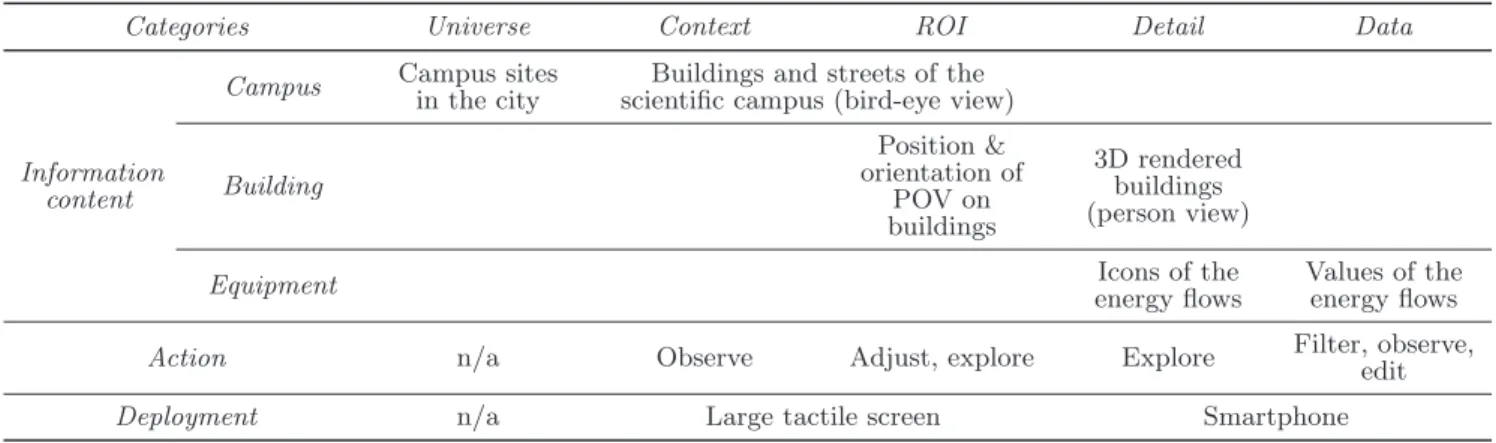
Table 1: A summary of the five categories of information structuring and interaction in the energy manage-ment case study.
Categories Universe Context ROI Detail Data
Campus Campus sitesin the city scientific campus (bird-eye view)Buildings and streets of the
Information content Building Position & orientation of POV on buildings 3D rendered buildings (person view)
Equipment energy flowsIcons of the Values of theenergy flows
Action n/a Observe Adjust, explore Explore Filter, observe,edit
Deployment n/a Large tactile screen Smartphone
To provide access to the energy consumption informa-tion, a Region of Interest must be defined. We designed it metaphorically as a lens covering an area of the campus for which the user will have access to a different, more de-tailed and architecturally structured view that includes the energy consumption data. The area covered by the lens can be the whole context or a part of it.
In the ROI the same data accessible at the Context level, i.e., the 2D map of the campus, is also accessible. Moreover, a point of view is shown, whose position and orientation can be adjusted to mark the position and orientation towards which the user watches when navigating into the Detail level. This representation helps the user to better understand how the part of the scientific campus explored at the detail level is related to the ROI and to the Context.
The Detail includes a complementary representation of every building present in the ROI: it is a 3D rendering that makes evident not only the extension on the map of the building but also its architectural structure made of floors and rooms, to which energy consumption data is related. The 3D rendering inside the ROI can be explored by adjust-ing the point of view. The data related to energy consump-tion becomes visible at this level: carousels containing an icon for each energy flow (a yellow lightning for electricity, a blue flame for gas, etc.) are attached to the corresponding elements (building, floor, room, device) in the 3D visualiza-tion.
Finally, the ultimate Data in this scenario is the set of mul-tidimensional information describing the energy consump-tion as numerical values with proper units: different per-spectives can be selected to filter such data, such as instant data, historical data, relative data (i.e., percentage of the campus), etc..
This case study has been implemented by deploying the different views on two devices: the Context and the Region of Interest are displayed on a tactile horizontal screen; the Detail and Data are displayed on a smartphone (Figure 2). The Context is the map of the scientific campus, which fills the horizontal screen. The ROI is displayed as a red rect-angle enclosing a portion of the Context, that the user can adjust and in which an icon figures the position and orien-tation of the current point of view adopted by the user.
The Detail is displayed on a smartphone hovering on the horizontal screen. The point of view adopted to render the
3D view of the building on the smartphone is related to the smartphone position and orientation over the screen. The data selected is also displayed on the smartphone screen. It involves textual labels presenting the energy consumption data aligned with the corresponding 3D element displayed in the detail. This information and visualization organization is summarized in Table 1 together with a brief description of its implementation.
6.
A CASE STUDY IN CULTURAL
HER-ITAGE
In the context of an art exhibition held at Ca’ Foscari about the experience in Venice of William Congdon, a pro-tagonist of the American Action Painting, a multimedia in-stallation was prepared, made of three large interactive ta-bles showing three maps of the city of Venice where a number of spots marked the city places depicted by famous painters. Each table was dedicated to a different historical period: Renaissance, XVIII-XIX Century, modern era. Users could touch the spots with customized mobile devices to “grab” a set of artworks referred to that location and neighborhoods, that could then be displayed on the mobile device with addi-tional information, or projected on a few shared projectors surrounding the table. Several users could operate each ta-ble at the same time; local use of the mobile devices allowed users to individually browse the surroundings of the selected place even if physically decoupled from the table, through a suitable synchronization mechanism between the table and the mobile device. Each table was thus providing a gen-eral overview and a context to the focused exploration of artworks’ details on the personal devices and/or the shared projections.
The installation was appreciated by the visitors, and at the exhibition’s end we decided to use this experience to create a new learning environment for explaining the evo-lution of visual art in Venice during centuries. The basic idea was still to show the artworks in the context of the city locations that they were depicting, but due to the ed-ucational aspects of the installation we planned to include much more information about the artworks themselves and the architectural aspects of the city.
Assuming that the artworks are the ultimate focus of the user exploration, we decided to rely on our design space to guide our reasoning on the definition of the progression
(a) (b) (c)
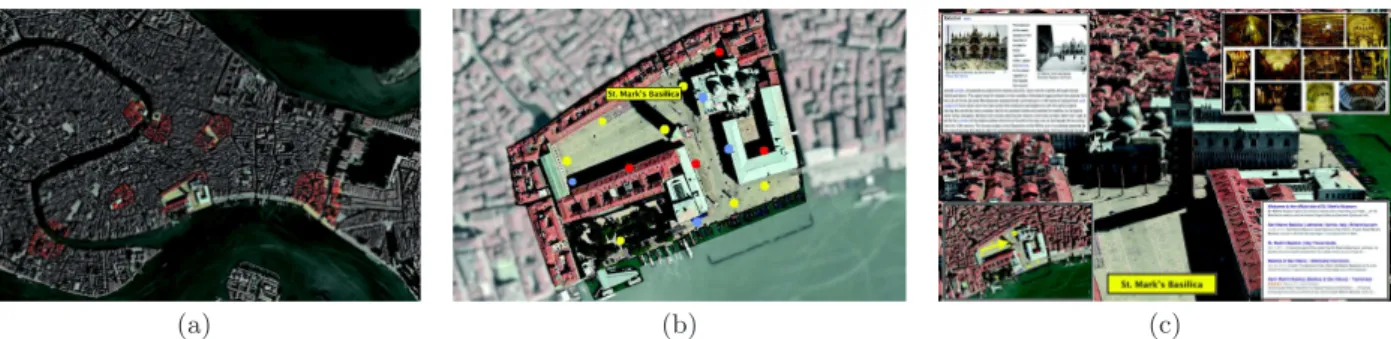
Figure 3: Three levels of visualization in a cultural heritage application: the Context with some predefined ROIs (a); a close view of a ROI with spots marking the presence and type of artworks(b); a Detail collecting multimedia Data items (c).
from a general overview to the detailed information and to deploy the information on different devices. The project is currently in development; here we present the first results of the design phase, containing the overall organization of the information and the intended deployment on three types of hardware: a large interactive table, a medium-sized tablet and, possibly, a smartphone. Figure 3 shows the expected visualizations in the different categories. The images are obtained from the early simulations and mockups used to document the project progression.
The Universe is the whole set of artworks and architec-tures managed by the system. It is so dense of information that it can be explored only by filtering information accord-ing to some criteria settaccord-ing the exploration domain and goal. Indeed, since in the actual exhibition the artworks were split on several tables, each collecting a historical-artistic period, a suitable criterium is the period to explore, that filters the Universe defining a Context.
Such Context, showing the city of Venice as it was in the chosen period (represented by ancient and modern maps), is projected on the table. It can be zoomed and moved, and the actual areas where relevant artworks exist are highlighted allowing users to target their exploration properly.
The relations between the paintings, the architectures and the city districts show a clear distribution in a few areas of most of the artistic representation of the city: the St. Mark area, the arsenal, the St. Mark basin, the surroundings of the most important churches and palaces, etc.. To retain coherence in the set of artworks resulting from a selection, we foresee a number of predefined Regions of Interest, rather than a free selection (Figure 3a). The ROI shows a number of spots of different colors on the area of the city defining the ROI itself, the colors being representatives of artwork types: paintings, architectures, statues, etc. (Figure 3b).
The choice of the ROI marks also the switch from the table hosting the context view to the device used for de-tailed exploration, which can be a tablet or a smartphone. The ROI can be transferred on the tablet/smartphone with proper actions and gestures (to be designed but not relevant for the goal of this paper). On the tablet, the ROI is equiv-alent to the overview or a context view in a traditional OD – FC system, while on the table the ROI is a detail or focus of the city.
By selecting a relevant spot the Detail level is accessed on the same mobile device (Figure 3c). Since the information associated to an artwork is complex and large, the Detail is indeed a set of Data items (a multidimensional
informa-tion) of different nature: text, pictures, videos and audio narrations, references to external documents, etc.. It offers, therefore, several implementation options, such as opening a pop up on the tablet or replacing the tablet content by a new window in a gallery style, or other (still to be designed at this stage of the project).
7.
CONCLUSION
In this paper we introduced a design model for multilevel interfaces based on OD and FC techniques in order to bet-ter support inbet-teraction with a rich information environment. This design model is based on the properties inherent to FC et OD enriched with a discretization of the increasing detail levels from a general overview of the whole information en-vironment (the Universe) down to the ultimate Data items, through a renewed concept of Context and the new concept of Region of Interest. The five categories of information vi-sualization corresponding to increasing levels of detail based on this rationale have been illustrated on a case study re-lated to an energy consumption monitoring scenario and on a case study in progress related to cultural heritage fruition. Through the use of this conceptual framework, and as il-lustrated in Table 1 for the energy consumption case study, the different sets of information identified (campus, build-ing, equipment in the energy consumption case study) can easily be assigned to the most appropriate level proposed by our model, depending on the true goal of the information environment exploration. If several levels of granularity of one set of information are required to explore the informa-tion environment, then they will most probably appear in different levels of the framework. Conversely, in the art case study, each categories of our design spaces revealed possible design solutions, thus structuring our reasoning about the re-design of this application.
As a result, each level of our conceptual framework is as-sociated to one or several sets of information, at the appro-priate level of granularity, thus offering a clear view on the relations between the different contexts, overviews, focuses and details forming the rich information environment.
We anticipate, and we will further study this in future works, that the design of the appropriate interaction tech-nique can then be grounded on this conceptual framework (bottom row in Table 1). Indeed, for each level, the data to manipulate, their level of granularity, the actions to per-form on them and their relation to the other levels are made explicit: interaction techniques design will therefore have to
rely on these considerations to offer a coherent set of inter-action techniques supporting a multi-level interinter-action in a rich information environment.
8.
REFERENCES
[1] Z. S. H. Abad, C. Anslow, and F. Maurer. Multi surface interactions with geospatial data: A systematic review. In Proc. of the Ninth ACM Int.
Conf. on Interactive Tabletops and Surfaces (ITS ’14),
pages 69–78, 2014.
[2] M. Q. W. Baldonado, A. Woodruff, and A. Kuchinsky. Guidelines for using multiple views in information visualization. In Proc. of the Working Conf. on
Advanced Visual Interfaces (AVI ’00), pages 110–119,
2000.
[3] P. Baudisch, N. Good, V. Bellotti, and P. Schraedley. Keeping things in context: a comparative evaluation of focus plus context screens, overviews, and zooming. In Proc. of the SIGCHI Conf. on Human Factors in
Computing Systems (CHI ’02), pages 259–266, 2002.
[4] P. Baudisch, N. Good, and P. Stewart. Focus plus context screens: combining display technology with visualization techniques. In Proc. of the 14th annual
ACM Symposium on User Interface Software and Technology (UIST ’01), pages 31–40, 2001.
[5] B. B. Bederson and J. D. Hollan. Pad++: A zooming graphical interface for exploring alternate interface physics. In Proc. of the 7th Annual ACM Symposium
on User Interface Software and Technology, UIST ’94,
pages 17–26. ACM, 1994.
[6] T. Butkiewicz, W. Dou, Z. Wartell, W. Ribarsky, and R. Chang. Multi-focused geospatial analysis using probes. IEEE Trans. on Visualization and Computer
Graphics, 14(6):1165–1172, 2008.
[7] A. Celentano and F. Pittarello. From real to metaphoric maps: Cartography as a visual language for organizing and sharing knowledge. Journal of
Visual Languages and Computing, 23(2):63–77, 2012.
[8] A. Cockburn, A. Karlson, and B. B. Bederson. A review of overview+detail, zooming, and
focus+context interfaces. ACM Comput. Surv., 41(1):Article 2, 2009.
[9] M. Cossalter, O. J. Mengshoel, and T. Selker.
Multi-focus and multi-level techniques for visualization and analysis of networks with thematic data. In Proc.
of Visualization and Data Analysis (VDA 2013), 2013.
[10] N. Elmqvist, N. Henry, Y. Riche, and J.-D. Fekete. Melange: Space folding for multi-focus interaction. In
Proc. of the SIGCHI Conf. on Human Factors in Computing Systems, CHI ’08, pages 1333–1342. ACM,
2008.
[11] S. K. Feiner and C. Beshers. Worlds within worlds: Metaphors for exploring n-dimensional virtual worlds. In Proc. of the 3rd Annual ACM SIGGRAPH
Symposium on User Interface Software and Technology, UIST ’90, pages 76–83. ACM, 1990.
[12] G. Fuchs, M. Kreuseler, and H. Schumann. Extended focus & context for visualizing abstract data on maps. In CODATA Prague Workshop on Information
Visualization, Presentation, and Design, 2004.
[13] M. Hasan, F. F. Samavati, and C. Jacob. Multilevel focus+context visualization using balanced
multiresolution. In Int. Conf. on Cyberworlds (CW
2014), pages 145–152, 2014.
[14] H. Hauser. Generalizing focus+context visualization. In G.-P. Bonneau and T. E. G. Nielson, editors,
Scientific Visualization: The Visual Extraction of Knowledge from Data, pages 305–327. Springer, 2006.
[15] K. Hornbæk, B. B. Bederson, and C. Plaisant. Navigation patterns and usability of zoomable user interfaces with and without an overview. ACM Trans.
Comput.-Hum. Interact., 9(4):362–389, 2002.
[16] W. Kuhn. Handling data spatially: Spatializing user interfaces. In Advances in GIS Research II, Proc. 7th
Int. Symposium on Spatial Data Handling, SDH’96,
pages 877–893, 1996.
[17] H. Lam and T. Munzner. A guide to visual multi-level interface design from synthesis of empirical study evidence. Tech. Report TR-2010-11, UBC Computer Science, 2010.
[18] J. D. Mackinlay, G. G. Robertson, and S. K. Card. The perspective wall: Detail and context smoothly integrated. In Proc. of the SIGCHI Conf. on Human
Factors in Computing Systems, CHI ’91, pages
173–176. ACM, 1991.
[19] T. May, M. Steiger, J. Davey, and J. Kohlhammer. Using signposts for navigation in large graphs. Comp.
Graph. Forum, 31(3pt2):985–994, 2012.
[20] K. Perlin and D. Fox. Pad: An alternative approach to the computer interface. In Proc. of the 20th Annual
Conf. on Computer Graphics and Interactive
Techniques, SIGGRAPH ’93, pages 57–64. ACM, 1993.
[21] E. Pietriga and C. Appert. Sigma lenses: focus-context transitions combining space, time and translucence. In
In Proc. of the SIGCHI Conf. on Human Factors in Computing Systems (CHI ’08), pages 1343–1352, 2008.
[22] H. Piringer, R. Kosara, and H. Hauser. Interactive focus+context visualization with linked 2d/3d scatterplots. In Proc. of the Second Int. Conf. on
Coordinated & Multiple Views in Exploratory
Visualization, CMV ’04, pages 49–60. IEEE Computer
Society, 2004.
[23] F. Pittarello and I. Gatto. ToBoA-3D: an architecture for managing top-down and bottom-up annotated 3D objects and spaces on the web. In 16th Int. Conf. on
3D Web Technology (Web3D 2011), pages 57–65, 2011.
[24] J. C. Roberts. State of the art: Coordinated & multiple views in exploratory visualization. In Proc. of
the Fifth Int. Conf. on Coordinated and Multiple Views in Exploratory Visualization, CMV ’07, pages
61–71, Washington, DC, USA, 2007. IEEE Computer Society.
[25] M. Sarkar and M. H. Brown. Graphical fisheye views. Technical report, Department of Computer Science, Brown University, Providence, RI, USA, 1993. [26] B. Shneiderman. The eyes have it: A task by data
type taxonomy for information visualizations. In Proc.
of the 1996 IEEE Symposium on Visual Languages,
VL ’96, pages 336–343. IEEE Computer Society, 1996. [27] E. Tufte. Envisioning Information. Graphics Press,