This is an accepted manuscript of an article published by Elsevier in International Journal of Drug Policy on Novembre 18 2014, available at http://dx.doi.org/10.1016/j.drugpo.2014.11.006 This manuscript version is made available under de CC-BY-NC-ND 4.0 license
http://creativecommons.org/licenses/by-nc-nd/4.0/ Please cite as:
Chadillon-Farinacci, Véronique, Philippe Apparicio, and Carlo Morselli. 2015. "Cannabis Cultivation in Quebec: Between Space-Time Hotspots and Coldspots." International Journal of Drug Policy 6 (3):311-322. doi: 10.1016/j.drugpo.2014.11.006.
Cannabis Cultivation in Quebec: Between Space-Time Hotspots and Coldspots
Véronique Chadillon-Farinacci, PhD student,École de criminologie, Université de Montréal Pavillon Lionel-Groulx
C. P. 6128, succ. Centre-ville
Montréal (Québec) H3C 3J7 Canada
E-mail : [email protected] Philippe Apparicio, professor
Centre Urbanisation Culture Société (Institut national de la recherche scientifique) 385, rue Sherbrooke Est Montréal (Québec) H2X 1E3 Canada
E-mail : [email protected] Carlo Morselli, professor
École de criminologie, Université de Montréal Pavillon Lionel-Groulx
C. P. 6128, succ. Centre-ville
Montréal (Québec) H3C 3J7 Canada E-mail : [email protected]
Keywords: drug-crime, cannabis cultivation, space-time analysis, Kulldorff’s scan statistics
ABSTRACT BACKGROUND
Cannabis cultivation has become increasingly localized, whether soil-based or hydroponic growing methods are used. Characteristics of a given location, such as its climate and the equipment it requires may influence general accessibility or attract different types of offenders based on potential profits. The location of crops, especially hydroponic crops, suggests a certain proximity to the consumer market via semi-urban and urban environments, while making it possible to avoid detection. This article examines the cannabis market through its cultivation.
METHODS
The stability of temporal and spatial clusters of cannabis cultivation, hotspots, and coldspots between 2001 and 2009 in the province of Quebec, Canada, are addressed. Studying the geography of crime is not a new endeavor, but coldspots are rarely documented in drug market research. Using arrests and general population data, as well as Kulldorff’s scan statistics, results show that the temporal distribution of cannabis cultivation is highly seasonal for soil-based methods.
RESULTS
Hydroponic production shows adaptation to its soil-based counterpart. Stable patterns are found for both spatial distributions. Hotspots for soil-based cultivation are found near several urban centers and the Ontario border. For hydroponic cannabis cultivation, a new hotspot suggests the emergence of an American demand for Quebec-grown cannabis between 2007 and 2009. Curiously, the region surrounding Montreal, the largest urban center in Quebec, is a recurrent and stable coldspot for both methods of cultivation.
CONCLUSION
For all periods, spatial clusters are stronger for soil-based methods than in the hydroponic context. Temporal differences and spatial similarities between soil-based cultivation and hydroponic cultivation are discussed. The role of the metropolis is also addressed.
This article applies a new framework for understanding spatial and temporal distribution of cannabis cultivation in Quebec, while differentiating between soil-based and hydroponic methods. As suggested by Potter, Bouchard, and Decorte (2011), cannabis cultivation has evolved through three historical phases, starting with traditional growing, which still takes place today in the Moroccan Riff (Afsahi, 2011). Next, developing countries began to supply developed countries until some started to supply their interior market while exporting to larger ones. Significant changes in supply occurred with the expansion of hydroponic technologies, enabling local cultivation and making it possible to avoid detection at customs. Specifically in North America, most cannabis transactions occur at a local level. Cannabis production has become increasingly local in industrialized countries. Indeed, 72.5% of the worldwide cannabis trade takes place on the same continent and 57.5% within the same region (Boivin, 2011). This sets cannabis apart from other types of drugs (e.g., cocaine and heroin). This article discusses the spatial dynamics of the cannabis market, which has more local features than other drug markets. We will analyze the cannabis market, specifically the cultivation segment, in terms of both its temporality and spatiality. We will begin by introducing market concepts, from which our theoretical framework and characteristics particular to the production of cannabis will follow.
The market logic behind cannabis cultivation
Ghosh and McLafferty (1987) wrote that “good locations allow access, attract large numbers of customers, and increase the potential sales (…)” (cited by Rengert et al., 2000: 226). Analyzing cannabis cultivation from the angle of location strategies involves consideration of demand proximity. Some authors put forward the importance of a relative closeness to urban centers (Cocklin, Walker, & Blunden, 1999) while others emphasize the rural nature of cannabis cultivation (Wilkins & Casswell, 2003).
An essential element in the study of markets is the commodity chain which refers to a set of steps involved in the flow of goods and services from a source to the customer (Mentzer et al., 2001). Cultivation would be the production step and herbal cannabis the end product. The flows described by Mentzer et al. (2001) imply that each step is linked. Cannabis cultivation is linked to its distribution and sale which is connected to the demand. Researchers have advanced the hypothesis of a hub-and-spoke distribution system between cannabis traffic and cultivation, covering a broader territory through a concentration at central transshipment points, leading to others further afield (Rodrigue, Comtois, & Slack, 2006). The location of cannabis production is a crucial issue, involving two territorial considerations: 1) customers who are readily reachable and 2) those that are more distant (authors, forthcoming).
In addition to accessibility concerns, differences in the modus operandi of cannabis cultivation may imply varied geographical patterns. Soil-based cannabis farming has a higher risk of detection by either law enforcement or competitors, while hydroponic cultivators have a greater risk of arrest (Bouchard, 2007). Yet hydroponic cultivation makes it possible to settle on the outskirts of cities. Tremblay, Bouchard, and Petit (2009) suggest that rural or semi-urban areas may present good geographical opportunities for soil-based cannabis producers.
The distance of cities means better access to land and less visibility due to lower population density. However, proximity to the urban environment allows producers to reach consumers. Indoor hydroponic cultivation facilities partially compensate for the problem of visibility.
To our knowledge, scholars have not empirically verified the optimal buffer zone from cities for the two types of cannabis cultivation. However, Brantingham and Brantingham (1991) discussed these buffer zones on a micro level: crime locations are close, but not too close to homes. In this study, it should be noted that we intend to examine them at a regional level. In sum, the potential spatial proximity of cannabis cultivation to its market appears to be one of the key features distinguishing soil-based from hydroponic cultivation. Relative proximity to the market is the focus of this article.
Theoretical background: Von Thünen’s land rent theory
According to Polèse and Shearmur (2009), economic models of land use and location of agricultural activities are intertwined. Both start from the premise that land functions compete spatially. When a particular location is chosen for a given function, it illustrates an advantage over other potential uses. In this sense, the spatial dynamics of economic activities have given rise to the idea of land rent, which was first proposed in the early nineteenth century (Von Thünen, 1826).
Land rent theory attempts to answer the following question: what will be produced, and where? To find out, one must consider the conditions of production including yield per unit area (r), market price per unit of product (p), production costs per unit of product (c), transportation costs (T) (unit of account per unit of product and per unit distance) and distance to market (m) where the product is sold to customers.
Land rent (R) refers to additional revenues solely attributable to land location rather than to any extra effort on the producer’s part. Under specific conditions, production remains profitable at a certain distance from the market. Beyond a given distance, the cost of either land or transportation becomes too high (Polèse & Shearmur, 2009).
In other words, producers seek to maximize the profitability of their land. For this purpose, they acknowledge the important impact of transportation costs, which can be adjusted according to location (Sinclair, 1967). Profits decrease when the distance to market is great. Therefore, land rent is the maximum value a producer can pay for the land, without losing money.
Von Thünen’s land rent theory is based on the context of an isolated state surrounded by wilderness, a flat site without rivers or mountains and with homogeneous soil quality and climate (Polèse & Shearmur, 2009). Von Thünen calculates the cost of transportation using the straight distance from where the product is sold. We agree that these conditions are difficult to achieve, particularly in the North American industrialized context. However, the theory is useful in documenting criminal markets.
In the study of crime, risks of detection and arrest induced by the distance are added to the costs discussed by Von Thünen (1826). In fact, according to Reuter (1983), distance diverts the attention of law enforcement officials and possible competitors. Geographic expansion of criminal activities occurs only in certain situations: 1) supply and demand opportunities and 2) systematic impunity within the market. With these conditions, distance implies less problematic exposure (Tremblay, Cusson, & Morselli, 1998). Otherwise, the challenge is to find the optimal distance for the firm’s location and product transportation. The land rent theory is useful in identifying areas where offenders discovered profitable locations for cannabis cultivation. Cluster identification is also helpful in detecting coldspots, i.e. areas where the cannabis production is less profitable.
Von Thünen’s land rent theory (1826) was used in a crime-related article analyzing the effects of casino gambling on real estate values (Buck, Deutsch, Hakim, Spiegel, & Weinblatt, 1991). In this article, we analyze cannabis cultivation clustering as part of a commodity chain.
Cultivations and characteristics
Soil-based cannabis farming generally occurs extra-muros in places such as forests, national parks or private agricultural lands (Cocklin et al., 1999; D'Entremont Partelow, 2008; Plecas & Diplock, 2007).
According to seasonal changes, the harvest takes place between the end of the summer and early fall in countries with a moderate climate. Hydroponic cultivation, in contrast, requires more sophisticated installations controlling light levels, temperature and nutrient supplies. This method gets better results in terms of the amount of time required before the crop becomes harvestable. Production conditions play a significant role in effectiveness. Bouchard (2008) estimated the ratio of ounces per plant at 1.9 for outdoor soil-based cannabis,1.3 for indoor soil-based cannabis and 1.1 for hydroponic crops, while the mean number of harvests per year is 1.0 for outdoor soil-based cannabis, 2.6 for indoor soil-based cannabis and 3.6 for hydroponic cannabis. In this sense, hydroponic methods are more effective. Such plantations are exclusively found intra-muros. This method can be used at any time during the year, free of any constraints and uncertainty caused by an unstable or unfavorable climate (Plecas & Diplock, 2007; Weisheit, 1993).
Moreover, in general, cannabis cultivation is an activity for which both knowledge and equipment are easily accessible (Morrison, 1997), mostly through specialized magazines and websites (Decorte, 2010), as well as in gardening stores (Bouchard & Dion, 2009). We posit that accessibility will be greater with soil-based methods because knowledge and equipment are of lesser importance in comparison to hydroponic cultivation.
The arrival of hydroponic culture and accessibility to its equipment brought new producers to the market. These two methods simultaneously compete to provide demand for cannabis. Little is known about how hydroponics is temporally distributed compared to soil-based production. We also suspect that the two methods attract different offenders, as suggested in typologies that differentiate profit and non-profit motives (Hough et al., 2003; Weisheit, 1992). Non-profit oriented cannabis producers appear to prefer small-scale crops, due to the personal nature of their consumption, their hobbies and their ideology but also in order to avoid organized crime (Hakkarainen & Perälä, 2011). They voluntarily withdraw from the cannabis market. Profit-oriented cannabis cultivation attracts either criminal organizations looking for substantial profit (Beauregard, Brochu, & Gagné-Tardif, 2010; Weisheit, 2011) or independent producers (Cocklin et al., 1999; Tremblay et al., 2009), including those seeking supplementary incomes to compensate for economic difficulties (Cocklin et al., 1999). This article captures cannabis market dynamics through hotspots and cold spots as proxies of intensive activities for both methods of cultivation.
Clusters as hotspots and coldspots
Despite the lack of a universally accepted definition of hotspots (Chainey & Ratcliffe, 2005; Harries, 1999), Sherman (1995) made an attempt, defining them as “small places in which the occurrence of crime is so frequent that it is highly predictable, at least over a one year period” (p.36). Hotspots are determined according to thresholds that depend on the cluster identification method used.
Among methods available to detect local spatial clusters, we find scanning methods. For example, Kulldorff’s scan statistics (Kulldorff, 1997; Kulldorff, Huang, Pickle, & Duczmal, 2006) make the scanning window variable according to a predefined threshold for the population to reach.
In the criminological literature, spatial hotspots feature prominently (Ceccato & Haining, 2004; Levine, 2006) although temporal clustering is addressed as well (Cusimano, Marshall, Rinner, Jiang, & Chipman, 2010). Kulldorff (1997) also elaborated a temporal version of his spatial scan statistics, in which a most likely hotspot is searched for in an interval divided into subintervals.
Hotspots, whether temporal or spatial, are a concentration of criminal events (Chainey & Ratcliffe, 2005). More precisely, they correspond to a statistically significant over-representation of cases over time or space in a given subperiod or subregion within the whole period or area of study. Coldspots could be defined as the exact opposite. Yet, coldspots are not well documented in the criminological literature. In fact, the empirical contribution of coldspots receives little attention and is seldom used in criminology, unlike in other disciplines, such as health sciences (Kulldorff, Athas, Feuer, Miller, & Key, 1998). We define a coldspot as a subrepresentation of criminal events spatially or temporally located in a portion of
the whole period or area under study. The relevance of the study of coldspots lies in reaching an overall understanding of the phenomenon, especially its stability. For example, they make it possible to verify whether a police operation actually destabilized cannabis producers by reducing the incidence rate in a former hotspot by comparing it to the rest of the territory. In this sense, when discussing clusters, we include spatial and temporal hotspots and coldspots.
The contribution of hotspots and coldspots to the study of cannabis cultivation is vast. Very few spatial and temporal quantitative analyses have been conducted on drug crimes, and even fewer on drug production in industrialized countries. Before engaging in a discussion of possible explanations, as others have done with other crimes, cluster detection makes an initial diagnosis possible. Spatial and temporal analysis can inform stakeholders allocating resources about the stability of the phenomenon. At the same time, this study may possibly confirm empirical findings relative to the location of cannabis cultivation activities alleged in the literature discussed earlier (Cocklin et al., 1999; Tremblay et al., 2009; Wilkins & Casswell, 2003). We also document the adaptation mechanisms of hydroponic producers who can grow cannabis throughout the year, but who must also compete more when those who grow cannabis in the soil are active.
Coldspots, more specifically, provide us a complementary understanding of phenomena and help us identify areas where protective mechanisms influence offenders’ rational choices (Cohen & Felson, 1979). Hotspots and coldspots are implicitly affected by law enforcement interventions. The primary objective of police forces is to eradicate cannabis cultivation (Sûreté du Québec, 2008). The instability of clusters in a region might follow the effectiveness of a police intervention or indicate resilience if a hotspot returns. In addition, spatial and temporal analysis are relevant for other jurisdictions that, like Quebec, have domestic producers of cannabis: other provinces of Canada (Ontario Association of Chiefs of Police, 2003), the United States (Hurley, West, & Ehleringer, 2010; Weisheit, 2011), the United Kingdom (Potter, 2006), New Zealand (Cocklin et al., 1999) and the Netherlands (Toonen, Ribot, & Thissen, 2006).
Objective and research questions
The main objective of this article is an analysis of the cannabis market through its cultivation. In doing so, we want to understand the temporal and spatial distribution of cannabis cultivation in Quebec, assess its stability over a nine-year period (2001-2009) and compare the two cultivation methods. The principal inquiry focuses upon the emergence of hotspots and coldspots in the province. We believe that temporal clustering will greatly depend on the method of cultivation; the Quebec climate makes it impossible for extra-muros soil-based cannabis cultivation to take place throughout the year. Unsurprisingly, soil-based cultivation will have seasonal hotspots around summer and early fall because crops are more visible if not ready to harvest. Coldspots will occur in winter. We do not expect a similar pattern for hydroponics. In fact, two hypotheses are advanced with respect to hydroponic farming to illustrate its adaptation. On one hand, hydroponics may compensate for a production gap when it is impossible for soil-based cultivation to respond to the demand with temporal hotspots in winter and spring. In this sense, its temporal clustering may be when soil-based growing is less intensive. On the other hand, hydroponic cultivation could be constant throughout the year and provide product for another market. Thus, there would be no specific hotspots or coldspots. These two hypotheses are plausible, since hydroponic cultivation can occur all-year long.The adaptability and flexibility of hydroponics can be observed through temporal analysis.
Concerning spatial clusters, we would expect hotspots to be relatively close to urban centers, in rural and semi-urban areas in the case of soil-based cultivation, and in semi-urban and urban environments for hydroponics. Indeed, soil-based cannabis cultivation mainly takes place extra-muros, increasing its visibility. More discreetly, hydroponic cultivation occurs inside buildings. The risk of detection is reduced and it allows for greater proximity to urban centers. We agree that the risks of detection and
arrest are two different notions (Bouchard, 2007). However, both are likely to have an influence on offenders’ choice of location for crops, depending on the selected method of cultivation.
In addition, the US border and the province of Ontario are also strategic locations for the external market. In these areas, which are more populous than the province of Quebec, cannabis offenses may be punished more severely. In the present context of globalization, they allow cannabis producers and traffickers to expand their market if their activities are still profitable.
DATA AND METHODS
The study relies on arrest data for cannabis cultivation-related crimes extracted from the Module d’information policière (MIP). The data set includes arrests for crimes that occurred in Quebec between 2001 and 2009 but excludes arrests made by the Gatineau and Quebec City municipal police agencies. Similarly to a recent study conducted by Bouchard (2007), we retained the arrests which concerned the first- and second-most serious charges for soil-based (n = 13,002) and hydroponic (n = 2,904) cannabis cultivation. The database included the date, from which we kept the month and year, as well as the census subdivision (CSD) (also known as the municipality or its equivalent) where the crime was committed. The age and sex of arrestees were also retained.1
In addition, our data include a control population or “population at risk” to which arrests are compared and from which an incidence rate per 100,000 inhabitants was calculated. We extracted the population data of the 15 to 79-year-olds, sorted by gender, from the Institut de la statistique du Quebec (ISQ) for each year between 2001 and 2009. The total population varies from 5,874,565 to 6,285,250 inhabitants, depending on the year. Therefore, for soil-based cultivation, the mean annual rate is 23.8 arrests per 100,000 inhabitants. Hydroponic cultivation has a lower mean rate of 5.3 arrests per 100,000 inhabitants.
The geographical data consist of Cartesian coordinates (x, y). We paired arrests and population data with the CSD centroid. The study area contains 1,287 populated CSDs, which vary substantially in terms of population (mean = 2,356.26, SD = 20,548.86). Depending on the year and the age group, the population between 15 and 79 years old in a CSD can reach 685,770 inhabitants. CSDs include various municipal equivalents. In Quebec, the majority of the population is located along the St. Lawrence River, in the south, where CSDs are smaller and densely populated. In the northern regions of the province, CSDs are less populated and more dispersed.
Statistical Method
In order to understand the spatial and temporal distribution of cannabis cultivation in Quebec, we aim to detect clusters and to compare patterns according to the cultivation method used. A variety of methods can be employed. We use Kulldorff’s scan statistics as applied in SaTScan, a free downloadable program.
Kulldorff’s scan statistics
Kulldorff’s scan statistics are a local cluster detection method that affords the advantages of identifying statistically significant spatial and temporal clusters, while assigning them a relative risk (RR) (Kulldorff, 1997). Cluster detection is controlled by using a population at risk (Sabel & Löytönen, 2004). In other words, populated areas that were likely to have a higher number of arrests were modulated according to an incidence rate (number of cases per 100,000 units of population at risk).
1Age was controlled according to the following categories: 15 to 19 years old, 20 to 24 years old, 25 to 29 years
old, 30 to 34 years old, 35 to 39 years old, 40 to 44 years old, 45 to 49 years old, 50 to 54 years old, 55 to 59 years old, 60 to 64 years old, 65 to 69 years old, 70 to 74 years old, and 75 to 79 years old.
For the purposes of spatial analysis, the test scans the study area through circular or elliptical windows. Testing is performed from the centroid of a given region and is repeated until the radius reaches half of the population at risk within the window. When the window has an elliptical form, the major and minor axes, as well as the angle of the ellipse, vary so as to reach the population threshold (Kulldorff et al., 2006). A purely temporal version implies that the windows of subperiods scan the whole period.
For each scan window, Kulldorff’s scan statistics verify the alternative hypothesis stating that the incidence rate is either significantly higher or lower in the window compared to the rest of the territory. To do this, a likelihood function compares the observed and expected cases as follows:
where C represents the total number of crimes across Quebec and c is the number of crimes within the scan window. E[c] is the expected number of crimes in the window, according to the null hypothesis that stipulates a random distribution calculated as such:
where t and T represent the population at risk within the scan window and across Quebec. To determine whether the value obtained from the likelihood ratio (LR) test is significant, it is compared to the LR values obtained from 9,999 random distributions generated with Monte Carlo simulations. Then, the p-value for the observed LR is calculated using its relative rank (R) to those obtained with random distributions:
where n is the number of Monte Carlo simulations. For each CSD centroid, the test keeps the LR values with the highest p-values. The highest one of all is named the most likely cluster (MLC), while those following are considered secondary clusters. The output contains for each cluster: the numbers of CSDs included in the cluster, the number of crimes observed and expected, the incidence rate inside the cluster, and the LR value and its p-value, as well as the relative risk (RR). The latter is the ratio of the probabilities of being arrested inside the cluster in comparison to the rest of the province. The RR can be interpreted as how much more common the phenomenon is inside the scan window compared to the rest of the entire study area, period or subperiod (RR < 1:coldspot; RR > 1: hotspot).
Kulldorff’s scan statistics have been quite widely used in epidemiology to detect cancers (DeChello & Sheehan, 2007; Dietz et al., 2011; Klassen, Kulldorff, & Curriero, 2005) and other infectious diseases (Cooper, Smith, Regan, Large, & Groenewegen, 2008). Nevertheless, few studies have used Kulldorff’s scan statistics to analyze violent and property crimes (Ceccato & Haining, 2004), and even fewer for drug crimes. An exception is the research of Sudakin and Power (2009) on variations in methamphetamine-related incidents in Oregon.
Processing our data using Kulldorff’s scan statistics
For the purposes of analysis, we structured three types of files based on the original data set: 1) a case file that includes the number of soil-based or hydroponic cultivation crimes for each CSD per month; 2) a population file that lists the inhabitants for each between 15 and 79 years old, sorted by gender; and 3) a file that contains Cartesian coordinates (x, y) for the centroid of each CSD based on the 2006 geographic boundaries. This ensured the comparability of results over time. For the purely temporal analysis, we ran the test for each year.
For the purely spatial analysis, the test was first run to analyze the whole period (TAll),which was
then divided into subperiods to be analyzed, i.e. 2001 to 2003 (T1), 2004 to 2006 (T2), and 2007 to 2009
(T3) in order to assess the spatial stability during these three subperiods. The data from the MIP and ISQ
files were structured with SAS version 9.2 (SAS Institute Inc). SaTScan parameters were set as follows:
d D c c E C c C c E c LR
c t CT E * / n) 1 /( R pdetection of high or low rates, and elliptical window and 9,999 Monte-Carlo replications. Outputs were exported to ArcGIS to map the results (ESRI, 2011).
RESULTS
Understanding the purely temporal distribution of cannabis cultivation
The first objective of this article is to understand the temporal distribution of cannabis production and assess its long-term stability. We considered the entire study period between 2001 and 2009 and analyzed each year individually (see Table 1).
– Insert Table 1 about here – Soil-based cultivation
Purely temporal analysis aims to understand the temporality of cannabis cultivation (see Table 1). For soil-based cultivation, the time frames of hotspots and the RR actually display seasonal stability over time. For example, there is a purely temporal hot cluster from May to September 2001 when 1,124 arrests were made. The number of expected cases (779 arrests) is lower than the number of cases actually observed. The incidence rate during that time frame is 38 arrests per 100,000 inhabitants. The relative risk indicates that for that subperiod, there were 2.62 more chances of getting arrested for soil-based cultivation in comparison to the rest of the time period (January to April and October to December 2001). Therefore, this time frame is a purely temporal hot cluster.
The only coldspot that was detected occurs during the winter of 2009. There are 33 observed arrests in that time frame and 182 expected ones. The incidence rate is the lowest in the entire study period for that type of cultivation: 3.1 per 100,000 inhabitants. In other words, the chances of getting arrested between November and December are 84% lower than for the rest of the time period (January to October 2009).
Furthermore, three out of nine years have a hot cluster only covering the month of September. The years 2002, 2003 and 2006 have a most likely cluster that represents more or less 20% of all arrests made during the year. In addition, the years 2003 and 2006 have the first and the second highest RR (2.97 and 2.70) of all years. Also, the year 2002 has the fourth highest (2.55). September seems to be the peak of the cultivation activities.
Unsurprisingly, purely temporal hotspots are mainly found between May and October, the planting and harvesting season.This trend is consistent over nearly a decade, indicating the stability of soil-based cannabis production over time.
Hydroponic cultivation
Unlike soil-based cultivation, hydroponic cultivation appears to be somewhat unstable over time. Nonetheless, the hotspots and coldspots indicate that this type of cultivation tends to adapt itself to the other (see Table 1). For example, the strongest hotspots are between February and June 2009, with 117 arrests and an RR of 2.15, and between March and May 2005, with 154 arrests and an RR of 1.97. During these periods, the incidence rate was more or less twice as high as during the rest of the year. The strongest coldspots are in August 2006 with 12 arrests and an RR of 0.44 and between July and August 2003, with 29 arrests and an RR of 0.45. During these periods, the incidence rate was less than half that of the rest of the year. Interestingly, in the nine years under study, only 2001 presents a temporal overlap of a hotspot of hydroponic cultivation (from September to October 2001) with a hotspot of soil-cultivation (from May to September 2001). In contrast, for the other years when there is a temporal overlap, it proves to be a concordance between a hotspot for soil-cultivation and a coldspot for hydroponic cultivation. We also observe hotspots for hydroponic culture during the winter when there is very little soil-cultivation. Thus, it is possible to say that the temporal pattern of hydroponic cultivation adapts to that of soil-based cultivation and they potentially serve the same market. The number of
observations of hydroponic cultivation is, nevertheless, inferior to that of soil-based cultivation. This observation translates into a lower RR for hydroponic cultivation than its soil-based counterpart.
Nevertheless, hydroponic cultivation displays an unstable pattern over time which reveals an adaptation to market dynamics. For both types of cultivation, the results for temporal trends were consistent with the earlier hypothesis. Hotspots are seasonal for soil-based cultivation while hydroponic cultivation shows signs of adaptation to its soil-based counterpart. It does not seem to directly compensate for the soil-based method, since the presence of coldspots and hotspots is not constant and systematic.
Understanding the purely spatial distribution of cannabis cultivation
The second objective of this article is to understand the spatial distribution of cannabis production and assess its stability. We studied four subperiods between 2001 and 2009 (T1 is from 2001 to 2003, T2
is from 2004 to 2006 and T3 from 2007 to 2009), the fourth one being the entire study period (T:All from
2001 to 2009). Mapping (see Figures 1, 2 and 3) was performed according to the ecumene, the inhabited land including work areas, to facilitate visualization. This way, large CSDs do not have a disproportionate visual importance in comparison with others.
– Insert Figure 1 about here – Soil-based cultivation
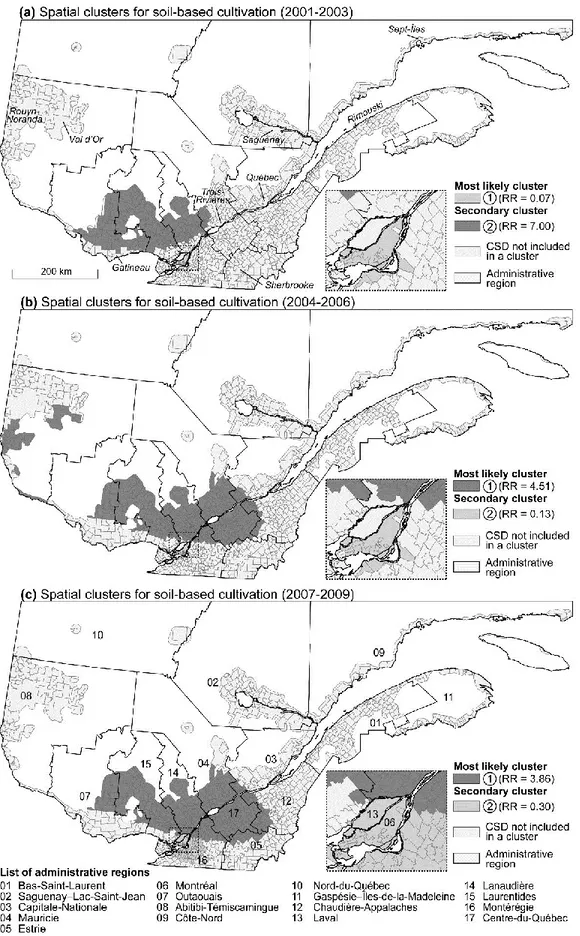
All of the subperiods contain at least one hotspot and one coldspot (see Figure 2 and Table 2) for soil-based cultivation. To facilitate the interpretation of the table, we first present the entire period (Tall)
and then highlight the similarities and differences with the three subperiods (T1, T2 and T3).
– Insert Figure 2 and Table 2 about here –
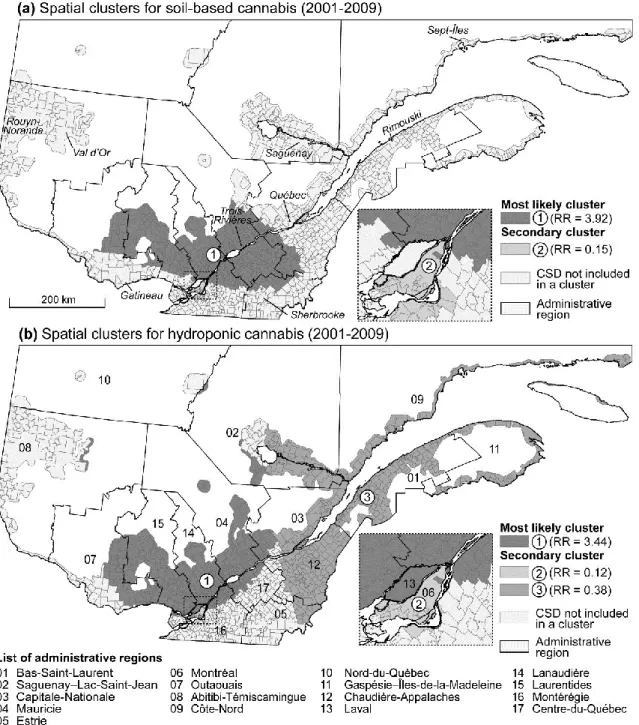
The MLC for the whole period encompasses 396 CSDs, and its centroid is situated in Lac-Santé, an unorganized territory (Figure 1.a). In Quebec, unorganized territories are sparsely populated areas outside local municipalities. In the province, there are nearly a hundred territories like these, which are managed by regional municipalities falling under the county system. This purely spatial hot cluster has 2,484 expected cases and 6,250 observed cases. It includes 48.07% of the total number of arrests for soil-based cultivation and 30.70% of the total number of CSDs. Its relative risk indicates that in the locations affected, there are almost four times the chances (RR=3.92) of getting arrested for soil-based cannabis cultivation in comparison to elsewhere in the province. This hotspot is the largest one of all and is geographically similar to those in the other subperiods studied. Its most concentrated version occurs during T1 (158 CSDs and RR=7.00), where the hotspot is a secondary cluster.
Another secondary cluster for the entire period covers 24 CSDs. Its center is located in Montreal West, a city on the Island of Montreal. This purely spatial cold cluster has 3,787 expected cases and 756 observed cases. Its relative risk is 0.15: the chances of arrest in the coldspot are 85% lower than in the CSDs outside the coldspot. The incidence rate in this coldspot is 4.8 arrests per 100,000 inhabitants. It includes the Island of Montreal and its southern shore. Its close proximity to the hotspot should be highlighted. During T1, the MLC corresponds to a similar area, but it covers fewer CSDs, and has fewer
arrests as well as a lower RR (RR=0.07) (Figure 2.a). Its most sparse version (79 CSDs and RR=0.30) is found during T3 (Figure 2.c).
Soil-based cultivation seems to be spatially stable over the three subperiods. Proximity to urban centers such as Montreal, Trois-Rivières, Sherbrooke and even the Ontario border, can be observed. This finding somewhat supports the hypothesis of the key role played by demand proxies such as urban centers and borders.
Unsurprisingly, Montreal is a recurrent coldspot for all subperiods: it is certainly inconvenient to grow soil-based cannabis in the most populated city. The population is more densely distributed, so visibility is even higher. In this sense, Montreal is definitely not a place where soil-based cannabis farming can be expected. Cannabis cultivation also requires a fixed site so as to enable at least one plant
cycle to be completed. The non-spontaneous aspect of the activity makes the issue of detection even more important in a high-risk location. This result is not surprising, but it is still interesting because there are no other coldspots for this method of cultivation. The other Quebec urban centers did not display a coldspot, despite the fact that Kulldorff's statistics are known to scan large areas (Tango, 2010).
Hydroponic cultivation
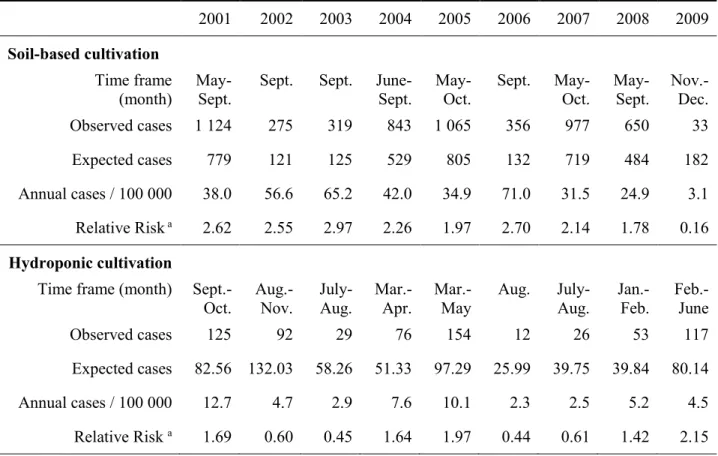
All of the subperiods for hydroponics contain minimally one hotspot and two coldspots. They correspond roughly to the same regions except during T3 where a second hotspot emerges (see Figure 3
and Table 3).
– Insert Figure 3 and Table 3 about here –
For the entire period (Tall), the MLC is a hotspot containing 337 CSDs and 1,467 arrests (Figure 1.b).
Its RR indicates that the incidence rate is 344% higher in this area (RR=3.44) than the rest of the study area. It includes half (50.5%) of the total number of arrests for hydroponic cultivation and 26.1% of the total number of CSDs (Figure 1.b). This hotspot reaches further north than that for soil-based cultivation. It also includes Laval (416,215 inhabitants), a city adjacent to Montreal. Concerning Montreal, it is included in a secondary cluster which is a coldspot of 15 CSDs and 124 arrests for the entire period (Figure 1.b): its RR indicates that the incidence rate is 88% lower (RR=0.12) than the rest of the study area. The incidence rate in this coldspot is 0.9 arrests per 100,000 inhabitants. It includes the Island of Montreal and some cities on its south shore. During T2, it includes both the north and the south shores
(Figure 3.b). Its close proximity to the hotspot can be observed. During the first subperiod (T1), the
coldspot is an MLC for which the incidence rate is 99% lower than in the rest of the province (RR=0.01) (Figure 3.a). The second secondary cluster is also a coldspot including 451 CSDs and 265 arrests. Its RR indicates that the incidence rate is 62% lower (RR=0.38) than the rest of the study area. The incidence rate in this coldspot is 2.3 arrests per 100,000 inhabitants. It includes a sparsely populated area in the eastern part of the province.
During the third subperiod (T3), a second hotspot emerges as a second secondary cluster. It is
composed of 57 CSDs and 46 arrests (Figure 3.c). Its RR indicates that the incidence rate is 511% higher (RR=5.11) than the rest of the study area. It is the most concentrated hotspot of all for hydroponic cultivation. It includes 1.3% of the total number of arrests for hydroponic cultivation and 4.4% of the total number of CSDs. It is located along the American border, a demand proxy, in the southern regions of the province.
Thus, hydroponic cultivation also appears to be fairly stable geographically over the subperiods except for T3 during which a new hotspot emerges (Figure 3.c). Moreover, Montreal itself is a recurrent
coldspot for all subperiods and for both types of cultivation. The intensive intra-muros feature of hydroponic cultivation does not seem to act as a strong incentive to locate crops in urban centers in comparison with soil-based cultivation. Still, hotspots are closer to the metropolis than soil-based cultivation.
The coldspots located east of the territory, in remote and sparsely populated regions, are a new finding. Yet, it would, indeed, be illogical for a producer aiming for efficiency in terms of cannabis cultivation methods to settle too far away from the market. Indeed, a prerequisite for interregional trade is for the cost of transport between regions not to offset the profits (Polèse & Shearmur, 2009). While the cost of land is lower in remote areas because of the greater distance to the market, the higher transportation costs cancel out profits. This indicates that cannabis cultivation in remote areas may tend to be more soil-based. This result is consistent with a study conducted by Cocklin et al. (1999) that focused on the rural aspect of cannabis cultivation.
DISCUSSION
Results show the two types of cannabis cultivation are distinct in terms of spatiality and temporality. The role of the metropolis, as a symbol of the consumer market and as an important coldspot in both cases, is also discussed.
Hotspots showing two types of firms
At first sight, our results are not surprising: the temporal hotspot for soil-based cultivation is found at the end of the summer. This is consistent with a qualitative study conducted by Bouchard, Alain, and Nguyen (2009) which reveals the harvest period to be so intensive that high school students comprise part of the crop work force in some regions. In terms of space, we observe that the affected areas in the hotspot are mainly on the north shore (primarily in Outaouais, Laurentides, Lanaudière and Mauricie). Soil-based cannabis cultivation is seasonal and has been somewhat stable for nearly a decade. The interesting result concerns the comparison of the two methods’ patterns.
As regards hydroponic cultivation, it is also not surprising for its temporal hotspots and coldspots to occur at various times. It does not seem to systematically compensate for market gaps left by soil-based cultivation. Nonetheless, it displays a flexible adaptation to soil-based cultivation. This shows that it is addressing the same broad market. The spatial pattern for hydroponics includes some administrative regions located further north than those involved in soil-based cultivation. Parts of Saguenay–Lac-Saint-Jean and Abitibi-Témiscamingue are included in the hotspots. This is consistent with its intra-muros feature that makes cultivation possible in harsher climates. At the same time, it seems closer to the metropolis for all subperiods. Also, a second hotspot can be observed near the US and Ontarian borders during the third subperiod (T3). This strategic position corroborates the study by Bouchard (2008), who
estimated that slightly more than half (56%) of total cannabis production is intended for consumers outside Quebec. This hotspot appears only in the third subperiod. This could be interpreted as a sign of the growing importance of the American market. In short, hydroponic cultivation does not vary according to seasons and shows spatial stability throughout the subperiods.
In the literature review, we mentioned that hydroponic cultivation may be the most efficient way to produce cannabis, attracting offenders aware of this feature. The coldspot located in the eastern part of Quebec appears to substantiate this finding. Those regions are neither well populated nor strategically placed near an external market. They are not at the optimal distance discussed by Von Thünen (1826) because production is not profitable in either case. At the same time, there is no rational or apparent need to be efficient in producing cannabis in remote regions. For similar reasons, hydroponic cultivation hotspots also appear near the Ontario and US borders, which may supply an emerging external market, according to law enforcement sources (Gendarmerie royale du Canada, 2008). These borders can be understood as transit platforms for a hierarchical distribution system also known as a “hub-and-spoke” system designed to reach more consumers (Rodrigue et al., 2006).
Interestingly, hotspots for both cultivation types are located in roughly the same areas, although hydroponic cultivation is more flexible. This showcases the strategic location of these regions. Spatial cluster identification highlights areas offering optimal profitability for cannabis cultivation, as determined by location and transport, in line with Von Thünen (1826). Cluster identification makes a concrete assessment of those possible areas. This could also be construed as a compromise between security and efficiency for offenders (Morselli, Giguère, & Petit, 2007). It would be interesting to explore the explanatory factors specific to those optimal areas.
In addition, we see that soil-based cultivation drastically differs from hydroponics when analyzing purely temporal patterns. We might ask whether it is possible to compare cultivation methods in regards to the other market players, that is, from the dealers’ and the consumers’ perspective.
Some authors have analyzed crime from an occupational perspective (Bouchard & Nguyen, 2011; Cullen & Link, 1980; Letkemann, 1973). We wonder how to position cannabis cultivation from this stance, in the light of the hotspots identified. Due to the investment and time required for a crop to grow
(Malm, Nash, & Vickovic, 2011), we might consider this activity to be a vocation, especially with hydroponics. The establishment of hydroponic cannabis crops calls for a greater financial investment and a fixed, permanent and accessible site for maintenance. Accordingly, hydroponic cultivation requires a deeper commitment. Our analysis indicates that the two methods of culture are not necessarily purely complementary. It would be interesting to further explore the vocational aspect of the two methods of cultivation, inquiring about growers’ lifestyles and occupations.
All cities are not equal: the “metropolitan effect”
The results lead to an interesting observation: Montreal is an important and stable coldspot across subperiods and methods of cannabis cultivation, although in close proximity to hotspots. For both types of cultivation over the entire period, some of the Island of Montreal and parts of its suburbs are included in the hotspot. This observation should be nuanced because the shape of the scanning window has an impact on the reliability of Kulldorff’s statistics, as the scan is broad. Nevertheless, we noted an extreme proximity of all hotspots to the Montreal coldspot, which is hard to interpret. The Montreal metropolitan area is the most densely populated territory in Quebec. The importance of the strategic location is raised, because we control for the effect of the population. Perhaps there is not enough space for cannabis cultivation or land is too costly. However, the attraction of the largest city remains, as shown by the closeness of hotspots. An interesting explanation could lie in access to a variety of transport infrastructures to meet the domestic and foreign demand, including an airport, a seaport and many main roads and highways. While remaining at a reasonable distance from Montreal, offenders can benefit from the transportation infrastructure of the city.
Another key element is the particularities of cannabis cultivation. Whereas a robbery can be executed in less than a minute (Cusson, Cordeau, & Boisvert, 1994), cannabis cultivation requires time to plant the crop and maintain it through growing cycles. Thus, it is not a crime of opportunity, but extends over a period of time. Routine activity theory mentions that one of the obstacles to the commission of a crime is the presence of guardians (Felson, 2002). These opportunities can take place throughout this period, especially in cities where population is denser and crimes are solved more formally (Brock & Walker, 2005). Indeed, the further we go from cities, the stronger the informal social network, (Weisheit, 1993) and low anonymity encourages informal sanctions rather than calling the police (Brock & Walker, 2005). The suburbs provide a buffer between the two types of environment.
However, results show that not all suburbs are equal. Some parts are included in a hotspot and others in the Montreal coldspot. We need to further explore the history of urbanization of the suburbs to document differences between these communities. Again, the literature mentioned the possible key role of cities and semi-urban environments, as they represent a large number of consumers (Cocklin et al., 1999; Tremblay et al., 2009). As previously discussed and in line with Von Thünen (1826), Montreal being the main market, land is too expensive and detection risks are too high. This could also be explained by the fact that the province of Quebec only has one metropolis. This affects the role of urban centers. The city is inevitably denser and more important in relation to the entire territory.
This study has some limitations. We do not claim to predict the establishment of hotspots or coldspots of cannabis cultivation. In addition, Kulldorff’s scan statistics are sensitive to outliers, parameters are set arbitrarily (e.g. time precision, population at risk, maximum cluster size and spatial window shape) and there are no set guidelines provided by the documentation (Anselin, Meyer, Whalley, & Savoie, 2009). Also, Kulldorff’s scan statistics do not detect clusters different from the scan windows (Goujon-Bellec, Demoury, Guyot-Goubin, Hémon, & Clavel, 2011; Sabel & Löytönen, 2004). Therefore, clusters yielded by Kulldorff’s method are larger than in reality (Tango, 2010).
This article provides an initial diagnosis identifying clusters of cannabis cultivation in Quebec over nearly a decade. Interesting questions were raised, such as the role of Montreal and the comparison of the types of cultivation. The use of spatial modeling, which could incorporate variables such as
geographical proximity to cities, regional economic activities and the labor market, would be interesting to explore in future work.
REFERENCES
Afsahi, K. (2011). Cannabis Cultivation in the Moroccan Rif. In T. Decorte, G. R. Potter & M. Bouchard (Eds.), World Wide Weed. Global Trends in Cannabis Cultivation and its Control (pp. 39-56). Burlington: Ashgate.
Anselin, L., Meyer, W. D., Whalley, L. A., & Savoie, M. (2009). Actionable Cultural Understanding for Support to Tactical Operations (ACUSTO) (pp. 44). Washington: Constructing Engineering research Laboratory (CERL).
Beauregard, V., Brochu, S., & Gagné-Tardif, X. (2010). La culture de cannabis au Québec: un état de la situation. Revue internationale de criminologie et de police technique scientifique, 63(2), 86-99. Block, R. (2007). Software review: Scanning for clusters in space and time. A tutorial review of SaTScan.
Social Science Computer Review 25(2), 272-278.
Boivin, R. (2011). Le monde à l'envers : Analyse de la structure du trafic transnational de drogues illicites. (Ph.D), Université de Montréal, Montréal.
Bouchard, M. (2007). A Capture–Recapture Model to Estimate the Size of Criminal Populations and the Risks of Detection in a Marijuana Cultivation Industry. Journal of Quantitative Criminology, 23, 221-241.
Bouchard, M. (2008). Towards a realistic method to estimate cannabis production in industrialized courntries. Contemporary Drug Problems, 35, 291-320.
Bouchard, M., Alain, M., & Nguyen, H. (2009). Convenient labour: The prevalence and nature of youth involvement in the cannabis cultivation industry. International Journal of Drug Policy, 20, 467-474.
Bouchard, M., & Dion, C. B. (2009). Growers and Facilitators. Probing the Role of Entrepreneurs in the Development of the Cannabis Cultivation Industry. Journal of Small Business and Entrepreneurship, 22(1), 25-58.
Bouchard, M., & Nguyen, H. (2011). Professional or amateurs? Revisiting the notion of professional crime in the context of cannabis cultivation. In T. Decorte, G. Potter & M. Bouchard (Eds.), World Wide Weed: Global Trends in Cannabis Cultivation and its Control (pp. 109-126). London: Ashgate.
Brantingham, P. J., & Brantingham, P. L. (1991). Environmental Criminology. Prospect Heights, IL: Waveland Press.
Brock, D., & Walker, D. (2005). Rural Policing and the Drug Problem: An Examination of the Influence of Major Metropolitan Areas on Drug Offending in Surrounding Rural Communities. The Police Journal, 78, 129-146.
Buck, A. J., Deutsch, J., Hakim, S., Spiegel, U., & Weinblatt, J. (1991). A Von Thünen Model of Crime, Casinos and Property Values in New Jersey. Urban Studies, 28(5), 673-686.
Ceccato, V., & Haining, R. (2004). Crime in Border Regions: The Scandinavian Case of Öresund, 1998-2001. Annals of the Association of American Geographers, 94(4), 807-826.
Chainey, S., & Ratcliffe, J. (2005). GIS and Crime Mapping. Cornwall: John Wiley & Sons.
Cocklin, C., Walker, L., & Blunden, G. (1999). Cannabis Highs and Lows: Sustaining and Dislocating Rural Communities in Northland, New Zealand. Journal of Rural Studies, 15(3), 241-255. Cohen, L. E., & Felson, M. (1979). Social Change and Crime Rate Trends: A Routine Activity Approach.
American Sociological Review, 44(4), 588-608.
Cooper, D. L., Smith, G. E., Regan, M., Large, S., & Groenewegen, P. P. (2008). Tracking the spatial diffusion of influenza and norovirus using telehealth data: a spatiotemporal analysis of syndromic data. BMC medicine, 6, 16. doi: 10.1186/1741-7015-6-16
Cusimano, M., Marshall, S., Rinner, C., Jiang, D., & Chipman, M. (2010). Patterns of urban violent injury: a spatio-temporal analysis. PloS one, 5(1).
Cusson, M., Cordeau, G., & Boisvert, R. (1994). Le crime du point de vue de l'analyse stratégique. In D. Szabo & M. Leblanc (Eds.), Traité de criminologie empirique (pp. 91-112). Montréal: Les Presses de l'Université de Montréal.
D'Entremont Partelow, C. (2008). Using GIS to depict resource risk from probable cannabis cultivation sites. (Master of Arts), San Jose State University, San Jose. (Paper 3588)
DeChello, L. M., & Sheehan, T. J. (2007). Spatial analysis of colorectal cancer incidence and proportion of late-stage in Massachusetts residents: 1995-1998. International journal of health geographics, 6, 20. doi: 10.1186/1476-072X-6-20
Decorte, T. (2010). The case of small-scale domestic cannabis cultivation. International Journal of Drug Policy, 21, 271-275.
Dietz, N. A., Sherman, R., Mackinnon, J., Fleming, L., Arheart, K. L., Wohler, B., & Lee, D. J. (2011). Toward the identification of communities with increased tobacco-associated cancer burden: Application of spatial modeling techniques. Journal of carcinogenesis, 10, 22. doi: 10.4103/1477-3163.85184
ESRI. (2011). ArcGIS Desktop: Release 10. Redlands, CA: Environmental Systems Research Institute. Felson, M. (2002). Crime and Everyday Life (Third edition ed.). Thousand Oaks: Sage Publications Inc. Gendarmerie royale du Canada. (2008). Rapport sur la situation des drogues illicites au Canada.
Ottawa.
Ghosh, A., & McLafferty, S. L. (1987). Location strategies for retail and service firms. Lexington: Lexington Books.
Goujon-Bellec, S., Demoury, C., Guyot-Goubin, A., Hémon, D., & Clavel, J. (2011). Detection of clusters of a rare disease over a large territory: performance of cluster detection methods. International journal of health geographics, 10(1-12).
Hakkarainen, P., & Perälä, J. (2011). With a little Help from my Friends – Justifications of Small-Scale Cannabis Growers. In T. Decorte, G. Potter & M. Bouchard (Eds.), World Wide Weed. Global Trends in Cannabis Cultivation and its Control (pp. 75-90). London: Ashgate.
Harries, K. (1999). Mapping Crime: Principle and Practice. Washington (DC): U.S. Department of Justice.
Hough, M., Warburton, H., Few, B., May, T., Man, L., Witton, J., & Turnbull, P. J. (2003). A growing market: The domestic cultivation of cannabis: Joseph Rowntree Foundation & National Addiction Centre.
Hurley, J. M., West, J. B., & Ehleringer, J. R. (2010). Tracing retail cannabis in the United States: Geographic origin and cultivation patterns International Journal of Drug Policy, 21, 222-228. Klassen, A. C., Kulldorff, M., & Curriero, F. (2005). Geographical clustering of prostate cancer grade
and stage at diagnosis, before and after adjustment for risk factors. International journal of health geographics, 4(1), 1. doi: 10.1186/1476-072X-4-1
Kulldorff, M. (1997). A Spatial Scan Statistic. Communications in Statistics - Theory and Methods, 26(6), 1481-1496.
Kulldorff, M., Athas, W. F., Feuer, E. J., Miller, B. A., & Key, C. R. (1998). Evaluating cluster alarms: A space-time scan statistic and brain cancer in Los Alamos, New Mexico. American Journal of Public Health, 88(9), 1377-1380.
Kulldorff, M., Huang, L., Pickle, L., & Duczmal, L. (2006). An elliptic spatial scan statistic. Statistics in Medicine, 25, 3929-3943.
Letkemann, P. (1973). Crime as work. Englewood Cliffs, NJ: Prentice-Halls.
Malm, A., Nash, R., & Vickovic, S. (2011). Co-offending Networks in Cannabis Cultivation. In T. Decorte, G. Potter & M. Bouchard (Eds.), World Wide Weed: Global Trends in Cannabis Cultivation and its Control (pp. 127-144). London: Ashgate.
Mentzer, J. T., DeWitt, W., Keebler, J. S., Min, S., Nix, N. W., Smith, C. D., & Zacharia, Z. G. (2001). Defining supply chain management. Journal of Business Logistics, 22(2), 1-25.
Morrison, S. (1997). The dynamics of illicit drug production. Future sources and threats. Crime, Law & Social Change, 27, 121-138.
Morselli, C., Giguère, C., & Petit, K. (2007). The efficiency/security trade-off in criminal networks. Social Networks, 29(1), 143-153.
Ontario Association of Chiefs of Police. (2003). Green tide : indoor marijuana cultivation and its impact on Ontario. Toronto.
Plecas, D., & Diplock, J. (2007). Marihuana Growing Operations in Alberta 1997-2003 (pp. 60): Centre for Criminal Justice Research (University College of the Fraser Valley).
Polèse, M., & Shearmur, R. (2009). Économie urbaine et régionale. Introduction à la géographie économique (3e édition ed.). Paris: Economica.
Potter, G. R. (2006). Weed, Need and Greed: Domestic Marijuana Production and the UK Cannabis Market. (PhD), University of Sheffield, Sheffield.
Potter, G. R., Bouchard, M., & Decorte, T. (2011). The Globalization of Cannabis Cultivation. In T. Decorte, G. R. Potter & M. Bouchard (Eds.), World Wide Weed. Global Trends in Cannabis Cultivation and its Control (pp. 1-22). Burlington: Ashgate.
Rengert, G., Chakravorty, S., Bole, T., & Henderson, K. (2000). A Geographic Analysis of Illegal Drug Markets. Crime Prevention Studies, 11, 219-239.
Reuter, P. (1983). Disorganized Crime: The Economics of the Invisible Hand. Cambridge: MIT Press. Rodrigue, J.-P., Comtois, C., & Slack, B. (2006). The Geography of Transport Systems. New York:
Routeledge.
Sabel, C. E., & Löytönen, M. (2004). Clustering of Disease. In R. Maheswaran & M. Craglia (Eds.), GIS in Public Health Practice (pp. 51-67). Boca Raton: CRC Press.
SAS Institute Inc. SAS version 9.2. Cary, NC, USA.
Sherman, L. W. (1995). Hot Spots of Crime and Criminal Careers of Places. In J. E. Eck & D. Weisburd (Eds.), Crime and Place (Vol. 4, pp. 35-52). Monsey (New York): Criminal Justice Press. Sinclair, R. (1967). Von Thunen and Urban Sprawl. Annals of the Association of American Geographers,
57(1), 72-87.
Sudakin, D., & Power, L. E. (2009). Regional and temporal variation in methamphetamine-related incidents: applications of spatial and temporal scan statistics. Clinical Toxicology, 47(3), 243-247. doi: doi:10.1080/15563650802516160
Sûreté du Québec. (2008). Le programme Cisaille. Retrieved 15 février 2011, 2011, from
http://www.sq.gouv.qc.ca/prevenir-la-criminalite/programmes/programme-cisaille.jsp
Tango, T. (2010). Statistical Methods for Disease Clustering. New York: Springer.
Toonen, M., Ribot, S., & Thissen, J. (2006). Yield of Illicit Indoor Cannabis Cultivation in The Netherlands. Journal of Forensic Sciences, 51(5), 1050-1054.
Tremblay, P., Bouchard, M., & Petit, S. (2009). The size and influence of a criminal organization: a criminal achievement perspective. Global Crime, 10(1), 24-40.
Tremblay, P., Cusson, M., & Morselli, C. (1998). Market Offenses and Limits to Growth. Crime, Law, and Social Change, 29, 311-330.
Von Thünen, J. H. (1826). Der isolierte Staat in Beziehung auf Landwirtschaft und Nationalökonomie (The Isolated State) (P. Hall, Trans.). Hambourg: maison d'édition non identifiée.
Weisheit, R. A. (1992). Domestic marijuana: a neglected industry. New York: Greenwood Press. Weisheit, R. A. (1993). Studying Drugs in Rural Areas: Notes from the Field. Journal of Research in
Weisheit, R. A. (2011). Cannabis Cultivation in the United States. In T. Decorte, G. R. Potter & M. Bouchard (Eds.), World Wide Weed: The Globalisation and Localisation of Cannabis Cultivation.
Wilkins, C., & Casswell, S. (2003). Organized crime in cannabis cultivation in New Zealand: an economic analysis. Contemporary Drug Problems, 30, 757-777.
Figure 1. Spatial clusters identified by the Kulldorff statistic for both methods of cannabis cultivation for the period including 2001 to 2009 (Tall)
Figure 2. Spatial clusters identified by the Kulldorff statistic for soil-based cannabis cultivation for the three subperiods (T1, T2 and T3)
Figure 3. Spatial clusters identified by the Kulldorff statistic for hydroponic cannabis cultivation for the three subperiods (T1, T2 and T3)
Table 1. Kulldorff’s purely temporal analysis for soil-based and hydroponic cultivation 2001 2002 2003 2004 2005 2006 2007 2008 2009 Soil-based cultivation Time frame (month) May- Sept.
Sept. Sept. June-
Sept. May- Oct. Sept. May- Oct. May- Sept. Nov.- Dec. Observed cases 1 124 275 319 843 1 065 356 977 650 33 Expected cases 779 121 125 529 805 132 719 484 182 Annual cases / 100 000 38.0 56.6 65.2 42.0 34.9 71.0 31.5 24.9 3.1 Relative Risk a 2.62 2.55 2.97 2.26 1.97 2.70 2.14 1.78 0.16 Hydroponic cultivation
Time frame (month) Sept.- Oct. Aug.- Nov. July- Aug. Mar.- Apr. Mar.- May Aug. July- Aug. Jan.- Feb. Feb.- June Observed cases 125 92 29 76 154 12 26 53 117 Expected cases 82.56 132.03 58.26 51.33 97.29 25.99 39.75 39.84 80.14 Annual cases / 100 000 12.7 4.7 2.9 7.6 10.1 2.3 2.5 5.2 4.5 Relative Risk a 1.69 0.60 0.45 1.64 1.97 0.44 0.61 1.42 2.15
Table 2. Kulldorff’s purely spatial analysis for soil-based cultivation
Study period 2001-2009 2001-2003 2004-2006 2007-2009 Cluster number a 1 2 1 2 1 2 1 2 Locations included 396 24 17 158 372 17 376 79 Observed cases 6250 756 123 1027 2141 221 1733 682 Expected cases 2484 3787 1280 182 728 1336 690 1577 Annual cases / 100 000 59.9 4.8 2.5 144.6 77.6 4.4 49.4 8.5 Relative Risk b 3.92 0.15 0.07 7.00 4.51 0.13 3.86 0.30
a The first cluster is the most likely cluster and the other ones are secondary clusters. b All the RR values are significant at P< 0.0001.
Table 3. Kulldorff’s purely spatial analysis for hydroponic cultivation Study period 2001-2009 2001-2003 2004-2006 2007-2009 Cluster number a 1 2 3 1 2 3 1 2 3 1 2 3 4 Locations included 337 15 451 13 289 409 262 19 425 171 21 57 435 Observed cases 1467 124 265 1 543 102 347 88 69 141 79 46 68 Expected cases 665 774 612 322 192 255 11 326 204 35 219 10 139 Annual cases / 100 000 11.7 0.9 2.3 0.02 19.7 2.8 17.3 1.5 1.9 14.5 1.3 17.4 1.8 Relative Risk b 3.44 0.12 0.38 0.01 4.27 0.35 4.28 0.20 0.29 4.85 0.28 5.11 0.43
a The first cluster is the most likely cluster and the other ones are secondary clusters. b All the RR values are significant at P< 0.0001.