Copy number variations in the gene space of Picea glauca
Inheritance and spontaneous mutations
Thèse
Atef Sahli
Doctorat en sciences forestières
Philosophiae doctor (Ph.D.)
Québec, Canada
Copy number variations in the gene space of Picea glauca
Inheritance and spontaneous mutations
Thèse
Atef Sahli
Sous la direction de :
Jean Bousquet, directeur de recherche
John MacKay, codirecteur de recherche
iii
RÉSUMÉ
Les variations de nombre de copies (VNCs) sont des variations génétiques de grande taille qui ont été détectées parmi les individus de tous les organismes multicellulaires examinés à ce jour. Ces variations ont un impact considérable sur la structure et la fonction des gènes et ont été impliquées dans le contrôle de différents traits phénotypiques. Chez les plantes, les caractéristiques génétiques des VNCs sont encore peu caractérisées et les connaissances concernant les VNCs sont encore plus limitées chez les espèces arborescentes. Les objectifs principaux de cette thèse consistaient i) au développement d’une approche pour la détection de VNCs dans l’espace génique de conifères arborescents appartenant à l’espèce P. glauca, ii) à l’estimation du taux de mutation des VNCs à l’échelle du génome et iii) à l’examen des profils de transmission des VNCs d’une génération à la suivante. Nous avons utilisé des données brutes de génotypage par puces de SNPs qui ont été générées pour 3663 individus appartenant à 55 familles biparentales, et avons examiné plus de 14 000 gènes pour identifier des VNCs. Nos résultats montrent que les VNCs affectent une petite proportion de l’espace génique. Les polymorphismes de nombre de copies observés chez les descendants étaient soit hérités soit générés par des mutations spontanées. Notre analyse montre aussi que les estimés du taux de mutation couvrent au moins trois ordres de grandeur, pouvant atteindre de hauts niveaux et variant pour différents gènes, allèles et classes de VNCs. Le taux de mutation du nombre de copies était aussi corrélé au niveau d’expression des gènes et la relation entre le taux de mutation et l’expression des gènes était mieux expliquée dans le cadre de l’hypothèse de barrière par la dérive génétique. Concernant l’hérédité des VNCs, nos résultats montrent que la plupart de ces derniers (70%) sont transmises en violation des lois mendéliennes de l’hérédité. La majorité des distorsions de transmission favorisaient la transmission d’une copie et contribuaient à la restauration rapide du génotype à deux-copies dans la génération suivante. Les niveaux de distorsion observés variaient considérablement et étaient influencés par des effets parentaux et des effets liés au contexte génétique. Nous avons aussi identifié des situations où la perte d’une copie de gène était favorisée et soumise à différentes formes de pressions sélectives. Cette étude montre que les mutations de novo et les distorsions de transmission de VNCs influencent la diversité génétique présente chez une espèce et jouent un rôle important dans l’adaptation et l’évolution.
iv
ABSTRACT
Copy number variations (CNVs) are large genetic variations detected among the individuals of every multicellular organism examined so far. These variations have a considerable impact on gene structure and function and have been shown to be involved in the control of several phenotypic traits. In plants, the key genetic features of CNVs are still poorly understood and even less is known about CNVs in trees. The goals of this thesis were to i) develop an approach for the identification of CNVs in the gene space of the conifer tree Picea glauca, ii) estimate the rate of CNV generation genome-wide and iii) examine the transmission patterns of CNVs from one generation to the next. We used SNP-array raw intensity genotyping data for 3663 individuals belonging to 55 full-sib families to scan more than 14 000 genes for CNVs. Our findings show that CNVs affect a small proportion of the gene space and copy number variants detected in the progeny were either inherited or generated through de novo events. Our analyses show that copy number (CN) mutation rate estimates spanned at least three orders of magnitude, could reach high levels and varied for different genes, alleles and CNV classes. CN mutation rate was also correlated with gene expression levels and the relationship between mutation rate and gene expression was best explained within the frame of the drift-barrier hypothesis (DBH). With regard to CNV inheritance, our results show that most CNVs (70%) are transmitted from the parents in violation of Mendelian expectations. The majority of transmission distortions favored the one-copy allele and contributed to the rapid restoration of the two-copy genotype in the next generation. The observed distortion levels varied considerably and were influenced by parental, partner genotype and genetic background effects. We also identified instances where the loss of a gene copy was favored and subject to different types of selection pressures. This study shows that de novo mutations and transmission distortions of CNVs contribute both to the shaping of the standing genetic variation and play an important role in species adaptation and evolution.
v
TABLE OF CONTENT
RÉSUMÉ ... iii
ABSTRACT ... iv
LIST OF TABLES ... vii
LIST OF FIGURES ... viii
LIST OF ABBREVIATIONS ... ix
ACKNOWLEDGMENTS ... xi
FORWARD ... xii
Chapter 1: General introduction ... 1
1.1. Preamble ... 1
1.2. Copy number variations ... 2
1.2.1. CNV detection methods ... 4
1.2.2. CNV reported in other species including plants ... 4
1.2.3. Functional impact of CNVs ... 5
1.2.4. CNV role in adaptation and evolution ... 6
1.3. CNV generation ... 7
1.3.1. CNV formation mechanisms... 7
1.3.2. Evolutionary consequences of mutation rate variation... 8
1.3.3. Methods for CN mutation rate estimation ... 8
1.3.4. Mutation rate estimates for different genetic variations... 9
1.4. CNV transmission through generations ... 10
1.4.1. Transmission distortions: definition, causes and consequences ... 10
1.4.2. Transmission distortions reported in other species ... 11
1.4.3. Examples of transmission distortions involving CNVs ... 12
1.5. The fate of CNVs ... 13
1.5.1. Examples of deleterious, neutral and advantageous CNVs ... 13
1.5.2. Biological processes and gene functions associated with CNVs ... 14
1.6. Project context, objectives and hypotheses ... 15
1.6.1. Objectives ... 16
1.6.2. Hypotheses ... 16
1.7. References ... 17
Chapter 2: High and variable copy number mutation rates in the gene space of Picea glauca ... 25
2.1. Abstract ... 25
2.2. Résumé ... 25
2.3. Introduction ... 26
2.4. Material and methods ... 28
2.4.1. Data sets... 28
2.4.2. Copy number inference ... 28
2.4.3. CNVs validation with real-time qPCR ... 29
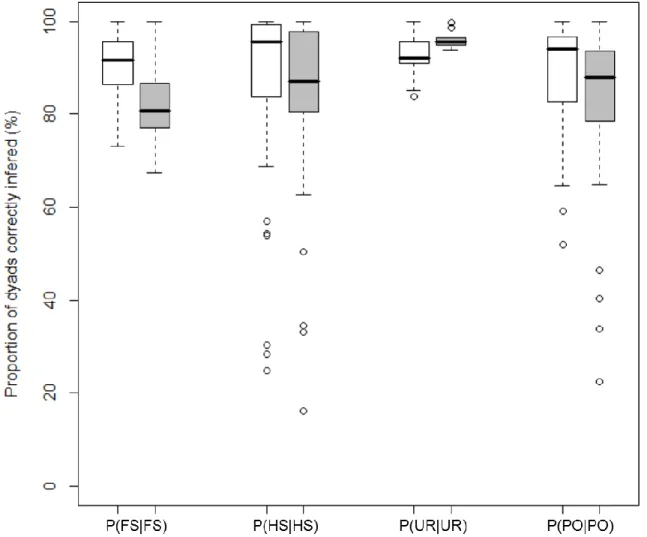
2.4.4. Pedigree reconstruction ... 29
2.4.5. Statistical analyses ... 30
vi
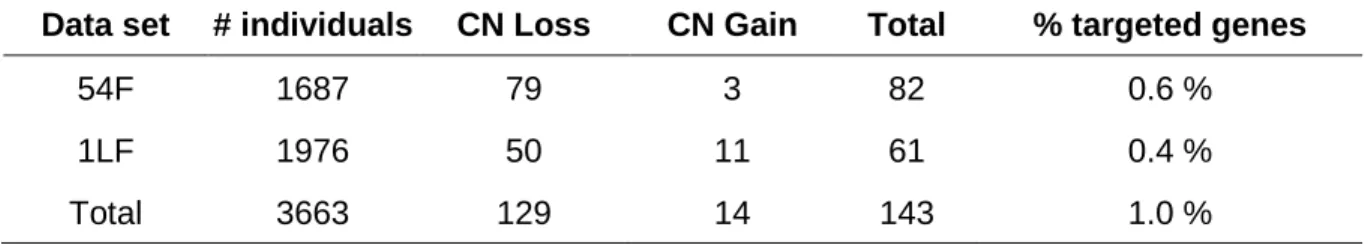
2.5.1. Detection and validation of genic CNVs in pedigree populations ... 30
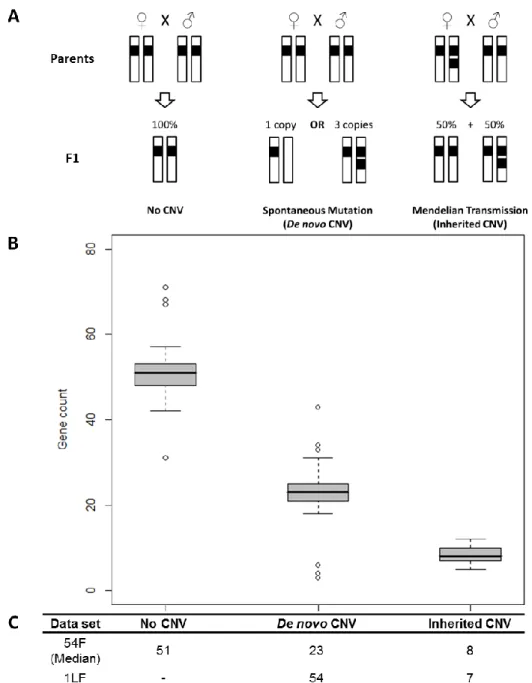
2.5.2. Classification of CNVs as inherited or de novo ... 31
2.5.3. High rates of de novo copy number mutations ... 33
2.5.4. Variable CN mutation rates between genes and for different CNV classes ... 34
2.5.5. Allele specific CN mutation rates ... 36
2.5.6. Relationship between CN mutation rates and gene expression ... 37
2.6. Discussion ... 38
2.6.1. CNVs in the P. glauca gene space ... 39
2.6.2. Copy number mutational features ... 40
2.6.3. Evolutionary consequences of high and variable CN mutation rates in P. glauca ... 42 2.7. Acknowledgments ... 43 2.8. References ... 44 2.9. Supplementary information ... 48 2.9.1. Supplemental File S1 ... 48 2.9.2. Supplemental File S2 ... 49
Chapter 3: Transmission distortions of genic copy number variants cause significant and complex frequency changes between generations ... 52
3.1. Abstract ... 52
3.2. Résumé ... 52
3.3. Introduction ... 53
3.4. Material and methods ... 54
3.4.1. Data set ... 54
3.4.2. Statistical analyses ... 55
3.5. Results ... 56
3.5.1. Most CNVs are associated with transmission distortions ... 56
3.5.2. Transmission distortions contribute to CN allele frequency changes between generations ... 59
3.5.3. Genes with preferential transmission of zero copy ... 61
3.5.4. The case of the F-box gene BT101196 ... 62
3.6. Discussion ... 64
3.7. Acknowledgment ... 67
3.8. References ... 67
3.9. Supplementary information ... 71
Chapter 4: Conclusions ... 78
4.1. Major findings and critical assessment of the thesis work ... 78
4.1.1. CNV detection and classification ... 78
4.1.2. CN mutation rate estimation ... 80
4.1.3. CNV Inheritance ... 82
4.1.4. Unanswered questions ... 83
4.2. Research perspectives and potential applications of this study ... 83
vii
LIST OF TABLES
Table 1.1: Mutation rate estimates for different genetic variations. ... 9 Table 1.2: Systems where CNVs contribute to transmission distortions. ... 12 Table 2.1: Detected CNVs. ... 30 Table 2.2: Copy number mutation rate estimates in Picea glauca and for other eukaryotes. ... 35 Supplemental Table S2.9.1: Partial diallel crossing scheme used to generate the 54 families analyzed in the 54F data set. ... 48 Supplemental Table S2.9.2: Target and reference genes used for CNV validation. ... 50 Table 3.1: Parental and partner genotype effects on copy number transmission ratio distortion (cnTRD). ... 57 Table 3.2: Three patterns of selection on the copy number genotypes of genes favoring the transmission of zero copy. ... 62 Table 3.3: Parental and partner genotype effects on copy number transmission ratio distortion (cnTRD) for the F-box gene BT101196. ... 63 Table 3.4: F-box gene copy number transmission in P. glauca and A. thaliana. ... 63 Table S1: Parental and partner genotype effects on copy number transmission ratio distortion (cnTRD). ... 74 Table S2: Genotypes and alleles frequencies in the parental and offspring generations for three genes favoring the transmission of zero copy for all crosses. ... 75 Table S3: Genotypes and alleles frequencies in the parental and offspring generations for three genes favoring the transmission of zero copy for crosses with at least one heterozygote parent. ... 76 Table S4: Genotypes and alleles frequencies in the parental and offspring generations for three genes favoring the transmission of zero copy for crosses displaying transmission distortions. ... 77
viii
LIST OF FIGURES
Figure 1.1: Overview of determinants of genetic diversity. ... 1
Figure 1.2: Lexicon of genomic variation. ... 3
Figure 1.3: Role of CNVs in adaptation and evolution. ... 6
Figure 1.4: Underlying biological mechanisms behind transmission distortions. ... 11
Figure 2.1: CNV classification. ... 32
Figure 2.2: Pedigrees reconstructions from CNV data.. ... 33
Figure 2.3: Spontaneous mutation rate distribution. ... 36
Figure 2.4: Allele specific mutation rates. ... 37
Figure 2.5: Correlation between mutation rates and gene expression. ... 38
Figure 3.1: Effects of genetic background and genetic distance between parents on copy number transmission ratio distortion (cnTRD).. ... 58
Figure 3.2: Evolution of copy number allele frequencies from the parental generation to the offspring generation is function of the transmission ratio TR(A0). ... 60
Figure S1: Genetic background effect on copy number transmission ratio distortion (cnTRD). Transmission ratio TR(A0) range when a parent is crossed with different partners. ... 71
Figure S2: Genetic background effect on copy number transmission ratio distortion (cnTRD). The distribution of transmission ratio TR(A0) for different families. ... 72
Figure S3: Genetic distance between parents’ effect on copy number transmission ratio distortion (cnTRD) for the F-box gene BT101196. ... 73
ix
LIST OF ABBREVIATIONS
µ: mutation rate
µAS: allele-specific mutation rate
µcg: cross-genome mutation rate
µls: locus-specific mutation rate
ug: genomic mutation rate
A0: zero-copy allele A1: one-copy allele
aCGH: array-comparative genomic hybridization ASCN: allele-specific copy number
BIR: break-induced replication bp: base pair
CN: copy number CNG: copy number gain
cnTRD: copy number transmission ratio distortion CNV: copy number variation
DBH: drift-barrier hypothesis DNA : deoxyribonucleic acid DNM: de novo mutation DSB: double strand breakage FDR: false discovery rate
FoSTeS: fork stalling and template switching Gbp: giga base pair
gd: genetic distance GO: gene ontology
HeD: heterozygous deletion HoD: homozygous deletion indels: insertions-deletions LCR: low copy repeats LOF: loss of function
MA: mutation accumulation line Mbp: mega base pair
x NAHR: nonallelic homologous recombination NGS: next-generation sequencing
NHEJ: non-homologous end joining
P(FS|FS): proportion of full-sib dyads correctly inferred P(HS|HS): proportion of half-sib dyads correctly inferred
P(PO|PO): proportion of parent-offspring dyads correctly inferred P(UR|UR): proportion of unrelated individuals dyads correctly inferred PAV: presence-absence variation
qPCR: quantitative real-time PCR RBM: replication-based mechanism
sdTRD: sex-dependent transmission ratio distortion siTRD: sex-independent transmission ratio distortion SNP: single nucleotide polymorphism
SNV: single nucleotide variation SRS: serial replication slippage SSR: short sequence repeats SV: structural variation
TAMH: transcription-associated mutagenesis hypothesis TCRH: transcription-coupled repair hypothesis
TD: transmission distortion
TR(A0): transmission ration for the zero-copy allele A0 TRD: transmission ratio distortion
xi
ACKNOWLEDGMENTS
“Science is a way of life. Science is a perspective. Science is the process that takes us from confusion to understanding in a manner that is precise, predictive and reliable — a transformation, for those lucky enough to experience it, that is empowering and emotional.” – Brian Greene.
As I look back on the journey that brought me here with all its rewards and challenges, and contemplate the path laying ahead full of excitement and expectations, I could but feel tremendously grateful and lucky to have chosen to pursue a career in science. The past few years were an intense learning period at the academic and personal level. As I progressed in my studies, it was mostly an enjoyable experience and I realize that but for the support and friendship of the people I have come to know, it may have been different. I would like to thank all my colleagues and friends who helped me bring this thesis to completion.
First and foremost, I would like to express my sincere gratitude to my supervisors Prof. John MacKay and Prof. Jean Bousquet for the opportunity to work on this PhD project and for their support and generosity with their time and expertise.
I am grateful to Isabelle Giguère and Sébastien Caron for their help with the wet-Lab experiments.
My thanks go to France Gagnon, Sylvie Blais and Patricia Lavigne for their assistance with the handling of the raw genotyping data.
I would like to extend my thanks to the members of the jury who accepted to evaluate this thesis.
Also, I would like to thank my colleagues in John Mackay’s teams at Laval University and the University of Oxford for their support, constructive criticism and comments; particularly, Julien Prunier and Geneviève Parent with whom I had the most interesting and stimulating discussions.
A special thanks to Mebarek Lamara for the support and friendship he extended to me from the day I first set foot in Quebec City.
xii
FORWARD
This thesis is based on two articles; one peer-reviewed paper accepted for publication in an international journal on April 13th 2017 (Chapter 2) and one manuscript to be submitted
for review also in an international journal (Chapter 3).
Part of Chapter 1 is also planned to be published in a review article commissioned by the international journal Tree Genetics and Genomes.
The Chapter 2 is based on the peer-reviewed article accepted for publication:
Atef Sahli, Isabelle Giguère, Jean Bousquet and John MacKay (2017). High and variable copy number mutation rates in the gene space of Picea glauca. G3: Genes | Genomes | Genetics; manuscript accepted.
The Chapter 3 is based on a manuscript to be submitted for publication as:
Atef Sahli, Jean Bousquet and John MacKay (2017). Transmission distortions of genic copy number variants cause significant and complex frequency changes between generations. Heredity; manuscript.
In both studies, A. Sahli designed the experiments, conducted part of the manipulations in wet-Lab, performed the bioinformatics and statistical analyses, interpreted the results and drafted the manuscripts with the supervision of J. MacKay and J. Bousquet, who also provided the funding.
1
Chapter 1: General introduction
1.1. Preamble
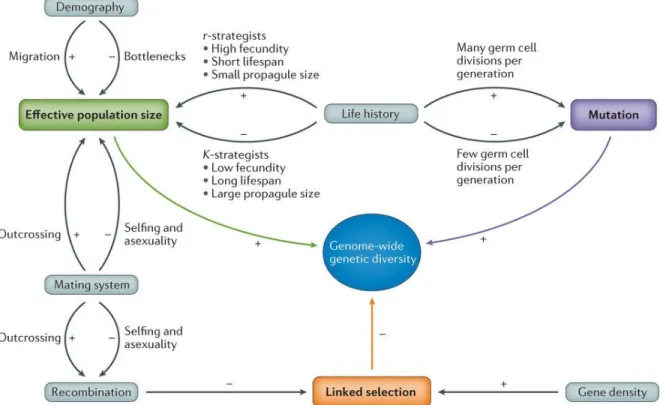
Genetic diversity determines the ability of species to adapt to environmental changes, compete with other species and colonize new ecological niches. The genetic diversity that is present in a population is the result of a balance between the generation of new variants by mutation and the maintenance or purging of alleles influenced by different evolutionary forces (selection, genetic drift, migration, etc.). Genetic diversity within species manifests itself in the form of variations i) among individuals or populations and ii) across the genome of a single individual. The genetic polymorphism harbored by an individual species is determined by three main factors: mutation rate, effective population size and linked selection (Figure 1.1). These factors are in turn influenced by other elements including i) the species life history, mating system and demographic history and; ii) the genome distribution of recombination rates and gene density (Ellegren and Galtier, 2016).
Figure 1.1: Overview of determinants of genetic diversity. Effective population size, mutation rate and linked selection are the main factors affecting diversity. These factors are in turn governed by several other parameters. The direction of correlation is indicated by the + and – symbols [Figure reproduced by permission from Macmillan Publishers Ltd: Nature Reviews Genetics, Ellegren and Galtier (2016), copyright 2016].
2
This thesis reports on the identification of genic copy number variations (CNVs) in the genome of white spruce (Picea glauca [Moench] Voss) and the characterization of their generation rates and transmission profiles. CNVs are large genetic variations believed to play an important role in adaptation and evolution but they are still under studied in forest trees. P. glauca is an ecologically and economically important species in Canada. It is ubiquitous throughout the boreal forest in the region (along with Picea mariana) and is one of the most planted species for wood and pulp production (Franceschini and Schneider, 2016). Like many conifers, its life history and genome architecture characteristics include monoecious reproduction and outcrossing mating with a delayed maturity and long generation time, long life span, large reproductive output, large population size, little inbreeding and strong inbreeding depression, high gene flow and weak natural population structure (Burns and Honkala, 1990; Jaramillo-Correa et al., 2001; Bouillé and Bousquet, 2005; O’Connell et al., 2006; Namroud et al., 2008). The diploid genome of P. glauca is very large (20 Giga-bp) and rich in repeated sequences (mainly mobile elements) and; has a low G-C content (38%) and a decay of linkage disequilibrium (LD) often within gene limits (Pavy et al., 2012; Birol et al., 2013; Nystedt et al., 2013). The gene space of white spruce encompass only 1% of the size of the genome and includes between 37491 and 56064 genes (De La Torre et al., 2014; Warren et al., 2015). Recent advances in forest tree genomics, including P. glauca, are reviewed in Parent and collaborators (2015) and Ingvarsson and collaborators (2016).
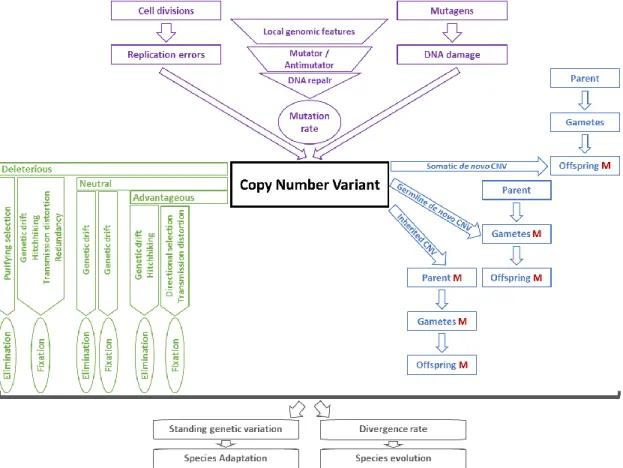
This chapter introduces CNVs as genetic variations and discuss their contribution to adaptation and evolution. Figure 1.3 summarizes the factors influencing the genetic diversity of CNVs. The three main component related to CNV generation, transmission and fate are discussed in detail. Finally, the context, objectives and hypotheses underlying the research work of this thesis are presented at the end of the chapter.
1.2. Copy number variations
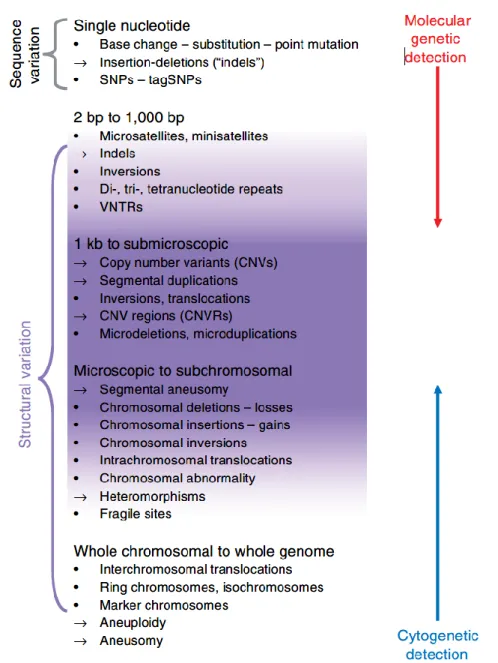
Genetic variations (Figure 1.2) alter functional (coding and regulatory sequences) and non-functional (intronic, intergenic, telomeric and sub-telomeric sequences) DNA sequences and include single nucleotide variations (SNVs), small insertions and deletions (indels: 1 to 100 bp), short sequence repeats (SSRs), mobile elements (MEs) and structural variations (SVs: 50 bp to several Mbp) (Scherer et al., 2007; Carvalho and Lupski, 2016). SVs are classified into two categories i) balanced SVs (with no change in copy number) such as
3
inversions and translocations and ii) unbalanced SVs (with a change in copy number) also called copy number variations (CNVs) which are the result of deletion, duplication or insertion events (reviewed in Alkan et al., 2011).
Figure 1.2: Lexicon of genomic variation. Descriptors of variation began in the realm of cytogenetics, followed by those from the field of molecular genetics. The designation of the category ‘1 kb to submicroscopic’ is somewhat arbitrary at both ends, but is used for operational definition. In a broad sense, structural variation has been used to refer to genomic segments both smaller and larger than the narrower operational definition, as illustrated by the large bracket. The focus of recent discoveries has been the subgroup in the midrange (indicated with strong highlighting), but the gradation of shading illustrates that the biological boundaries may really encompass some forms of variation previously recognized from either cytogenetic or molecular genetic approaches [Figure reproduced by permission from Macmillan Publishers Ltd: Nature Genetics, Scherer et al., 2007, copyright 2007].
4 1.2.1. CNV detection methods
The recent advances of genotyping and sequencing technologies allowed the detection of CNVs genome-wide for many multicellular organisms. The three main technologies used for the identification of CNVs are single nucleotide polymorphism arrays (SNP-arrays), array-comparative genomic hybridization (aCGH) and next generation sequencing (NGS) (reviewed in Alkan et al., 2011). In this work, we developed a reliable approach for CNV identification from SNP-array genotyping data for thousands of white spruce trees. The aCGH technology was also recently used for the detection of genic CNVs in a moderate number of spruce trees (Prunier et al., 2017). The use of NGS technologies for SV identification in trees is still limited to a few species and the studies reported so far involved the analysis of only few individuals in each case (Neves et al., 2013; Warren et al., 2015; Pinosio et al., 2016). For conifer trees, the use of hybridization technologies (SNP-arrays and aCGH) for CNV characterization is more affordable because of their large and complex genomes, but depends on prior knowledge of the genome for probe design, requires a more extensive validation of the detected variants and provides less information than sequencing technologies. Approaches that are based on NGS data analyses, are still more expensive but offer the advantage of providing more reliable and extensive data for the study of SVs. NGS technologies can be used to i) characterize all the categories of SVs, ii) detect variants in coding and non-coding regions reliably, iii) identify the molecular mechanisms involved in SV formation and iv) simultaneously consider sequence and structural variants.
1.2.2. CNV reported in other species including plants
CNVs are among the least studied genetic variations but were widely detected in many model and non-model organisms. CNVs are commonly identified in healthy and sick (cancer and other disorders) individuals (Feng et al., 2010; Mills et al., 2011; Blackburn et al., 2013; Gilissen et al., 2014) and in response to stress conditions (Debolt, 2010). CNVs were reported for many model and crop plants including Arabidopsis, barley, wheat, rice, maize, sorghum, soybean and potato (reviewed in Saxena et al., 2014; Zmienko et al., 2014). However, little effort was invested in the characterization of their frequency, generation rate, formation mechanisms and functional impacts. In trees, CNV analyses are still scarce particularly for non domesticated species such as conifers. Aside from the present study, CNVs were described for three spruce species including white spruce
5
(Prunier et al., 2017), loblolly pine (Neves et al., 2013), poplar (Pinosio et al., 2016) and to some extent Eucalyptus (Myburg et al., 2014).
1.2.3. Functional impact of CNVs
Evidences obtained to date suggest that CNVs are usually clustered in hotspots across the genome (Perry et al., 2006; Itsara et al., 2009; Girirajan et al., 2013). The abundance of CNVs in gene-rich regions is still controversial as CNVs were reported to be over- (Cooper et al., 2007) and under- (Redon et al., 2006; Korbel et al., 2007) represented in genic sequences. This discrepancy may reflect i) biases due to the genotyping technology or the coverage of the genome or ii) differences between copy number loss and copy number gain events with regard to their selective effect, with gene losses expected to occur less frequently as they are supposedly more detrimental to the organism than gene gains (Conrad et al., 2006). Gene redundancy can mitigate the phenotypic effect of gene loss or inactivation. Consequently, CNVs overlapping genes are expected to be more abundant in multi-gene families than in single-copy genes. Some empirical data support this assumption (She et al., 2008) but since CNVs affect certain multi-gene families more than others (particularly NB-LRR and RLK gene families in plants) and are not restricted to multi-gene families (McHale et al., 2012), the alternative hypothesis that CNVs can affect single-copy genes as frequently as large gene families cannot be excluded. A better characterization of the distribution of CNVs across the genome and particularly in coding regions is expected to enhance our understanding of the impact of CNVs on genome stability and the evolution of gene content.
CNVs can overlap a gene sequence entirely (full-CNVs) or partially (partial-CNVs) and can influence gene expression in different ways (Gamazon and Stranger, 2015). Full-CNVs are expected to be less deleterious than partial-CNVs and mainly alter gene expression through dosage effects (McCarroll et al., 2006). Partial-CNVs on the other hand, mostly cause coding sequence disruptions through exons reshuffling, generation of splicing variants or formation of gene fusion (Korbel et al., 2007; Stranger et al., 2007). CNVs can also change gene expression via alterations of cis regulatory sequences (Merla et al., 2006) or when it involves relocation of the gene in a different genomic context (Rodriguez-Revenga et al., 2007). Expression level changes caused by CNVs acting on trans regulatory elements were also reported (Ricard et al., 2010; Gamazon et al., 2011).
6
Deletions, duplications and loss-of-function (LOF) mutations can cause gene dosage effects that alter gene expression in a linear or non-linear way (Gamazon and Stranger, 2015). To mitigate the negative fitness impact of gene dosage imbalance, organisms can rely on compensation mechanisms at the transcriptional and/or post-transcriptional level (Veitia et al., 2013).
1.2.4. CNV role in adaptation and evolution
CNVs are less numerous than SNVs in the genome of an individual but they encompass larger DNA sequences ranging from a few hundred bases to several mega-bases. Consequently, the fraction of the genome affected by CNVs is larger than that altered by SNVs. Furthermore, CNVs are abundant, influence gene function and expression and are involved in downstream phenotypic variation which underlines their importance. Figure 1.3 summarize the contribution of CNV generation rate, transmission patterns and selective values to i) the shaping of the standing genetic variation within populations and ii) the pacing of species evolution.
Figure 1.3: Role of CNVs in adaptation and evolution. The three factors that determine CNV diversity within species, namely CNV origin and mutation rate (in purple); transmission patterns (in blue) and fate (in green), are discussed in the following sections of this chapter.
7
1.3. CNV generation
Cell division requires the replication of the genetic material. Errors that occur during this process can introduce new variants that are transmitted to the daughter cells. Genetic exchanges between chromatids or chromosomes (crossing-overs) during meiosis can also generate new mutations that are transferred to the gametes then to the individuals of the next generation. Exogenous and endogenous mutagens frequently cause DNA damage that can give rise to new genetic variations if not repaired. The rate at which de novo mutation events occur and the efficiency of the DNA repair machinery determine both the rate at which new variants are introduced to the genetic pool of a population (see purple section in Figure 1.3).
1.3.1. CNV formation mechanisms
Through the examination of genomic rearrangements at high-resolution in human disorders and model organisms, Carvalho and Lupski (2016) classified SVs into two categories: recurrent and nonrecurrent rearrangements. Recurrent SVs are variants with simple structures that are found to be similar in size and content when unrelated individuals are compared. These rearrangements are the product of recombination events (mainly ectopic crossovers) that occur during meiosis in the germline. A molecular mechanism involved in their formation known as nonallelic homologous recombination (NAHR) usually requires the presence of low copy repeats (LCR) sequences in the vicinity and was shown to be biased toward the generation of more copy number losses than gains (Chen et al., 2010). On the other hand, nonrecurrent SVs are mainly somatic variants with simple or complex structure and with unique size and content at a given locus among unrelated individuals. Their formation takes place during mitosis and is the result of template slippage or double strand breakage (DSB) repair errors associated with the DNA replication process. Different replication based mechanisms (RBM) can generate nonrecurrent SVs in a LCR dependent or independent fashion including non-homologous end joining (NHEJ), break-induced replication (BIR), serial replication slippage (SRS) and fork stalling and template switching (FoSTeS) (reviewed in Hastings et al., 2009). The local genomic architecture (base content, methylation, recombination rate and repeats’ organization: size, orientation, density and distribution) influences greatly the rate of SV formation (Saxena et al., 2014; Makova and Hardison, 2015; Carvalho and Lupski, 2016).
8
1.3.2. Evolutionary consequences of mutation rate variation
De novo mutations (DNM) generate new variants that fuel the evolutionary process (Hodgkinson and Eyre-Walker, 2011; Jiang et al., 2014; Ness et al., 2015). The standing genetic variation in a population results from an equilibrium between the rate of introduction of new variants through mutation (mutation rate µ), and the fixation or elimination of the available variants by genetic drift or selection (Baer et al., 2007; Katju and Bergthorsson, 2013). Furthermore, differences between the mutation rates of alleles can shape the evolutionary outcome, and the fate of alleles can be determined not only by their effect on fitness but also by the order and rate of their generation (Yampolsky and Stoltzfus, 2001). The observed mutation rate is an evolvable trait (Lynch, 2010a) and was shown to vary overtime (Latta et al., 2013; Bromham et al., 2015) and, between individuals (Haag-Liautard et al., 2007; Conrad et al., 2011) and loci (Hodgkinson and Eyre-Walker, 2011). Different factors contributes to the mutation rate variation at the intraspecific level including i) the fluctuation of selection pressure overtime, ii) the effective population size Ne, iii) the individual genetic background and particularly mutation rate modifiers (mutators and antimutators), iv) the molecular mechanisms involved in the formation of the mutation and v) the local features of genome architecture (Sniegowski et al., 2000; Chen et al., 2010; Latta et al., 2013; Raynes and Sniegowski, 2014; Ness et al., 2015; Sung et al., 2016). The equilibrium mutation rate reached in a population is a tradeoff between the need to generate new variants for adaptation and the imperative of reducing the disruptive or even harmful effect of most mutations (Sniegowski et al., 2000). Accurate estimates of the mutation rate genome-wide and for different types of genetic variations and a proper empirical characterization of the level and source of µ variation are essentials for a better understanding of species evolution and adaptation.
1.3.3. Methods for CN mutation rate estimation
Five methods have been used for the estimation of copy number (CN) mutation rates. (1) Direct estimates for single locus where mutations induce a quantifiable change in genotype or phenotype provided accurate per-locus rate estimations (Lam and Jeffreys, 2007; Watanabe et al., 2009) but since these rates are locus specific, they may be biased and do not inform on the mutation rate spectrum across the genome. Estimates were also derived (2) from CNV frequency in populations using a mutation-selection balance population genetic theory (Lupski, 2007) and (3) from whole genome sequencing data
9
using the age distribution of duplicated genes (Lynch and Conery, 2000, 2003). But since these two indirect methods rely on hypotheses that are not necessarily true in natural populations, the estimates they provide are likely to be underestimated in some situations and overestimated in others. (4-5) The two direct approaches that are believed to have provided the most accurate genome-wide estimates used mutation accumulation line (MA) (Lipinski et al., 2011; Schrider et al., 2013) or pedigree (trios) (Itsara et al., 2010) data. MA experiments allow the estimation of the mutation rate in conditions where purifying selection has a minimal effect but this method has the significant disadvantages of i) identifying only neutral or slightly deleterious variants, ii) drawing conclusions only for a limited number of genetic backgrounds and iii) being applicable only for species with short generation times that are not highly sensitive to inbreeding. The use of pedigrees is straightforward but is contingent on the availability of high-quality genotyping data for large data sets of trios or full-sib families. For species with large and complex genomes and a long generation time such as conifer trees, the use of pedigree data is the only option for the accurate estimation of CN mutation rate genome-wide.
1.3.4. Mutation rate estimates for different genetic variations
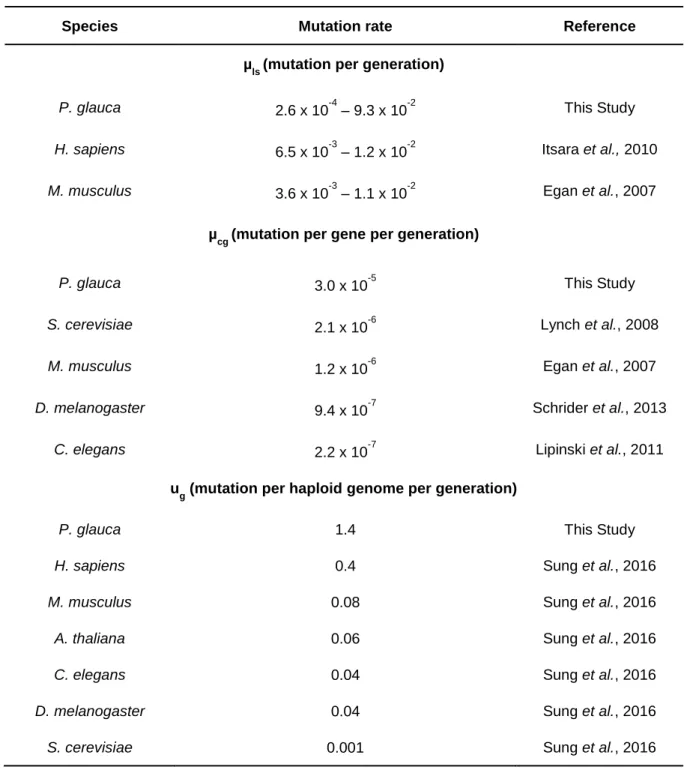
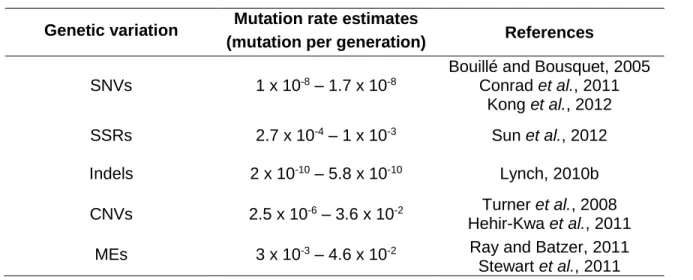
The different forms of genetic variations present in the genome are generated by diverse molecular processes. In addition, they are subject to repair mechanisms with different efficiency levels and have distinct distribution profiles across the genome. Consequently, their de novo mutation rates are expected to be very different. Table 1.1 includes estimates for the mutation rate of different types of genetic variations in multicellular organisms and shows that these rates can vary several orders of magnitude.
Table 1.1: Mutation rate estimates for different genetic variations.
Genetic variation Mutation rate estimates
(mutation per generation) References SNVs 1 x 10⁻⁸ – 1.7 x 10⁻⁸
Bouillé and Bousquet, 2005 Conrad et al., 2011 Kong et al., 2012 SSRs 2.7 x 10⁻⁴ – 1 x 10⁻³ Sun et al., 2012 Indels 2 x 10⁻¹⁰ – 5.8 x 10⁻¹⁰ Lynch, 2010b CNVs 2.5 x 10⁻⁶ – 3.6 x 10⁻² Turner et al., 2008 Hehir-Kwa et al., 2011 MEs 3 x 10⁻³ – 4.6 x 10⁻² Ray and Batzer, 2011
10
1.4. CNV transmission through generations
Genetic variations observed in the genome of an individual are either inherited from its parents or acquired through de novo mutation events. Part of the variants carried by the parents are transmitted to the gametes then to the offspring after fecundation. De novo mutations generated in the germline cells or during the genesis of gametes via meiosis are also transmitted to the next generation. Somatic de novo variants introduced in the genome of the parents (excluding the germline cells) are not transmitted to the descendants in animal species. In plants however, somatic mutations can be transmitted to the next generation because there is no clear separation between germline and somatic cells and the mutations that accumulate in the vegetative tissues during the growth of the individual can be transmitted to the gametes and then to the offspring when the vegetative meristem (within the bud) differentiates into reproductive organs (see blue section in Figure 1.3).
1.4.1. Transmission distortions: definition, causes and consequences
Genetic variations can be transmitted to the next generation according to Mendel’s laws of inheritance or not (called Mendelian or non-Mendelian segregation, respectively). Transmission distortions (TDs) occur when an allele is preferentially transmitted to the next generation at the expense of alternative alleles. This departure from Mendelian expectations is observable in heterozygous individuals and is the consequence of disruptive mechanisms operating during the gametic or zygotic stages of development (Figure 1.4). TDs can be the result of germline selection, meiotic drive, gametic completion, male-female incompatibilities (pollen and pistil), embryo lethality (due to deleterious genotypes), mother-embryo incompatibility or faulty imprint resetting and maintenance (Huang et al., 2013). TDs are under genetic control (Lyttle, 1991) and are the result of complex mechanisms usually involving a responder locus (target of the distortion) and one or more distorter locus(ci) (linked or unlinked modifiers of the level of distortion). TDs can cause a wide range of frequency changes: from mild distortions to a complete skew of transmission in favor of one allele (Koide et al., 2012; Huang et al., 2013). Some balancing forces (recombination, mutation, genetic drift) can interfere and counter TD effects on frequency changes leading to the preservation of both alleles (Polański et al., 1998).
11
Figure 1.4: Underlying biological mechanisms behind transmission distortions [Figure reproduced by permission from Springer: Human Genetics, Huang et al., 2013, copyright 2012].
1.4.2. Transmission distortions reported in other species
Transmission distortions are still largely understudied. The research reported to date is mostly specific to a single locus and has often focused on the particular case of meiotic drive (Didion et al., 2015). More genome-wide analyses of this phenomenon would help to better understand the plethora of mechanisms involved in non-Mendelian transmissions. In human and model organisms, TDs were identified for SNVs, inversions and genic or intronic sequences (Huang et al., 2013). In plants, TDs were linked to interpopulation genetic divergence and reproductive isolation (Leppälä et al., 2008, 2013; Matsubara et
12
al., 2011). The effect of parental sex on TDs was investigated in rice and a few loci displaying sex-independent TDs were reported in this species (Koide et al., 2008, 2012). TDs caused by meiotic drive have been described in maize (Buckler et al., 1999) and monkeyflower (Fishman and Willis, 2005). In these examples, knob structures (acting as artificial centromeres) are responsible for the preferential transmission of selfish DNA elements through a physical mechanism. The most extensive analysis of TDs that we are aware of, was conducted in Arabidopsis thaliana where 130 distorted loci were identified and linked to different phenotypes associated with fecundation and early embryo development (Pagnussat et al., 2005).
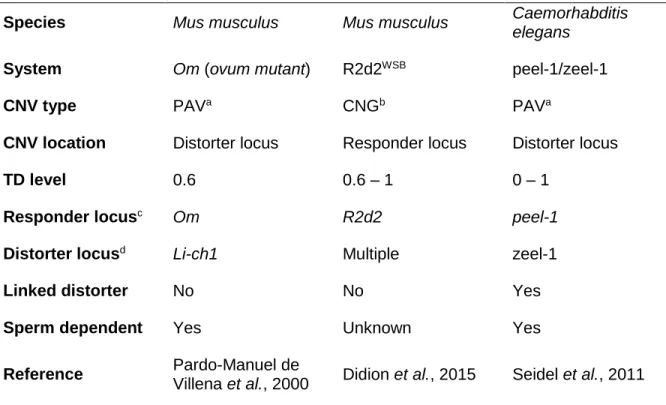
1.4.3. Examples of transmission distortions involving CNVs
Three cases where CNVs contributed to TDs as responder or distorter loci were reported in mice and worm. Table 1.2 summarizes the features of these distortion systems.
Table 1.2: Systems where CNVs contribute to transmission distortions.
Species Mus musculus Mus musculus Caemorhabditis
elegans
System Om (ovum mutant) R2d2WSB peel-1/zeel-1
CNV type PAVa CNGb PAVa
CNV location Distorter locus Responder locus Distorter locus
TD level 0.6 0.6 – 1 0 – 1
Responder locusc Om R2d2 peel-1
Distorter locusd Li-ch1 Multiple zeel-1
Linked distorter No No Yes
Sperm dependent Yes Unknown Yes
Reference Pardo-Manuel de
Villena et al., 2000 Didion et al., 2015 Seidel et al., 2011
aPresence-absence variation; bCopy number gain; clocus subject to transmission distortion; dlocus
13
1.5. The fate of CNVs
CNVs can be detrimental, neutral or advantageous to the organism harboring them. The fate of CNVs (fixation or elimination) is determined in part by their effect on fitness and selective value, the effective size of the population and the degree of their linkage with other genetic variations in the genome. Neutral CNVs can be fixed or purged under the action of genetic drift. Deleterious CNVs are often eliminated by purifying selection but occasionally they can be maintained via genetic drift, hitchhiking (if linked to advantageous loci), transmission distortion or genetic redundancy (if gene function can be performed fully or partially by other genes). Advantageous CNVs are mainly retained in the genome through directional selection and transmission distortion but, can also be eliminated as a consequence of genetic drift or hitchhiking (if linked to deleterious or lethal loci) (see green section in Figure 1.3).
1.5.1. Examples of deleterious, neutral and advantageous CNVs
The general trend observed for CNVs shows that they are i) underrepresented in coding sequences and gene-rich regions (Redon et al., 2006; Korbel et al., 2007), ii) more frequently detected in multi-gene families and genes involved in environmental responses rather than in genes involved in basic cellular functions (Korbel et al., 2009), iii) more likely to overlap genes with low connectivity than highly connected genes (hub genes) within metabolic networks (Kim et al., 2007). Selective forces also act differently according to the class of CNVs; for instance, copy number losses (or deletion) are expected to be more deleterious and under stronger purifying selection than copy number gains (or duplications). Empirical data show that deletions i) occur less frequently in coding sequences relative to duplications (Emerson et al., 2008), ii) are detected in introns more than in exons (Emerson et al., 2008), iii) display lower frequencies in natural populations compared to duplications (Locke et al., 2006). These observations support the afore mentioned hypothesis.
CNVs with deleterious effects on phenotype were shown to be involved in cancer and human disease (reviewed in Shlien and Malkin, 2009; Girirajan et al., 2011). Advantageous CNVs were also identified in humans. Perry and collaborators (2007) associated copy number gains of the human salivary amylase gene AMY1 with the dietary content in starch, which suggest that this CNV is under positive selection. The gene UGT2B17 that metabolizes steroids and foreign compounds displays CNVs that are under
14
balancing and positive selection in European and Asian populations, respectively (Xue et al., 2008). Copy number variation in the olfactory receptor genes on the other hand were shown to be neutral (Nozawa et al., 2007).
1.5.2. Biological processes and gene functions associated with CNVs
Studies of the association between CNVs and quantitative traits are still lacking in plants. However, a few examples were reported in crop plants (Zmienko et al., 2014). Examples of CNVs involved in adaptive and phenotypic traits control include i) flowering time (Díaz et al., 2012) and height (Li et al., 2012) in wheat, ii) tolerance to submergence in rice (Xu et al., 2006), iii) tolerance to aluminum toxicity in maize (Maron et al., 2013), iv) biotic resistance, seed composition, flowering and maturity time, organ size and final biomass in soybean (Cook et al., 2012; Li et al., 2014), seedlessness in grapevine (Di Genova et al., 2014) and reproductive morphology in cucumber (Zhang et al., 2015).
In a survey of presence-absence variations (PAV) in 80 accessions of Arabidopsis thaliana, Tan and collaborators (2012) found that functional classes involved in basic biological processes (such as heat shock proteins and ABC transporter) and transcription regulation (such as Myb and HLH) are less affected by PAVs than gene categories involved in stress response and disease resistance.
Gene ontology (GO) annotations and functional enrichment analyses for genes displaying CNVs showed that these genetic variations are associated with diverse biological processes including: stress response and protein modification in sorghum (Shen et al., 2015); responses to stresses, cell death, protein phosphorylation and defense response in rice (Yu et al., 2013; Bai et al., 2016) and; disease resistance and protein kinases in barley (Muñoz-Amatriaín et al., 2013). In trees, recent studies show that CNVs are enriched in genes involved in response to stress, defense response, cell death and protein modification processes in North American spruces (Prunier et al., 2017) and; resistance to abiotic and biotic stresses in poplar (Pinosio et al., 2016).
Debolt (2010) submitted A. thaliana plants to temperature and biotic stresses for five consecutive generations and then quantified the appearance of CNVs relatively to the genome of the original accession. Genes displaying CNVs as a result of plant growth in stress conditions included resistance genes (from NBS-LRR class), Leucine-rich kinases
15
(involved in hormone mediated signalling), F-box proteins (involved in heat acclimation) and auxin response genes.
1.6. Project context, objectives and hypotheses
The work presented in this thesis is part of an effort dedicated to the i) development of a better understanding of the evolution of conifer trees in comparison to other plant species; ii) identification of the mechanisms involved in the genetic adaptation of forest trees to environmental changes; iii) development of resources to support genetic and phenotypic analyses of spruce and pine trees and iv) formulation of strategies and design of tools for marker assisted tree improvement and conservation (under the projects SMarTForests and GenAC co-directed by Prof. John MacKay and Prof. Jean Bousquet, Université Laval, Canada).
The motivation for this research project came in part from the emergence of new genomic resources generated for conifer trees including large white spruce SNP-genotyping data sets from custom-made chips (Pavy et al., 2013; Beaulieu et al., 2014) that were obtained for a large number of individuals. At the same time, reference genome assemblies were also generated for three conifer species (Birol et al., 2013; Nystedt et al., 2013; Neale et al., 2014); the gene catalog available for white spruce was extended and improved upon (Rigault et al., 2011); a genetic map with higher resolution was published (Pavy et al., 2017) and; large sets of expression data were analyzed for different tissues (Raherison et al., 2012, 2015). The genomic analyses conducted so far however, relied mainly on SNP data and; mitochondrial and chloroplastic DNA to some extent. At the onset of the present work, little was known about CNVs in trees in general and almost no data were available for conifers.
In this study, we took advantage of the availability of large data sets of SNP-array raw intensity data to scan the gene space of P. glauca for CNVs. The data were initially generated for genetic mapping, genetic association studies, and genomic selection modelling based on gene SNPs (Pavy et al., 2013; Beaulieu et al., 2014), and we reanalyzed the raw intensity data using CNV detection methods. Each of the SNPs was positioned within a protein coding gene; these genes in turn were distributed throughout the genome (Pavy et al., 2013, 2017). Our goal was to identify CNVs by examining genotyping data for more than 14 000 genes in 55 full-sib families (for 3663 individuals),
16
provide the first estimates of CN mutation rates in trees and investigate the inheritance of copy number variants.
1.6.1. Objectives
The specific objectives of this Ph.D. thesis project were to: - Develop an approach for CNV detection in white spruce. - Characterize genic CNVs abundance and identify their classes. - Estimate the copy number mutation rate genome-wide.
- Discover CNVs inheritance patterns.
- Examine the potential role of CNVs in the shaping of the standing genetic variation. 1.6.2. Hypotheses
Knowledge about CNVs in trees is still limited. Hence, it is challenging to formulate hypotheses regarding the biology of these genetic variations, particularly in light of the distinct features of conifers life history and genome architecture. Nevertheless, based on the data available for multicellular organisms and particularly human, we propose the following hypotheses:
Hypothesis 1: Genic CNVs affect a small proportion of the gene space.
Since CNVs can have considerable impact on gene function and downstream phenotype, genic CNVs are expected to be rare.
Hypothesis 2: Gene copy losses are expected to be more abundant than gene copy gains.
For many species, reported CNVs are mostly copy number losses. We see no reason to expect a different trend in P. glauca.
Hypothesis 3: Copy number mutation rate is low and variable across the genome. Hypothesis 4: Copy number mutation rate is associated with gene expression.
Previous work in other species suggest that CNVs are mainly deleterious and the rate of their formation is dependent on the local genomic architecture and associated with gene expression. Consequently, we expect the copy number mutation rate to be low, variable
17
across the genome and linked to gene expression according to one of the following hypotheses: i) transcription-coupled repair hypothesis (TCRH); ii) transcription-associated mutagenesis hypothesis (TAMH) or iii) drift-barrier hypothesis (DBH).
Hypothesis 5: Transmission distortions (TDs) are expected to be frequent as a mechanism of restoration of the normal two-copy genotype in a diploid organism and cause significant frequency changes between generations.
Hypothesis 6: TDs are genetically controlled.
CNVs are important genetic variations with considerable impacts on gene function and downstream phenotypes. The work presented in this thesis is a contribution for a better understanding of the biology of these variations outside the context of human disease. For economically and ecologically important species such as conifers, we believe that the application of this knowledge within tree improvement and conservation programs will be extremely valuable in the long term.
1.7. References
Alkan C, Coe BP, Eichler EE (2011). Genome structural variation discovery and genotyping. Nat Rev Genet 12: 363–376.
Baer CF, Miyamoto MM, Denver DR (2007). Mutation rate variation in multicellular eukaryotes: Causes and consequences. Nat Rev Genet 8: 619–631.
Bai Z, Chen J, Liao Y, Wang M, Liu R, Ge S, et al. (2016). The impact and origin of copy number variations in the Oryza species. BMC Genomics 17: 261.
Beaulieu J, Doerksen TK, MacKay J, Rainville A, Bousquet J (2014). Genomic selection accuracies within and between environments and small breeding groups in white spruce. BMC Genomics 15: 1048.
Birol I, Raymond A, Jackman SD, Pleasance S, Coope R, Taylor GA et al. (2013). Assembling the 20 Gb white spruce (Picea glauca) genome from whole-genome shotgun sequencing data. Bioinformatics 29: 1492–1497.
Blackburn A, Göring HH, Dean A, Carless MA, Dyer T, Kumar S et al. (2013). Utilizing extended pedigree information for discovery and confirmation of copy number variable regions among Mexican Americans. Eur J Hum Genet 21: 404–409.
Bouillé M, Bousquet J (2005). Trans-species shared polymorphisms at orthologous nuclear gene loci among distant species in the conifer Picea (Pinaceae): Implications for the long-term maintenance of genetic diversity in trees. Am J Bot 92: 63–73. Bromham L, Hua X, Lanfear R, Cowman PF (2015). Exploring the relationships between
mutation rates, life history, genome size, environment, and species richness in flowering plants. Am Nat 185: 507–524.
18
Buckler ESI, Phelps-Durr TL, Buckler CSK, Dawe RK, Doebley JF, Holtsford TP (1999). Meiotic drive of chromosomal knobs reshaped the maize genome. Genetics 153: 415–426.
Burns RM, Honkala BH (1990). Silvics of North America, Vol. 1 Conifers, US Department of Agriculture, Forest Service: Washington DC.
Carvalho CMB, Lupski JR (2016). Mechanisms underlying structural variant formation in genomic disorders. Nat Rev Genet 17: 224–238.
Chen JM, Cooper DN, Férec C, Kehrer-Sawatzki H, Patrinos GP (2010). Genomic rearrangements in inherited disease and cancer. Semin Cancer Biol 20: 222–233. Conrad DF, Andrews TD, Carter NP, Hurles ME, Pritchard JK (2006). A high-resolution
survey of deletion polymorphism in the human genome. Nat Genet 38: 75–81.
Conrad DF, Keebler JEM, DePristo MA, Lindsay SJ, Zhang Y, Casals F et al. (2011). Variation in genome-wide mutation rates within and between human families. Nat Genet 43: 712–714.
Cook DE, Lee TG, Guo X, Melito S, Wang K, Bayless AM et al. (2012). Copy number variation of multiple genes at Rhg1 mediates nematode resistance in soybean. Science 338: 1206–1209.
Cooper GM, Nickerson D a, Eichler EE (2007). Mutational and selective effects on copy-number variants in the human genome. Nat Genet 39: S22-S29.
Debolt S (2010). Copy number variation shapes genome diversity in Arabidopsis over immediate family generational scales. Genome Biol Evol 2: 441–453.
Díaz A, Zikhali M, Turner AS, Isaac P, Laurie DA (2012). Copy number variation affecting the Photoperiod-B1 and Vernalization-A1 genes is associated with altered flowering time in wheat (Triticum aestivum). PLoS One 7: e33234.
Didion JP, Morgan AP, Clayshulte AMF, Mcmullan RC, Yadgary L, Petkov PM et al. (2015). A multi-megabase copy number gain causes maternal transmission ratio distortion on mouse chromosome 2. PLoS Genet 11: e1004850.
Ellegren H, Galtier N (2016). Determinants of genetic diversity. Nat Rev Genet 17: 422– 433.
Emerson JJ, Cardoso-Moreira M, Borevitz JO, Long M (2008). Natural selection shapes genome-wide patterns of copy-number polymorphism in Drosophila melanogaster. Science 320: 1629–1631.
Feng J, Fu W, Sun F (2010). Frontiers in Computational and Systems Biology, Springer: London, Dordrecht, Heidelberg, New York.
Fishman L, Willis JH (2005). A novel meiotic drive locus almost completely distorts segregation in Mimulus (monkeyflower) hybrids. Genetics 169: 347–353.
Franceschini T, Schneider R (2016). Factors affecting plantation grown white spruce (Picea glauca) acoustic velocity. J For 114: 629–637.
Gamazon ER, Nicolae DL, Cox NJ (2011). A study of CNVs as trait-associated polymorphisms and as expression quantitative trait loci. PLoS Genet 7: e1001292. Gamazon ER, Stranger BE (2015). The impact of human copy number variation on gene
19
Di Genova A, Almeida AM, Muñoz-Espinoza C, Vizoso P, Travisany D, Moraga C et al. (2014). Whole genome comparison between table and wine grapes reveals a comprehensive catalog of structural variants. BMC Plant Biol 14: 7.
Gilissen C, Hehir-Kwa JY, Thung DT, van de Vorst M, van Bon BWM, Willemsen MH et al. (2014). Genome sequencing identifies major causes of severe intellectual disability. Nature 511: 344–347.
Girirajan S, Campbell CD, Eichler EE (2011). Human copy number variation and complex genetic disease. Annu Rev Genet 45: 203–226.
Girirajan S, Dennis MY, Baker C, Malig M, Coe BP, Campbell CD et al. (2013). Refinement and discovery of new hotspots of copy-number variation associated with autism spectrum disorder. Am J Hum Genet 92: 221–237.
Haag-Liautard C, Dorris M, Maside X, Macaskill S, Halligan DL, Houle D et al. (2007). Direct estimation of per nucleotide and genomic deleterious mutation rates in Drosophila. Nature 445: 82–85.
Hastings P, Lupski J, Rosenberg S, Ira G (2009). Mechanisms of change in gene copy number. Nat Rev Genet 10: 551–564.
Hehir-Kwa JY, Rodriguez-Santiago B, Vissers LE, de Leeuw N, Pfundt R, Buitelaar JK et al. (2011). De novo copy number variants associated with intellectual disability have a paternal origin and age bias. J Med Genet 48: 776–778.
Hodgkinson A, Eyre-Walker A (2011). Variation in the mutation rate across mammalian genomes. Nat Rev Genet 12: 756–766.
Huang LO, Labbe A, Infante-Rivard C (2013). Transmission ratio distortion: Review of concept and implications for genetic association studies. Hum Genet 132: 245–263. Ingvarsson PK, Hvidsten TR, Street NR (2016). Towards integration of population and
comparative genomics in forest trees. New Phytol 212: 338-344.
Itsara A, Cooper GM, Baker C, Girirajan S, Li J, Absher D et al. (2009). Population analysis of large copy number variants and hotspots of human genetic disease. Am J Hum Genet 84: 148–161.
Itsara A, Wu H, Smith JD, Nickerson DA, Romieu I, London SJ et al. (2010). De novo rates and selection of large copy number variation. Genome Res 20: 1469–1481.
Jaramillo-Correa JP, Beaulieu J, Bousquet J (2001). Contrasting evolutionary forces driving population structure at expressed sequence tag polymorphisms, allozymes and quantitative traits in white spruce. Mol Ecol 10: 2729–2740.
Jiang C, Mithani A, Belfield EJ, Mott R, Hurst LD, Harberd NP (2014). Environmentally responsive genome-wide accumulation of de novo Arabidopsis thaliana mutations and epimutations. Genome Res 24: 1821–1829.
Katju V, Bergthorsson U (2013). Copy-number changes in evolution: Rates, fitness effects and adaptive significance. Front Genet 4: 273.
Kim PM, Korbel JO, Gerstein MB (2007). Positive selection at the protein network periphery: evaluation in terms of structural constraints and cellular context. Proc Natl Acad Sci USA 104: 20274–20279.
Koide Y, Ikenaga M, Sawamura N, Nishimoto D, Matsubara K, Onishi K et al. (2008). The evolution of sex-independent transmission ratio distortion involving multiple allelic
20
interactions at a single locus in rice. Genetics 180: 409–420.
Koide Y, Shinya Y, Ikenaga M, Sawamura N, Matsubara K, Onishi K et al. (2012). Complex genetic nature of sex-independent transmission ratio distortion in Asian rice species: the involvement of unlinked modifiers and sex-specific mechanisms. Heredity 108: 242–247.
Kong A, Frigge ML, Masson G, Besenbacher S, Sulem P, Magnusson G et al. (2012). Rate of de novo mutations and the importance of father’s age to disease risk. Nature 488: 471–475.
Korbel JO, Urban AE, Affourtit JP, Godwin B, Grubert F, Simons JF et al. (2007). Paired-end mapping reveals extensive structural variation in the human genome. Science 318: 420–426.
Korbel JO, Kim PM, Chen X, Urban AE, Snyder M, Gerstein MB (2009). The current excitement about copy-number variation: How it relates to gene duplication and protein families. Curr Opin Struct Biol 18: 366–374.
De La Torre AR, Birol I, Bousquet J, Ingvarsson PK, Jansson S, Jones SJM et al. (2014). Insights into conifer giga-genomes. Plant Physiol 166: 1724–1732.
Lam K-WG, Jeffreys AJ (2007). Processes of de novo duplication of human α-globin genes. Proc Natl Acad Sci USA 104: 10950–10955.
Latta LC, Morgan KK, Weaver CS, Allen D, Schaack S, Lynch M (2013). Genomic background and generation time influence deleterious mutation rates in Daphnia. Genetics 193: 539–5444.
Leppälä J, Bechsgaard JS, Schierup MH, Savolainen O (2008). Transmission ratio distortion in Arabidopsis lyrata: effects of population divergence and the S-locus. Heredity 100: 71–78.
Leppälä J, Bokma F, Savolainen O (2013). Investigating incipient speciation in Arabidopsis lyrata from patterns of transmission ratio distortion. Genetics 194: 697–708.
Li Y, Xiao J, Wu J, Duan J, Liu Y, Ye X et al. (2012). A tandem segmental duplication (TSD) in green revolution gene Rht-D1b region underlies plant height variation. New Phytol 196: 282–291.
Li YH, Zhou G, Ma J, Jiang W, Jin LG, Zhang Z et al. (2014). De novo assembly of soybean wild relatives for pan-genome analysis of diversity and agronomic traits. Nat Biotechnol 32: 1045–1052.
Lipinski KJ, Farslow JC, Fitzpatrick KA, Lynch M, Katju V, Bergthorsson U (2011). High spontaneous rate of gene duplication in Caenorhabditis elegans. Curr Biol 21: 306– 310.
Locke DP, Sharp AJ, McCarroll S a, McGrath SD, Newman TL, Cheng Z, et al. (2006). Linkage disequilibrium and heritability of copy-number polymorphisms within duplicated regions of the human genome. Am J Hum Genet 79: 275–290.
Lupski JR (2007). Genomic rearrangements and sporadic disease. Nat Genet 39: S43-S47.
Lynch M (2010a). Evolution of the mutation rate. Trends Genet 26: 345–352.
Lynch M (2010b). Rate, molecular spectrum, and consequences of human mutation. Proc Natl Acad Sci USA 107: 961–968.
21
Lynch M, Conery JS (2000). The evolutionary fate and consequences of duplicate genes. Science 290: 1151–1155.
Lynch M, Conery JS (2003). The evolutionary demography of duplicated genes. J Struct Funct Genomics 3: 35–44.
Lyttle TW (1991). Segregation distorters. Annu Rev Genet 25: 511–557.
Makova KD, Hardison RC (2015). The effects of chromatin organization on variation in mutation rates in the genome. Nat Rev Genet 16: 213–223.
Maron LG, Guimarães CT, Kirst M, Albert PS, Birchler JA, Bradbury PJ et al. (2013). Aluminum tolerance in maize is associated with higher MATE1 gene copy number. Proc Natl Acad Sci USA 110: 5241–5246.
Matsubara K, Ebana K, Mizubayashi T, Itoh S, Ando T, Nonoue Y et al. (2011). Relationship between transmission ratio distortion and genetic divergence in intraspecific rice crosses. Mol Genet Genomics 286: 307–319.
McCarroll S a, Hadnott TN, Perry GH, Sabeti PC, Zody MC, Barrett JC et al. (2006). Common deletion polymorphisms in the human genome. Nat Genet 38: 86–92. McHale LK, Haun WJ, Xu WW, Bhaskar PB, Anderson JE, Hyten DL et al. (2012).
Structural variants in the soybean genome localize to clusters of biotic stress-response genes. Plant Physiol 159: 1295–1308.
Merla G, Howald C, Henrichsen CN, Lyle R, Wyss C, Zabot MT et al. (2006). Submicroscopic deletion in patients with Williams-Beuren syndrome influences expression levels of the nonhemizygous flanking genes. Am J Hum Genet 79: 332– 341.
Mills RE, Walter K, Stewart C, Handsaker RE, Chen K, Alkan C et al. (2011). Mapping copy number variation by population scale genome sequencing. Nature 470: 59–65. Muñoz-Amatriaín M, Eichten SR, Wicker T, Richmond TA, Mascher M, Steuernagel B et
al. (2013). Distribution, functional impact, and origin mechanisms of copy number variation in the barley genome. Genome Biol 14: R58.
Myburg AA, Grattapaglia D, Tuskan GA, Hellsten U, Hayes RD, Grimwood J et al. (2014). The genome of Eucalyptus grandis. Nature 510: 356–362.
Namroud MC, Beaulieu J, Juge N, Laroche J, Bousquet J (2008). Scanning the genome for gene single nucleotide polymorphisms involved in adaptive population differentiation in white spruce. Mol Ecol 17: 3599–3613.
Neale DB, Wegrzyn JL, Stevens K a, Zimin A V, Puiu D, Crepeau MW et al. (2014). Decoding the massive genome of loblolly pine using haploid DNA and novel assembly strategies. Genome Biol 15: R59.
Ness RW, Morgan AD, Vasanthakrishnan RB, Colegrave N, Keightley PD (2015). Extensive de novo mutation rate variation between individuals and across the genome of Chlamydomonas reinhardtii. Genome Res 25: 1739–1749.
Neves LG, Davis JM, Barbazuk WB, Kirst M (2013). A high-density gene map of loblolly pine (Pinus taeda L.) based on exome sequence capture genotyping. G3 Genes|Genomes|Genetics 4: 29–37.
Nozawa M, Kawahara Y, Nei M (2007). Genomic drift and copy number variation of sensory receptor genes in humans. Proc Natl Acad Sci USA 104: 20421–20426.
![Figure 1.4: Underlying biological mechanisms behind transmission distortions [Figure reproduced by permission from Springer: Human Genetics, Huang et al., 2013, copyright 2012]](https://thumb-eu.123doks.com/thumbv2/123doknet/3239804.92842/23.918.140.787.108.359/underlying-biological-mechanisms-transmission-distortions-reproduced-permission-genetics.webp)