Science Arts & Métiers (SAM)
is an open access repository that collects the work of Arts et Métiers Institute of
Technology researchers and makes it freely available over the web where possible.
This is an author-deposited version published in: https://sam.ensam.eu Handle ID: .http://hdl.handle.net/10985/20171
To cite this version :
Patrick BOT, Rémi ALAS, Dimitri VOISIN, Antoine SOULIER, Caroline BRAUD, Paul MARCILLAT, Baudoin PEZERIL, François D'ARCO - CHARACTERIZATION OF A FLOW SEPARATION SENSOR ON A HYDROFOIL: THE HYDRO E-TELLTALE - In: High Performance Yacht Design, Nouvelle-Zélande, 2021-03 - HPYD - 2021
Any correspondence concerning this service should be sent to the repository Administrator : archiveouverte@ensam.eu
7th High Performance Yacht Design Conference Auckland, 11-12 March 2021
CHARACTERIZATION OF A FLOW SEPARATION SENSOR ON A
HYDROFOIL: THE HYDRO E-TELLTALE
Patrick Bot1, patrick.bot@ecole-navale.fr
Rémi Alas1, remi.alas@gmail.com
Dimitri Voisin2, dvoisin@meragitee.com
Antoine Soulier2, asoulier@meragitee.com
Caroline Braud3, caroline.braud@ec-nantes.fr
Paul Marcillat1, marcillat.eleve@ecole-navale.fr
Baudoin Pezeril1, pezeril.eleve@ecole-navale.fr
François d’Arco1
, darco2.eleve@ecole-navale.fr 1
IRENav, Ecole Navale, Naval Academy Research Institute, France 2 Mer Agitee, France
3
LHEEA Ecole Centrale de Nantes, France Abstract.
The performance of lifting bodies such as hydrofoils is determined by the flow state and particular attention should be paid to flow separation, as this greatly affects the generated lift and drag. Sailors are used to look at telltales (woolies) to trim their sails or steer their yacht. A French company developed an electronic telltale for sails based on a strain gauge activated by a silicon strand, with the appropriate signal processing to deliver the same information as a classical wool-made telltale, basically attached or separated flow. This new sensor proved useful when woolies are not visible or to deliver a signal to feed a control system, such as the autopilot for example. It was also applied to wind turbines to control the blade pitch. Mer Agitée is now developing an equivalent hydrodynamic e-Telltale to be used on hydrofoils and rudders to help trimming and controlling. The present work presents the investigation of a foil section fitted with this new sensor in a water tunnel, combining force and PIV measurements with the sensor signal, on a wide range of angle of attack. Results show that the hydro e-Telltale enables detecting the flow separation and anticipate stall, and possibly allows for detecting the boundary layer transition to turbulence. The feedback from this new sensor could be used for example in a control loop to make an “Anti-Stall System” on a rudder or a foil.
1. NOMENCLATURE
= angle of attack (°)
c = chord length (m)
CL = lift coefficient ( )
CD = drag coefficient ( )
Re=U0 c/ν = Reynolds number ( )
U0 = upstream velocity (m/s) = fluid density (kg/m3)
= fluid kinematic viscosity (m²/s)
s = profile span (m)
L = lift force (N)
D = drag force (N)
2. INTRODUCTION
On foiling yachts, dynamic trimming of the foils may be key to the flight control and some feedback on the flow state around the foils would be very helpful. Similarly on any yacht, monitoring the flow on the rudder may help anticipate and prevent stall. More generally in many cases of fluid flow over a lifting body, it is interesting to get some feedback from the flow state in order to help optimizing performance or controlling the system. On yacht sails, sailors are used to using “woollies” to detect flow separation and help trimming the sails and steering
the yacht. A limiting factor is that these common telltales are to be seen by a human who can take action according to the information from the telltale: basically whether the flow is attached or separated. The company Mer Agitée has developed an electronic telltale based on a strain gauge embedded in a silicon ribbon [1]. A basic processing of the output voltage is made to deliver a signal equivalent to a classical telltale, namely attached or separated flow, that can be transmitted to a controlling system to trigger an alarm, to automatically trim the sail, or to the autopilot for example. This aero version of the electronic telltale has been extensively characterized and investigated for the application to wind turbines [2-5], and is routinely used on yachts (IMOCA for example). More recently, Mer Agitee has developed a similar sensor for hydrodynamic applications, based also on a strain gauge fitted on a thin metal sheet, to be flush-mounted on a hydrofoil. This paper reports the investigation of this sensor, in a well-controlled water flow, with simultaneous measurements of fluid forces, fluid velocity field and e-telltale response. Some preliminary tests and settings adjustments can be found in [6].
The flow over a wing or foil is mostly attached at low incidence, with a lift coefficient almost linearly increasing with the angle of attack. At higher incidence, flow separation becomes larger, generally reducing lift,
and resulting in flow unsteadiness and varying loads related to vortex shedding. In some applications, it is interesting to monitor the flow state in real-time in order to feed a closed-loop controlling system (e.g. [7,8]). Hot-film measurements have already been used to detect transition and stall in the aeronautical sector [9], but seem difficult to be implemented on the appendages of a high-performance sailing vessel.
3. EXPERIMENTAL SET-UP
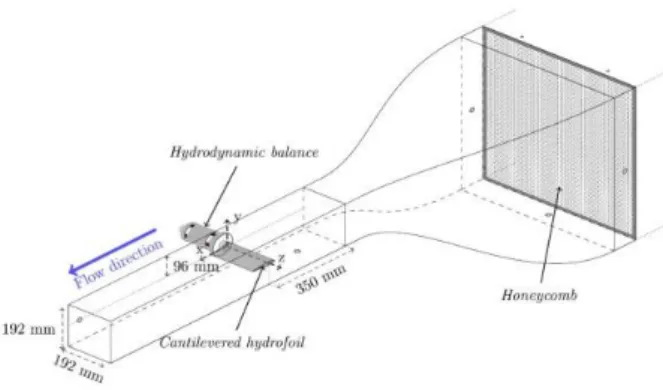
Experiments were carried out in the IRENav hydrodynamic tunnel (Fig. 1) to measure the e-telltale output, the forces and the velocity fields on a two-dimensional foil section NACA 66(mod)-312 as in [10,11]. A recess is machined in the stainless steel foil to accommodate the e-telltale and the wire to carry the voltage signal. The e-telltale is mounted flush on the suction side of the foil, positioned between x/c=0.7 and x/c=0.8 from the leading edge (Fig. 2). The sensor consists in a strain gauge fitted on a 0.05mm-thick metal sheet. The output signal is conditioned locally to a 0-5V voltage and carried by a wire through the foil support, out of the tunnel test section to the acquisition system. The sensor system and wire are covered by a resin in order to achieve a smooth surface.
Figure 1: Water tunnel test section with the hydrofoil
cantilevered on the force balance.
The test section measures 192 × 192 mm2 and is 1 m long, located downstream of honeycombs and a 1/9 contraction. The measured turbulence intensity is 1.8%. The foil model spans almost all of the channel width, except for a small gap on each end to avoid contacts with the walls that would alter force measurements. The profile is mounted at mid-height of the test section, cantilevered on a strain gauge hydrodynamic balance to measure the forces. The balance is fixed on a rotating frame mounted on bearings and driven in rotation by a stepper motor with 6 105 impulsions per revolution. The axis of rotation was located at 25% of the chord from the leading edge. The angle of attack is controlled by a home-made Labview interface with accuracy better than 0.1°. The e-telltale and balance strain gauges are controlled by an IOtech Strainbook 616 and forces are determined thanks to a previous calibration with accuracy better than 1.7N for the lift and 0.5N for the
drag. The upstream velocity U0 is 6m/s resulting in a Reynolds number Re = 5.17 105. The force coefficient uncertainties at the investigated velocity are 0.006 for CL and 0.002 for CD. The units of the e-telltale output are arbitrary and only relative variations are considered.
Figure 2: Foil section fitted with the e-telltale sensor. The
sensitive moving part is shown by the red circle. The strain gauge is glued at the root (upper end on the picture) of the moving part.
Forces and the e-telltale signal are recorded at 1 kHz, during 30 seconds when recorded without particle image velocimetry (PIV), and during 1 or 10s when time-resolved particle image velocimetry (TR-PIV) measurements are simultaneously recorded. The lift and drag coefficients are defined as:
𝐶𝐿= 𝐿 1 2 ⁄ . 𝜌 . 𝑐 . 𝑠 . 𝑈02 𝐶𝐷= 𝐷 1 2 ⁄ . 𝜌 . 𝑐 . 𝑠 . 𝑈02
Velocity field measurements are performed around the foil section using time-resolved 2D particle image velocimetry (TR-PIV). The flow is illuminated from above with a laser sheet normal to the spanwise direction and located at mid span. Two mirrors are placed below the tunnel test section to illuminate the other side of the foil, which allows for the whole velocity field around the obstacle to be measured at once. The light sheet thickness is around 2mm in the recorded flow field. The water flow is seeded with μm-sized polyamide particles and visualized by a 1280*800 pixel² speedsense 9600 camera at a sampling frequency of 1 kHz in double frame. For each value of , either 1,000 or 10,000 image pairs are recorded and processed with Dantec’s DynamicStudio™ in order to compute the snapshots of the instantaneous flow field. Raw images are pre-processed the following way: the time-averaged image is subtracted to eliminate the light flare on the section walls, and the resulting images are normalized by the time-averaged image to mitigate illumination inhomogeneity. Pre-processed image pairs are then processed with the AdaptivePIV algorithm [12]. The final interrogation window is 32 × 32 pixels² with a 50% overlap, yielding a spatial resolution of 1.75mm (0.017c), and typically 3 correlation passes are processed. Considering the whole measurement process, the measurement uncertainty on velocity is estimated to be around 1% of the free stream velocity.
4. RESULTS
4.1. Time-averaged force coefficients and e-telltale voltage
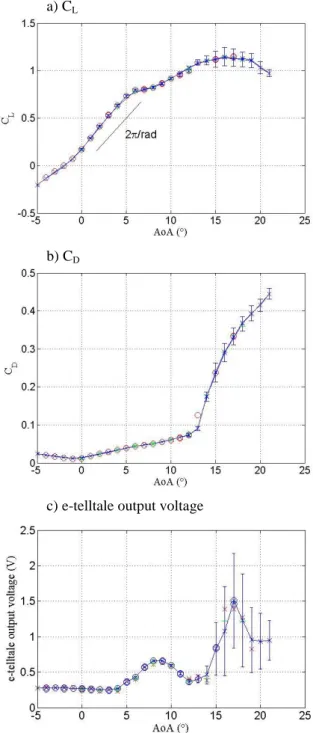
Figure 3 shows the time-averaged lift and drag coefficients and the e-telltale output voltage recorded during several runs on a wide range of angle of attack, from -4° up to 21°. The lift coefficient is increasing almost linearly with a slope slightly higher than the theoretical 2/rad from 0° to 6°. It shows a small plateau at CL≈0.8 from 6° to 8°, and increases again up to a maximum of CL≈1.15 at 17° and then smoothly decreases. A change of slope can be noticed at 13°. The zero-lift angle of attack is -2°.
The drag coefficient is minimal at -1°, increases gently almost linearly up to CD≈0.018 at 12°, and then increases much more sharply. This shape of the CL curve is characteristic of NACA 6-series foils operating at moderate Reynolds number. These results are consistent with previous findings on the same hydrofoil at a similar Reynolds number [10,11] where the transition in the boundary layers was shown to occur via a Laminar Separation Bubble. On the suction side, the transition location was found to migrate from near the trailing edge to the leading edge around 6° angle of attack, associated to a plateau in the evolution of CL between 5° and 7°. Here, this plateau is found from 6° to 8°, but the Reynold number is slightly lower (Re = 5.17 105 in the present study, Re = 7.5 105 in [10]). The elimination of the Laminar Separation Bubble on the pressure side may also contribute to the CL plateau, as explained in [10,13]. It should be noted that these studies are in the critical Reynolds number range, where the separation behaviour and related forces evolution change drastically.
The e-telltale output is minimal and almost constant around 0.27V from -5° to 4° angle of attack It then shows a bell curve between 5° and 12° with a maximum around 0.66V at 9°. Then, it increases sharply for AoA ≥ 14° up to a maximum mean value close to 1.5V at 17° before dropping again. It is noticeable that the fluctuations are very small (RMS < 3% of mean value) for angles of attack below 13°, and increase for higher angles to reach RMS ≈ 70% of mean value at 17°, in the stall regime.
4.2. Velocity fields
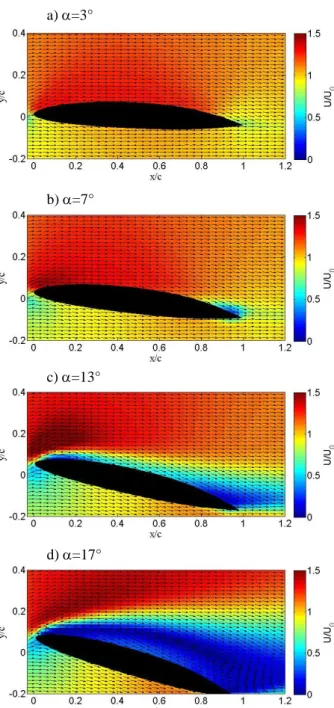
Time-averaged velocity fields around the hydrofoil are shown on Figure 4 at four characteristic values of the angle of attack. A small area of low velocity appears near the trailing edge at =7° (Fig. 4.b) and increases in size for increasing angle of attack. At 13°, another low velocity area shows up near the leading edge (Fig. 4.c), and for higher angles, the flow is fully separated right from the leading edge (Fig. 4.d). A closer inspection in the velocity vectors along the wall enables detecting flow separation where a negative tangential velocity component is visible. On the time-averaged velocity fields, the following is found: no separation for ≤ 7°;
flow separation near the trailing edge for 9° ≤ ≤ 11°; flow separation at the leading edge for ≥ 15°. Interestingly, no separation is visible at = 13°.
a) CL
b) CD
c) e-telltale output voltage
Figure 3: Time-averaged lift coefficient (a), drag coefficient
(b) and e-telltale output voltage (c) as a function of angle of attack. Errorbars show the standard deviation of fluctuations in the time series. Different symbols and colours correspond to different experimental runs.
Flow separation is also detected into the instantaneous velocity fields. As these velocity fields are nosier than the time-averaged fields, and as demonstrated by [14], detection of actual separation was retained if at least three consecutive vectors along the suction wall showed a reverse tangential velocity component, and the same criterion was used to detect flow reattachment. This
looked consistent with what would be considered separated / reattached when looking at the vector fields.
a) =3°
b) =7°
c) =13°
d) =17°
Figure 4: Time-averaged velocity field for angle of attacks 3°,
7°, 13° and 17°. All vectors are of unit length and the velocity magnitude is shown by the colormap. Only every second vector is shown for clarity.
Below 7° angle of attack, no separation is detected on any of the instantaneous velocity fields. At =7°, very rare events of flow separation are detected near the trailing edge (0.5% of the snapshots), while frequent separation is observed near the trailing edge for higher angles: 62% at =9°, and 95.8% at=11°. At =13°, the flow remains fully attached in 33.4% of the snapshots, while the flow separates near the trailing edge in 13.3%, and near the leading edge in 53.3% of the snapshots. When the flow separates at the leading edge, it either reattaches (25.1% of total snapshots), reattaches and
separates again near the trailing edge (24.5% of total) or more seldom remains fully separated (3.7% of total). Figure 5 shows an example of instantaneous velocity field where the flow separates at the leading edge, reattaches further downstream and separates again near the trailing edge.
Figure 5: Snapshot of the instantaneous velocity field for angle
of attack = 13°. All vectors are of unit length and the velocity magnitude is shown by the colourmap. This snapshot shows a separation near the leading edge, flow reattachment, then separation again near the trailing edge.
For higher angles, the flow separates in more than 99% of the snapshots, most often close to the leading edge: at x/c < 0.3 in 96% of cases for = 15° and 85% of cases for = 17°. Reattachment and subsequent separation may occur occasionally, but the flow being turbulent, the detection is not always reliable. These results are summarized in Figure 6 where the distribution of separation events along the suction side of the foil is shown for different values of angle of attack.
Figure 6: Distribution along the suction side of flow separation
for from 7° up to 17°. The vertical coordinate is the frequency of occurrence of each class, i.e. the number of snapshots where separations is detected at each location along the chord, divided by the total number of velocity snapshots (10,000).
0.5% separated 62% separated
95.8% separated 66.6% separated
4.3. E-telltale visualization
On the PIV raw images, the tip of the e-tellale can be seen, and the deformation can be estimated when it is large enough. No deformation is visible (less than 1 pixel ≈ 0.1mm) for angles of attack lower than 14°. For ≥ 14°, the metal sheet oscillates between its position at rest (flush on the surface) and the maximum deformation, as shown for example on Figure 7 at = 17°, where the maximum deformation corresponds to a maximum deflection of 3.3mm upwards.
a) t=0.919s: minimum deflection
b) t =0.950s: maximum deflection
Figure 7: Raw image from the high-speed PIV camera at = 17° at two instants showing e-telltale sensor with the minimum deflection (a) and maximum deflection (b). The minimum deflection corresponds to the position at rest with the e-telltale flush on the wall: it is the reflexion of the laser light and pixel saturation that make it erroneously appear higher than the surrounding wall.
5. DISCUSSION
From these observations, we can conclude that the hydro e-telltale effectively responds to the flow state. Indeed, the sensor is intermittently deformed and bent upward when the flow is massively separated, and the output signal is strongly oscillating with an increased mean value. Similarly to the aero version of the e-telltale [1-5], the output signal, and particularly the fluctuations intensity can be used to detect flow separation and anticipate stall.
More surprisingly, the sensor output is significantly increased in the range 5° ≤ ≤ 12° with a local maximum for = 8-9°, even if no sensor deformation is visible on the visualization images. Moreover, the flow is still attached at the location of the sensor in this range of angle of attack. As explained in Section 3 and supported by the work of Delafin et al. [10], it is speculated that
this range of corresponds to the migration of the boundary layer transition point from near the trailing edge (downstream of the sensor) to near the leading edge (upstream of the sensor). Hence, this means that the e-telltale is sensible to boundary layer transition.
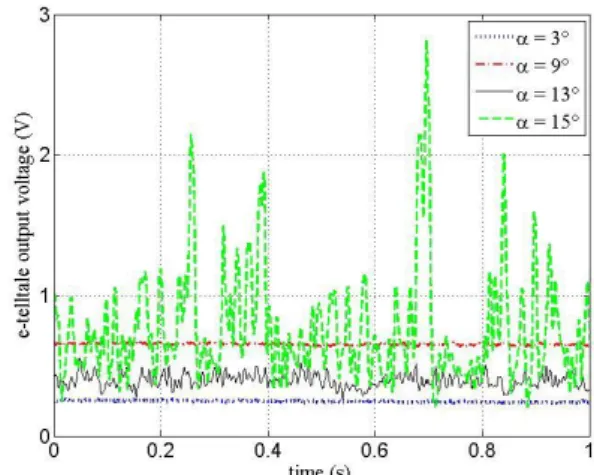
Figure 8 shows time series of the e-telltale output for four different characteristic angles of attack, 3°, 9°, 13° and 15°. When the flow is attached, fluctuations are very small, even at 9° where the sensor response is at a local maximum (see Figure 3.c). At 15°, fluctuations are huge with very strong events associated to the dynamic vortex shedding due to flow separation upstream of the sensor. In the intermediate situation of = 13° where separation intermittently occurs at the leading edge or the trailing edge, fluctuations become significant but the mean value remains smaller than at = 9°. Then, it seems that the turbulent nature of the boundary layer over the sensor results in an increased output value compared to the laminar boundary layer, but with no significant fluctuations, whereas flow separation –particularly ahead of the sensor– gives rise to violent fluctuations of the output. This signal could be used as a real-time feedback on the flow state which could be very useful in the perspective of closed-loop flow control. In Fig. 8, the typical time scale of fluctuations seems to be of order 20ms, which is 1.2 c/U. At full scale for a speed of 30 knots and a chord length of 0.5m, this corresponds to a typical time scale of order 40ms. This would probably be too short to enable human reaction, but a real-time signal about the system state would anyway be useful for a closed-loop controlling system, based for example on a reduced-order model. Further work is underway to better characterize the dynamic response of the sensor and relate it to the dynamics of the flow such as shedding events.
Figure 8: Time series of the e-telltale output voltage for = 3°, 9° and 15°.
6. CONCLUSIONS
A new flow sensor inspired by telltales has been built and was used on a hydrofoil to detect the flow regime. It
Sensitive part of e-telltale
Sensitive part of e-telltale
is the hydro equivalent of the e-telltale developed by Mer Agitee for aero applications and already in use on yacht sails (the IMOCA-Class yacht SMA for example). The hydro e-telltale has been mounted on a hydrofoil model and tested in a water tunnel with force measurements and flow visualisation. The sensor response clearly shows the occurrence of flow separation and can be used to anticipate stall. A prototype has been fitted on an IMOCA-class yacht rudder and the feasibility to record useful information while sailing has been demonstrated, even if no specific testing campaign is available yet. We believe that this signal may be useful to estimate the loading on a rudder or a foil to avoid over-loading and risk of stall. This is a successful extension of the TrimControl concept [1] to hydrofoils and rudders. Moreover, the output signal may prove useful as a real-time feedback to help dynamic control of foils or rudders.
Acknowledgements
The authors are grateful to the IRENav technical staff (SCEFER) for their help in the experimental work, and to Tristan Thibaut for his participation in preliminary tests.
References
1. Patent claim : FRA N°07.06196, EUR N° 08 851 441.9, US N° 12/675 565, The wireless system fitted with the TrimControl App is commercialized by Mer Agitee (https://www.meragitee.com/trimcontrol). 2. Soulier, A., Braud, C., Voisin, D., and Podvin, B.,
2020, “Ability of the e-TellTale sensor to detect flow features over wind turbine blades: flow stall/reattachment dynamics”, Wind Energ. Sci. Discuss., https://doi.org/10.5194/wes-2020-13, in review.
3. Soulier, A., Voisin, D., Danbon, F., Braud, C., 2019, “Electronic TellTale (E - penon) sensor to detect flow separation on wind turbine blades”. Wind Energy Science Conference, Jun 2019, Cork, Ireland. ⟨hal-02888568⟩
4. Soulier, A., Braud, C., Voisin, D., Danbon, F., Jaunet, V., 2018, “Electronic Tell-Tale, a sensor to detect flow separation on wind turbine blades”. SMARTEOLE colloquium, Aug 2018, Orléans, France. ⟨hal-02888598⟩
5. Soulier, A., 2020, « Caractérisation du fonctionnement aérodynamique du e-Penon, capteur de décollement pour les pales d’éoliennes ». Milieux fluides et réactifs. PhD, Ecole Centrale Nantes, Français. ⟨hal-02572664⟩
6. Thibault, T., 2020, The “e-Telltale”: characterization of an electronic sensor to detect flow phenomena, IRENav, Ecole Navale, MSc project.
7. Shaqarin, T., Braud, C., Coudert, S., Stanislas, M., 2013, “Open and closed-loop experiments to identify
the separated flow dynamics of a thick turbulent boundary layer. Exp. Fluids 54, 1448
8. Becker, R., King, R., Petz, R., Nitsche, W., 2007. Adaptive closed-loop separation control on a high-lift configuration using extremum seeking. AIAA J. 45 (6), 1382–1392.
9. F. Feyzi, M. Kornberger, N. Rachor and B. Ilk, 1989, Development of two multisensor hot-film measuring techniques for free-flight experiments, International Congress on Instrumentation in Aerospace Simulation Facilities, Göttingen, West
Germany, pp. 443-449, doi:
10.1109/ICIASF.1989.77699
10. Delafin, P.L., Deniset, F., Astolfi, J.A., 2014, “Effect of the laminar separation bubble induced transition on the hydrodynamic performance of a hydrofoil”, Eur. J. Mech. B/Fluids, 46, pp. 190-200, DOI: 10.1016/j.euromechflu.2014.03.013
11. A. Ducoin, J. Astolfi, M. Gobert, 2012, An experimental study of boundary-layer transition induced vibrations on a hydrofoil, J. Fluids Struct. 32 (0), 37–51
12. DynamicStudio user’s manual, Dantec.
13. Timmer, W., 2008, “Two-dimensional low-Reynolds number wind tunnel results for airfoil NACA0018, Wind Eng., 32(6), pp. 525-537, DOI: 10.1260/030952408787548848
14. De Gregorio, F. Albano, F. and Lupo, M., 2007, Flow separation investigation by PIV technique. In 7th International Symposium on Particle Image Velocimetry, Rome, Italy