Science Arts & Métiers (SAM)
is an open access repository that collects the work of Arts et Métiers Institute of
Technology researchers and makes it freely available over the web where possible.
This is an author-deposited version published in: https://sam.ensam.eu Handle ID: .http://hdl.handle.net/10985/15092
To cite this version :
Nicolas AUBIN, Ulisse DHOME, Benoit AUGIER, Patrick BOT, Frédéric HAUVILLE - How to be the best at sail pumping? - In: How to be the best at sail pumping?, France, 2016-06 - Sports Physics - Ecole Polytechnique - 2016
How to be the best at sail pumping?
Nicolas Aubin1, Ulysse Dhomé1, Benoit Augier1, Patrick Bot1, Frédéric Hauville1
1 M2EN, Naval Academy Research Institute - IRENav, Ecole Navale, France, [email protected]
INTRODUCTION
Pumping or flicking1 is often used by sailors to get extra propulsion while sailing (subject to restrictions by the racing rules2). Common unsteady sailing situations, due to crew action (e.g. manoeuver like gybing3) or environment conditions (e.g. pitching in waves4, 5) can be reproduced in tunnel testing with accurate flow and yacht attitude4 control. Repeated pumping generating unsteady effects on aerodynamic forces6 is investigated here with a dynamic trimming system. Results are presented for different apparent wind angles (AWA) to determine the best pumping conditions and better understand the physical mechanisms involved.
EXPERIMENTAL METHODS
General apparatus and force recording
Experiments were carried out in the Twisted Flow Wind Tunnel of the Yacht Research Unit, University of Auckland7. Three 1/13th scale IMOCA mainsails with different camber were tested on a 2.1m high cantilevered carbon fibre mast. The standard mainsail (MS std) corresponds to the design shape of the actual full-scale sail. The flat mainsail (MS flat) corresponds to a design shape without camber and the maximum camber mainsail (MSmax) corresponds to a design shape with a greater camber than the standard mainsail. The apparent wind angle (AWA) is defined as the angle between the boat model centreline and the wind tunnel flow direction as shown in Fig. 1. The thrust force was first optimized in steady situation for different AWA as a function of two parameters of the sail trim: sheet length and sheet car position8. Dynamic oscillations of the sheet length with different amplitude 𝐴 and frequency 𝑓 were then investigated6 around this
optimum. Aerodynamic forces 𝐹𝑥, 𝐹𝑦, loads in the sail
sheet 𝐹𝑠ℎ𝑒𝑒𝑡 and onset flow dynamic pressure 𝑞 were
recorded at 200Hz to compute instantaneous aerodynamic coefficient 𝐶𝐹𝑖(𝑡) = 𝐹𝑖(𝑡)/(𝑞̅𝑆) with
𝑆 = 0.959m² the sail area. The sheet length 𝐿𝑠ℎ𝑒𝑒𝑡 is
determined using the angle of the rotating plate driving the oscillations.
Figure 1: On left, geometry of dynamic trimming system, on right photograph of standard mainsail in the wind tunnel.
Forces and videos presented in the next section are synchronized.
Rig tracking
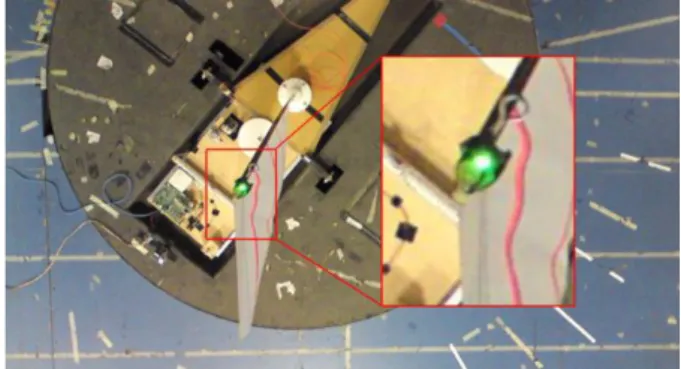
For numerical experimental comparison the trajectory of different rig elements can be used9,10. In this experimental campaign several cameras are used to record the boom end, the mast head position as shown in Fig. 2 and the flying shape through the Vspars11 system. An appropriate tracking algorithm has been developed12 in order to compute the trajectory of the mast head.
Figure 2: Mast head rig tracking. Magnification represents the LED green target on the top of the mast to be detected12.
The reduced frequency 𝑓𝑟= 𝑓𝑐/𝑈∞ compares the
convection time along a representative chord 𝑐 = 𝑆/ℎ using ℎ = 2.02m the luff length, the reference flow velocity 𝑈∞= 3.5m/s and the forcing period 1/𝑓. As
the same behaviour was observed for all values of the sheet length oscillation amplitude tested (A=10mm, 20mm and 30mm), results are presented for A=20mm only for AWA=60°. For AWA=40° only A=10mm could be tested.
RESULTS AND DISCUSSION
Reduced frequency effect on mean value
An indicator of the yacht performance can be described by the optimization target function: 𝐶̅̅̅̅̅̅̅=𝐶𝐹𝑜𝑏𝑗 ̅̅̅̅̅ −𝐹𝑥
0.1|𝐶̅̅̅̅̅̅̅𝐹𝑦| corresponding to a linear combination of drive
and side force8. The 𝐶̅̅̅̅̅̅̅ target function is a way to 𝐹𝑜𝑏𝑗
take into account the penalisation due to the heeling moment generated by 𝐶̅̅̅̅̅. 𝐹𝑦
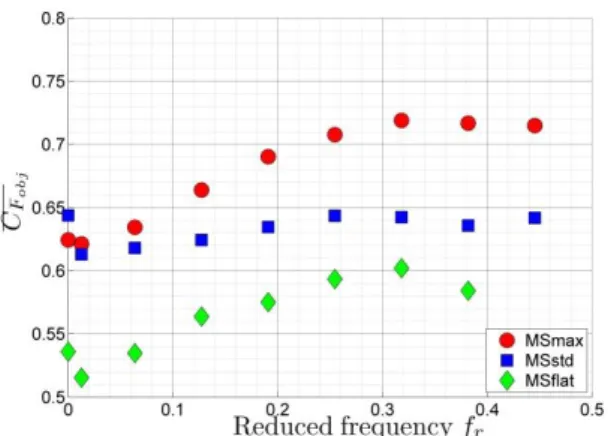
For dynamic trimming the mean value of this optimization target function, averaged on an entire number of oscillating period, can be plotted as a function of the reduced frequency for a given mainsail design shape and oscillation amplitude. From previous studies6, results show that there is an optimum reduced frequency of 𝑓𝑟= 0.25 where the maximum
For the lowest reduced frequency tested, for each mainsail the optimization target function is lower than the optimum static cases (𝑓𝑟= 0). In this case the sail
does not stay in an optimal configuration and does not benefit from any change from the dynamic aspects. When increasing the reduced frequency, the performance starts to increase and reaches a higher level than the static situation.This is due to the fact that the dynamic motion of the sail affects the wake vortices structure. Flow visualization was not performed here but parallel studies on flicking1 with close sail motion were tested on water tank configuration and indicate a change in the wake vortices intensity when the sail is moving. Such oscillations are known to create propulsion13 in particular conditions.
Figure 3: Evolution of mean value of the optimization function with the reduced frequency for different mainsails6, 𝐀𝐖𝐀 = 𝟔𝟎°, A=20mm.
The flat mainsail design suffering of an initial low static performance benefits relatively more from the dynamic trimming than the two other ones.
Fig. 4 shows the evolution for another apparent wind angle. Once again, an optimum frequency can be identified for a slightly higher reduced frequency (𝑓𝑟= 0.32) for the flat and maximum camber mainsail.
The standard mainsail does not benefit from the dynamic trimming in this configuration.
Figure 4: Evolution of the mean value of the optimization function with the reduced frequency for the different mainsails. 𝐀𝐖𝐀 = 𝟒𝟎°, A=10mm.
Tab. 1 indicates the corresponding pumping period associated to the optimum target function for an apparent wind angle of 60° for different real boats at
full scale. Even though several real-life complications are not considered here (e.g. roll), these results are consistent with common sailors’ knowledge and practise.
Yacht type Sail area (m²) 𝑇(s) 𝐴(m) Windsurf RSX 9.5 1.45 0.16 Laser 5.76 0.96 0.11 Nacra 17 16.25 1.42 0.16 J80 20 1.67 0.18 Class 40 72 2.89 0.32 IMOCA 60 175 4.76 0.53 Super yacht Comanche 410 6.79 0.75
Table 1: Extrapolated full-scale trimming period 𝑻 for 𝐀𝐖𝐀 = 𝟔𝟎°. The indicated amplitudes 𝑨 correspond to 𝑨 = 𝟐𝟎𝐦𝐦 tested here on the model, scaled up to each full-scale yacht.
To better understand the beneficial effect of dynamic trimming, the dynamic behaviour of forces and rig motion are investigated here. The dynamic evolution on the time series signal is first presented. The mast head trajectory and the value of the optimization target function are then shown.
Reduced frequency effect on force time series
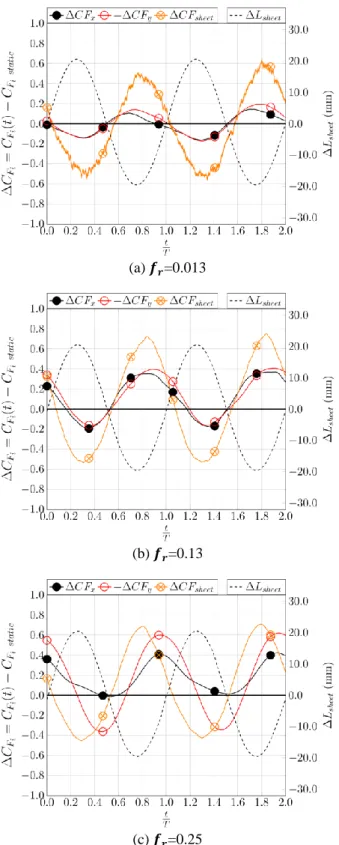
The time series for every dynamic condition are illustrated on two representative oscillations. From Fig. 5(a) to Fig. 5(c) the force coefficient time series is presented in the situation of AWA = 60° and 𝐴 = 20mm for the maximum camber mainsail. The drive force coefficient evolution compared to its mean value on the optimum static situation ∆𝐶𝐹𝑥= 𝐶𝐹𝑥(𝑡) −
𝐶𝐹𝑥 𝑠𝑡𝑎𝑡𝑖𝑐 is plotted against the non-dimensional time 𝑡 𝑇
with 𝑇 the forcing period. The opposite of the side force coefficient and the sheet force coefficient are represented the same way. The relative sheet length compared to the static trim length ∆𝐿𝑠ℎ𝑒𝑒𝑡 =
𝐿𝑠ℎ𝑒𝑒𝑡(𝑡) − 𝐿𝑠ℎ𝑒𝑒𝑡 𝑠𝑡𝑎𝑡𝑖𝑐 is plotted as well with a reading
on the right axis.
Fig. 5 (a) shows that for a low reduced frequency close to a quasi-static state, the maximum driving force occurs once the sail is over-trimmed (shorter sheet length) as expected and the opposite of the side force coefficient evolution follows the same trend.
When the reduced frequency increases, two phenomena can be observed. The first one corresponds to a phase shift between the sheet length evolution and force coefficient signals. This may imply energy exchange in the system between the sheet trimming device, the rig and sail aero- elastic system and the flow. Secondly, the maximum value of drive force coefficient increases and its variations are shifting to positive values, corresponding to a higher mean driving force than in the static situation, up to a maximum at 𝑓𝑟= 0.25 as shown
(a) 𝒇𝒓=0.013
(b) 𝒇𝒓=0.13
(c) 𝒇𝒓=0.25
Figure 5: Variations of drive, opposite of side and sheet force coefficients (left axis) and variation of the sheet length (right axis). 𝐀𝐖𝐀 = 𝟔𝟎°, 𝑨 = 𝟐𝟎𝐦𝐦, maximum camber mainsail.
For higher reduced frequencies (not shown here) the drive force coefficient is still greater than in the static situation but its mean value decreases compared to 𝑓𝑟= 0.25. For the higher frequencies, the side force
coefficient variation becomes more important than the drive force coefficient variation. The side force coefficient is also affected by a strong phase shift compared to the sheet length signal.
These evolutions can be associated to flow phenomena where the oscillating sail may generate different wake patterns. Moreover, strong structural oscillations are observed during the experiments and might play a role in the forces evolution. The next section presents results on the mast head trajectory in order to estimate if inertia plays a non-negligible role on forces evolution.
Reduced frequency effect on mast head trajectory
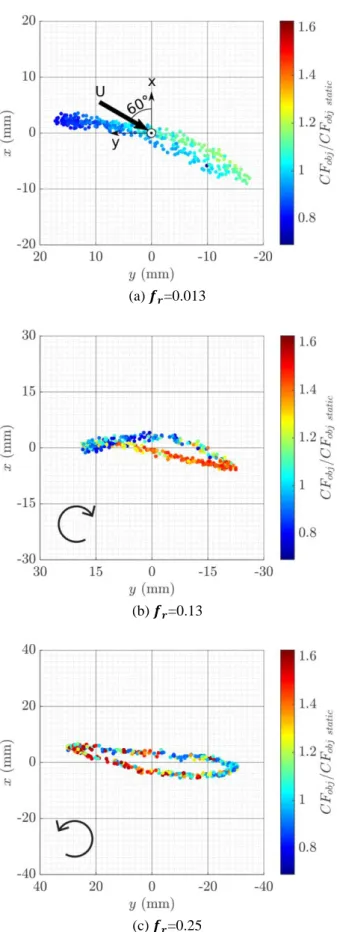
Figures 6(a) to 6(c) represent the mast head trajectory for AWA = 60° and 𝐴 = 20mm for the mainsail with the maximum camber. The ratio of the instantaneous optimization target function over the static optimization target function is plotted in colour on the mast head trajectory. For a low reduced frequency (Fig. 6(a)) the maximum optimization target function occurs close to the static optimum position (𝑥 = 0𝑚𝑚, 𝑦 = 0𝑚𝑚). For a higher reduced frequency, loop trajectories appear with either a figure eight or an elliptical shape as shown on Figs. 6(b) and 6(c). On Fig. 6(c) for 𝑓𝑟= 0.25, the
maximum value of the optimization target function occurs when the mast head is moved to the front (𝑥 > 0) and windward (𝑦 > 0) mainly due to the phase shift of the drive force compared to the sheet length signal. Note that the rotation direction of the mast head trajectory is also changing with the reduced frequency. For the highest tested frequencies the camera frame rate is not high enough to accurately track the mast head position.
The reduced frequency 𝑓𝑟= 0.25 corresponds to the
maximum mean value of 𝐶̅̅̅̅̅̅̅ as demonstrated in the 𝐹𝑜𝑏𝑗
previous section. Looking at the effects on forces from inertia of the structure, we notice that accelerations in the y direction are one order of magnitude higher than in the x direction, as deduced from the mast head trajectories. As forces oscillations are the same order of magnitude in both directions, one may conclude that the evolution of the measured forces is not dominated by simple inertia effects and should then be driven mostly by the fluid flow or more subtle fluid structure interaction phenomena.
(a) 𝒇𝒓=0.013
(b) 𝒇𝒓=0.13
(c) 𝒇𝒓=0.25
Figure 6: Mast head trajectory (above view also called “bird’s eye view”), 𝐀𝐖𝐀 = 𝟔𝟎°, 𝑨 = 𝟐𝟎𝐦𝐦, maximum camber mainsail. The colorbar represents the ratio of the instantaneous optimization target function over the optimization target function in static trim. x=y=0mm represents the static equilibrium position with no periodic forcing. The thick arrow on Fig. 6(a) shows the Apparent Wind Direction.
CONCLUSION
This study presents an innovative experiment of dynamic trimming known as pumping in a wind tunnel. Results show that a significant increase in yacht performance can be obtained by pumping compared to the static case. The maximum gain in the model-scale experiment is measured at an Apparent Wind Angle AWA=60° and ranges from 20 up to 40% depending on the sail design shape. The optimal reduced frequency 𝑓𝑟
is found around 0.25 at AWA=60° and around 0.32 at AWA=40°. When scaled up to real yachts, this reduced frequency corresponds to a realistic pumping oscillation period from around 1s for a dinghy up to around 7s for a super yacht.
A closer analysis of forces evolution with the sheet length oscillation for the different tested frequencies allows for a better understanding of this behaviour, highlighting phase shifts and offsets in forces evolutions. An estimation of accelerations indicates that the behaviour of measured forces cannot be explained by the structure inertia alone and that other fluid structure interaction phenomena may play a significant role. It is likely that the horizontal wake structure is modified by pumping, as shown by Schutt et al. 1 in a rather similar situation.
The rig tracking analysis enables to display the forces evolution along the mast head trajectory and shows that the dynamic response of this aero-elastic system deviates from a quasi-steady behaviour. As an extension of this work, the same technique could be used to compute the boom end trajectory and use the sheet load signal in order to compute the mechanical work exchanged between the trimming system and the rig. This mechanical work is interesting as it corresponds to the energy required for pumping. Computations with different Fluid Structure Interaction models will also be performed to be compared to these experimental results.
REFERENCES
1. Schutt R.R. et al., The 22nd Chesapeake Sailing Yacht Symposium. :58-72, 2016 2. Isaf, 2013-2016 Racing rules of sailing, 2013 3. Banks J. et al., 8th Conference of the
International Sports Engineering Association : 2511-2516, 2010
4. Fossati F. et al., J. Sailboat Technology. 2:1-41, 2011
5. Augier B. et al., Sports Physics :66-78, 2013 6. Aubin N. et al., The 22nd Chesapeake Sailing
Yacht Symposium. :111-121, 2016
7. Flay R.G.J, J. Wind Engineering and Industrial Aeronautics 63:171-182, 1996
8. Sacher M. et al., The 22nd Chesapeake Sailing Yacht Symposium. :36-48, 2016
9. Augier B., PhD thesis, Études expérimentales de l’interaction fluide-structure sur surface souple: application aux voiles de bateaux,
Université de Bretagne Occidentale :199-225, 2012
10. Durand M., PhD thesis, Interaction fluide-structure souple et légère, applications aux voiliers, École Centrale de Nantes, 2012 11. Le Pelley D.J. et al., The 3rd High
Performance Yacht Design Conference: 57-66, 2008
12. Dhomé U., Internship report, École polytechnique : 2016
13. Schnipper T. et al., Journal of Fluid Mechanics 633 :411-423,2009
ACKNOWLEDGMENTS
The authors are grateful to Incidence sails for providing model scale sails. The authors acknowledge support from the European Union’s Seventh Programme for research, technological development and demonstration under grant agreement N° PIRSES-GA-2012--318924 (Sailing fluids, see www.sailingfluids.org) and from the Royal Society of New Zealand. This work was supported by the French Naval Academy, Brest Métropole Océane. This work was supported by the "Laboratoire d'Excellence" LabexMER (ANR-10-LABX-19) and co-funded by a grant from the French government under the program "Investissements d'Avenir".