Science Arts & Métiers (SAM)
is an open access repository that collects the work of Arts et Métiers Institute of
Technology researchers and makes it freely available over the web where possible.
This is an author-deposited version published in:
https://sam.ensam.eu
Handle ID: .
http://hdl.handle.net/10985/9714
To cite this version :
Livio DE LUCA, Chawee BUSAYARAT, Chiara STEFANI, Philippe VERON, M FLORENZANO - A
Web Information System for the Semantic-Based Analysis of Architectural Heritage - In:
International Archives of Photogrammetry, Remote Sensing and Spatial Information Sciences,
Italie, 2011 - Proceedings of 3D-ARCH - 2011
Any correspondence concerning this service should be sent to the repository
Administrator :
[email protected]
A WEB INFORMATION SYSTEM FOR THE SEMANTIC-BASED ANALYSIS OF
ARCHITECTURAL HERITAGE
L. De Luca a, C. Bussayarat a, C. Stefani a, P. Véron b, M. Florenzano a
a MAP-Gamsau Laboratory (CNRS/MCC), Ecole Nationale Supérieure d’Architecture de Marseille
(ldl, cbu, cst)@gamsau.archi.fr
b LSIS Laboratory, UMR CNRS 6168, Arts et Métiers ParisTech, Aix-en-Provence, France
Commission V, WGIV
KEY WORDS: Architectural heritage, semantic description, multi-representation, information system, internet ABSTRACT:
This article focuses on the fields of architectural documentation and digital representation. It concerns the development of an information system at the scale of architecture, taking into account the relationships that can be established between the representation of buildings (shape, dimension, state of conservation, hypothetical restitution) and heterogeneous information about various fields (such as the technical, the documentary or still the historical one). The proposed approach aims to organize multiple representations (and associated information) around a semantic description model with the goal of defining a web information system for the multi-field analysis of heritage buildings.
1. INTRODUCTION 1.1 3D digitizing of architectural heritage
In recent years, the field of architectural surveying and representation took advantage from the use of the third dimension in the graphic documentation about cultural heritage. Various tools and emerging technologies (Boehler et al., 2002 ; Debevec et al., 1996) have been integrated into approaches for the 3D reconstruction of buildings in order to reproduce the morphological complexity of heritage buildings and to support different analysis requirements (Marbs et al., 2001).
These reconstruction strategies permit both to collect and organize information issue from architectural survey and to produce multiple representations of buildings. To date various reconstruction methods have been developed. Firstly, some approaches are inclined to represent the geometric accuracy of 3D models: they mainly base on the standard methods of automatic meshing starting from 3D laser scanning. Secondly, other approaches are based on descriptions that are specific to particular kinds of analysis: they are characterized by data acquisition and data processing strategies consistent with specific representation goals. Thirdly, other techniques focus on reproducing the visual appearance of the surfaces forming the object, by taking into account photometric information. Finally, other approaches concentrate on the simultaneous representation of multiple factors at multiple scales: for this goal, they use different technical procedures in a complementary way (El-Hakim et al. 2003; Guidi et al., 2009).
However, beyond three-dimensional data, a large amount of heterogeneous data is collected during the analysis of buildings. Moreover all this data often comes from different branches and relies on different media. Various studies are carried out on heritage buildings for a variety of purposes including analysis of documentary sources, building maintenance and monitoring, formulation of assumptions and cultural diffusion. In addition to architectural survey, the development of qualitative descriptions of buildings is a larger research area. For this reason, today it seems essential to examine how quantitative information (extracted from survey) and qualitative information (produced
by interpretation of data acquired during the analysis of documentary sources), can be analyzed and displayed within a unique integrated platform.
1.2 Related works
The scientific analysis of documentary resources has benefited informatics solutions about how to organize and manage data. Many solutions have been developed in order to improve the management of digital contents using a formal structure for describing implicit and explicit concepts and relationships used in cultural heritage documentation (Doerr, 2002).
If many works focused on the semantic characterization of generic 3D shapes (Attene, 2009), very few works seem to deal with integrating heterogeneous data in a display device referring to the building morphology (Manfredini et al. 2008). In this area, researches focus on how heterogeneous data is linked to the building morphology or to its graphic representation. In the panorama of published studies, some systems associate information to the entire building (Herbig, 1997), other ones associate information to entities belonging to a 2D representation (Salonia et al. 2000) or to a 3D representation (Knuyts et al., 2001 ; Havemann et al., 2008) and finally other systems organize information according to a model description (Dudek et al. 2003). However, if the goal is, starting from architectural survey, to establish a link between the phases of description, analysis and documentation of buildings, several problems should be taken into account.
The first problem concerns the need to manage information collected about measurement, analysis and interpretation of building shapes. Systems organizing information around a single representation limit the consultation of building current states to a single analysis support such as plans, cross sections and orthophotos (in a two-dimensional plane) or triangles (in 3D models). In this sense, it is important to stress the difference between building representations deriving from data acquisition and representations obtained from data interpretation. The second problem concerns the possibility of making available to various users (scientists, administrators, public, etc.) collected data and information. To this end, an important requirement is
to express the various ‘‘viewpoints’’ of the disciplines involved in the study, preservation and enhancement of buildings. As a result of a wide range of analysis, it is required to manage multiple consulting modes, each one based both on a specific strategy for organizing data and on a specific representation system. However, systems structuring information around a building description model are effective just for one kind of analysis at a time. Actually, concepts organized for describing building shapes can just express the needs of a single disciplinary area. The third problem deals with the access to collected information. It is necessary to consider technical solutions to share both acquired data and produced analysis. This requires, on one hand, to structure information according to different user profiles, and on the other hand, to build a specific documentation for each type of analysis. In this sense, the system should be adapted to collecting and organizing specific and a priori unstructured information.
2. GENERAL APPROACH
Organizing the graphical documentation according to the building morphology requires integrating a purely geometric level to a semantic representation one. Actually, the concept of shape encompasses all instances of the object. Instances can be represented in a digital environment, independently from their format, use or size, considering that their geometrical nature is characterized by their spatial extension (Falcidieno et al. 1998). Architectural objects have a shape (spatial extension), they can be described by structures (entity collections and part–whole relationship), they have quality attributes (colors, textures, terms, etc.) and they always have an interaction with time; finally various kinds of sources can describe their aspects. Our approach discusses three main issues :
• Producing and managing multiple representations of buildings according to different analysis needs (see Section 2.1).
• Establishing links between the 3D morphology of buildings and the collection of 2D iconographic sources used for their study (see Section 2.2). • Analyzing and representing building transformations
over time (see Section 2.3).
Our approach is based on the idea that digital models can be considered as the interface of preferential access to various kinds of cultural heritage data: firstly, the ones related to the building current state, secondly, the ones related to its geometry interpretation and finally, the ones concerning to the formulation of assumptions on its past states.
2.1 Semantic description
Our platform uses a semantic description model as a common denominator between the possible representations of buildings and the related information. We build a description model defined by three distinct levels concerning the building morphology: the semantic, the structure and the representation one. An article details the used formalism (De Luca et al., 2007): the semantic level allows concepts (description terms) to be isolated and parts of the shape to be associated. The structural level provides for the establishment of relation graphs among these concepts in order to organize the elements of the scene according to a specific description need. The representation level allows one or more geometric representations to be associated to each isolated concept. Temporal dimension is joined to these three levels of the
description. Temporal notion allows descriptive entities to be enriched with the concept of transformation (see Section 2.3). Semantic level
The building description starts with a morphological decomposition consisting of organizing the elements of the scene in a compartment structure in which geometry is associated to each unitary concept. As knowledge involved in the semantic structuring of the building morphology is always in relation with the goal of the analysis, the description phase can start at different levels of the decomposition according to the size of entities composing the architectural complex: the body of the building (e.g. towers, curtains, etc.) or architectural elements (e.g. walls, roofs, windows, etc.).
Structural level
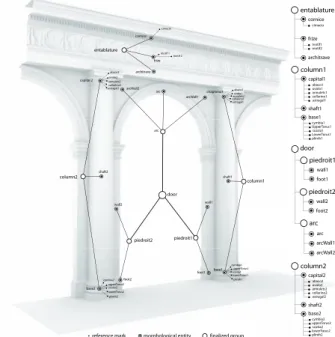
To support the phase of semantic description of the building morphology, the part–whole relations established between single elements are represented in the 3D space in a symbolic way. Representation is inspired by the structural approach introduced by (Heine, 1999). It is about a 3D graph (a tree graph in space) whose configuration depends on the manipulation (hierarchical relations) of a set of terms belonging to a list. Graphs are built using conceptual entities that have been specifically defined (Fig. 1): the morphological entity, the finalized group and the reference mark.
column1 column2 piedroit2 piedroit1 entablature base2 base1 foot2 foot1 wall2 wall1 architrave frize cornice capital 2 chapiteau1 arcWall1 arcWall2 arc door shaft2 shaft1 abaco1 ovolo1 annulets1 collarino1 astragal1 cymbia1 upperTorus1 scotia1 lowerTorus1 plinth1 motif 2 motif 1 column1 capital1 shaft1 base1 door piedroit1 wall1 foot1 cymbia1 UpperTorus1 scozia1 LowerTorus1 plinth1 abaco1 ovolo1 annulets1 collarino1 astragal1 abaco2 ovolo2 annulets2 collarino2 astragal2 cymbia2 upperTorus2 scotia2 lowerTorus2 plinth2 arc cimacio column2 capital2 shaft2 base2 cymbia2 upperTorus2 scotia2 lowerTorus2 plinth2 abaco2 ovolo2 annulets2 collarino2 astragal2 piedroit2 wall2 foot2 arc arc arcWall1 arcWall2 entablature cornice frize architrave cimacio motif1 motif2 finalized group morphological entity reference mark
Figure 1. Semantic description of the building morphology composed by a three-level graph: finalized groups, morphological entities and reference marks. A morphological entity resulting from a morphological structuring is a concept, identified by the user for the building description, which can be joined with one or more geometrical representations.
A finalized group is a node that includes morphological features and that does not have its own geometric representation. In fact, its spatial extension is due to the union of the envelopes encompassing the entities belonging to it.
A reference mark indicates a particular aspect within an entity. For example, moldings or particular aspects on the entity
surface (historical figures of a bas-relief, a physical degradation, etc.) can be considered as reference marks.
Representation level
To support the variety of representation techniques available today, the storage of representations has been structured according to three geometric bases.
Point-based representations: this category uses point clouds, if
necessary enriched with color attributes. This kind of representation can contain rough data issued from a laser scanning or a photogram- metric restitution. It is the ideal support for measurement, because it is characterized by faithful representations of data acquired during the survey, without any approximation or interpretation.
Curve-based representations: representations laying on this
basis can contain geometric information extracted during the shape analysis step (to name but a few, significant profiles, area boundaries, etc.) or parametric curves of the reconstructed sur- faces. Moreover, they are an efficient support for the structuring of dimensional information.
Polygon-based representations: these representations permit the
expression of volume and they can enrich it with information reproducing the visual appearance of surfaces. They give important information for the photorealistic rendering of buildings or for estimating the preservation of building materials.
Points of view on the building
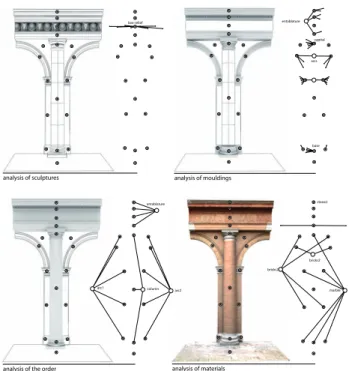
The three-level description (concerning semantic, structure and representation), combined with the possibility of classifying entities by means of vocabulary terms, allows the construction of what we call ‘‘views’’ on the building (Fig. 2).
analysis of sculptures analysis of mouldings
analysis of the order analysis of materials
arc1 arc2 column entablature marble bricks2 bricks2 stone2 arcs entablature capital base low-relief
Figure 2. Four ‘‘points of view’’ on the building morphology composed by three parallel levels of description: semantic, structure and representation. Top-left: analysis of sculptures; top-right: analysis of profiled elements; bottom-left: analysis of the architectural order and bottom-right: analysis of materials.
Logic behind this system is based on the need to decline any description structuring in order to allow a real freedom in organizing data.
Three aspects depend on the kind of observation on the building morphology: firstly, the choice of representation kinds, secondly, the structuring strategy of entities and thirdly, the choice of terms qualifying them.
2.2 Spatial referencing of iconographic sources
In order to establish links between the 3D representation of the morphology and the 2D iconographic sources concerning its history, we use the spatial referencing of images. This principle is based on the definition of projective relations between iconographic sources and the 3D model of the current state of the building. Several types of iconographic sources are taken into account (photographs of current and historical states, drawings or paintings in perspective, technical drawings at different scales, etc.
Regarding photographs, we use a spatial resection procedure (Hartley et al., 2004) to establish a set of correspondences between each picture (2D coordinates) and the 3D model of the current state (3D coordinates). In the case of spatial referencing of historical photographs (representing the building in a state that is different from the current one already restituted in 3D), the spatial resection of the camera poses two problems. Firstly, information acquired during the shooting time is often unknown (focal length and distortion) and the image size sometimes is modified. Secondly, the current state of the building (resulting from a 3D scanning) and the past one described by historical sources are often very different. This divergence can make a proper distribution of 2D and 3D correspondences more difficult. On the basis of these constraints, we calculate the spatial resection by simultaneous estimation of intrinsic and extrinsic camera parameters (Tsai, 1986) through the selection of a set of 2D/3D correspondences.
In all cases described above, spatial resection lies in associating, to each iconographic source, information on the camera geometric model at shooting time: the translation and orientation of the camera, and the focal length and distortion of the objective. In the case of iconographic sources based on the use of manual techniques (drawings, paintings, engravings, etc.) we use a manual spatial referencing based on a procedure consisting in an interactive superposition of a 3D scene viewpoint (in cylindrical or perspective projection) on the iconographic source used as the image plane.
Semantic annotation of iconography
In contrast with various works in this field, our approach on semantic annotation of images does not lean on the direct relation between semantic concepts and specific areas of the image. We use semantized 3D representations of building morphology (see Section 2.1) as a support between these two kinds of information. The relation between 3D models and 2D images is created by means of procedures for the spatial referencing of images (see Section 2.2). By aligning images and the 3D model, the 3D model profile is projected on the 2D image with the goal of superposing a semantic layer on the original image. This layer is produced by projecting the spatial extension of the representations associated with the morphological entities of the semantic description. Each projection (computed through a vector rendering technique) is processed as a 2D polygon associated with the identifier of the related 3D entity. The projective relation between 3D representations and the spatialized iconographic sources
provides automatic procedures for adding and updating semantic annotations (Fig. 3):!
In the case of addition or change of the 3D morphological description, the new structuring description is re-projected on images. In the case of spatial referencing of a new image, the building morphological description will be automatically projected on images.
Semantic annotation of images by projection generates struc- tured data well-adapted for searching iconographic sources relating to architectural elements composing buildings (see Section 3.4).
Figure 3. Semantic annotation of photographs by projecting the building morphology organized according to the chosen description structuring. Segmentation of the 3D representation is mapped on oriented images structured as semantic layers.
2.3 The temporal dimension
In the case we are interested in studying changes undergone by buildings over time, the semantic structuring of the building morphology according to its current state is not sufficient. The examination of its morphology evolution throughout its lifecycle is required. In this case, the semantic structuring on one side, should take into account the temporal fragmentation, and on the other, should be integrated with a model capable of managing, storing and representing building history over time. We start from the statement that building lifecycles are characterized by a series of transitions (representing artifact physical changes) and sets of states (indicating time periods, in which the artifact does not undergo any change) (Blaise et al., 2008). In addition, some of these changes concern the entire building lifecycle (construction, demolition, reconstruction, union, division, redistribution), on the contrary others involve only some parts of its morphology (such as variation, displacement, degradation, facing).
The historic graphs
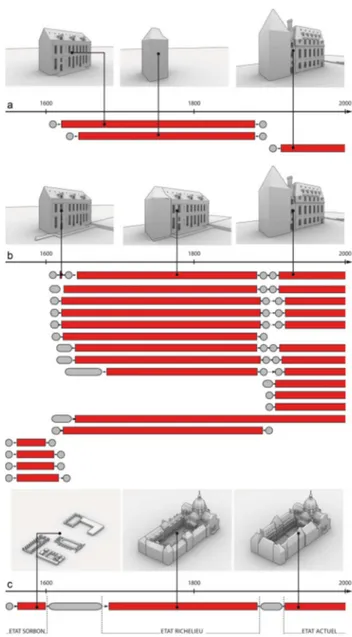
Starting from the work of (Renolen, 2004), we describe building transformations using a system of graphic notation (Stefani et al. 2010). At a graphic level (Fig. 4), this model describes changes through a succession of states (rectangles) and transitions (smoothed rectangles). Our model deals with six types of transformations (creation, destruction, alteration, union, division, reconstruction) having different lengths (shorter or
longer, or even sudden). Sudden changes, corresponding to events with zero duration (i.e. a change of ownership) are displayed with circles; gradual changes are described using smoothed rectangles whose lengths depend on the transformation interval. If change is gradual over a long time period, transition is broken by rectangles. This model has been adapted to display other changes characterizing historical heritage (displacement, covering, slow degradation, reallocation, change of function, of identity and ownership).
Figure 4. Spatial resolutions applied to the courtyard of the Sorbonne. Each graph describes: (a) a single temporal unit, (b) single buildings and (c) evolutions of the architectural complex.
If transformations do not cause any change in shape, some features are simply added to the graphical metaphor used for the six primary transformations: some symbols are overlapped on the graphic system to underline change. This model is well-adapted to represent multiple objects and transformations having different dimensions (corresponding to different spatial and temporal resolutions). Depending on the purpose of the analysis, several resolutions can be used. The computation on the resolution level follows the criterion of priority of changes over states.
3. INFORMATICS IMPLEMENTATION
Our platform, called (NUBES), consists currently of four tools:
• Archivium, a database for storing 3D representations.
• Tempus, for structuring and displaying temporal
changes.
• Imago, for the spatial referencing and semantic
annotation of iconographic sources.
• Visum, for the construction of ‘‘viewpoints’’ joining
3D representations, iconographic sources and sets of attributes configured by the user.
These tools are intended primarily for specialists in the field of architectural heritage conservation and valorization. Experts can qualify 2D and 3D representations according to their analysis needs. Users can actually access the platform only like clients in two ways: standard user (semantic annotation and characteriza- tion of a pre-loaded 3D description) and super user (upload and structuring of new 3D descriptions and representations). 3.1 Platform architecture
Our system consists of a web application based on a three-part architecture. From the technical point of view, this system joins three separate requirements.
• Storage of heterogeneous data: a database developed
in MySQL organizes rough data deriving from survey, multiple represen- tations and associated information according to the different user profiles.
• Manipulation of three-dimensional geometric
representations in real time: a 3D interactive scene
developed in Virtools DEV allows 3D representations to be downloaded, viewed and manipulated.
• Consultation and management of online data: the
application is developed in PHP, a website that allows the user to access data stored in the database and provides the dialogue between the 3D scene and the database.
In order to handle geometric representations, specific functions permitting to interact with entities have been developed: tools for spatial navigation, procedures for downloading geometric representations from database, tools for measurement and profile extraction, procedures for spatial geometric intersection of entities and finally procedures for the position and orientation interpolation of the camera viewpoint. The web application is based on the dialogue between the relational SQL database and the Virtools 3D scene, through PHP and Javascript, by means of table synchronization. At each interaction in the 3D scene, information on the manipulated entities is updated in the SQL database and vice versa. Some visual devices for the semantic annotation of images and the temporal graphs are developed in SVG. For sustainability data requirements, all geometric representations are stored in database in the binary format (.nmo via 3D player) for compression purpose, and in ASCII (coordinates of point clouds and of B-splines control points, Collada for polygonal representations and materials).
3.2 Visum: qualifying and structuring semantic entities
Visum allows viewpoints on objects to be built (Fig. 5). It
permits, firstly, to define attributes describing entities (such as terms in one or more thesauri), secondly, to establish hierarchical relations between entities and finally, to choose the suited representation according to the needs of consultation, analysis or communication. Starting from imported morphological entities, to which a basic geometric representation is associated, the user can interactively build a
description graph by inserting finalized groups or reference marks in the 3D scene. The creation of a group corresponds to create a concept joining together a collection of entities: in the graph, a 3D symbol is then created and displayed in the barycentre of the envelope encompassing all the selected entities. The reference mark creation is made by selecting a point on the morphological entity geometric representation. The link between the 3D scene and the web application provides the update of the structure that is so displayed as a hierarchy of entities belonging to a list. In fact, the representation of spatial relations is calculated in real time by a procedure generating a chain of 3D connections: connections are established according to the recognition of the hierarchy levels expressed in the term list. As a consequence, each entity of the description graph can be described by a thesaurus containing terms and definitions of the architectural vocabulary. Actually we use a simple vocabulary, based on the official thesaurus of the (French Ministry of Culture).
Figure 5. Semantic qualification of a 3D representation in Nubes Visum. The user can select a morphological entity, assign a vocabulary term, choose a type of representation (point cloud, profiles, polygons, etc.), qualify entities by custom attributes and create related reference marks.
In order to qualify entities characterizing the description graph, we are planning to implement several thesauri depending on the different disciplinary areas (specific vocabularies for particular types of buildings, construction techniques, degradation types, etc.). We plan to construct thesauri using known schemas and models in order to facilitate the sharing process (Doerr, 2002). The use of three-dimensional graphs to organize entities describing the building morphology provides the main advantage of spatially locating all information (qualification attributes, definitions, dimensions, etc.). Amount of information is still accessible in the database by formulating queries. Each entity belonging to the graph is linked to three separate blocks of information: general information about items (such as position, entities, etc.), information on the vocabulary term defining entities and information related to their current geometric representation (e.g., volume for polyhedral representations, dimension for profile representations). We are currently implementing a fourth block of information regarding a set of attributes freely configurable by users. By means of bilateral relations established between information and morphological components, it is possible to perform searches in two ways: searches relying on the entities selected in the 3D scene and entity searches in the 3D scene by means of form queries executed on the database.
Different criteria allow filtering entities in space: searches by thesaurus, by dimension, by representation type or still by temporal attribute. Search results are displayed in three steps. Firstly, records responding to the PHP page criteria are displayed as a list. Secondly, selected entities are identifies in the 3D space. Lastly, a procedure calculates automatically the camera movement so that the observation point is positioned in front of the searched entity. Moreover, Visum allows relations established among entities to be displayed by two-dimensional hierarchical graphs (Fig. 6). In this way, a privileged link between 3D representations and the concepts describing them is established in the world of knowledge. Graphs, representing how specialists have described buildings according to their ‘‘viewpoints’’, are interactively constructed in SVG format leaning on the attributes assigned by the user (thesaurus or arbitrary qualification).
Figure 6. Hierarchical graph representation according to viewpoints defined by users. In this visualization system, the user can navigate in the 3D scene (left) and the graph scene (right) structuring the vocabulary terms used for the description. When a term is selected on the graph, the navigation camera flies to the related element in the 3D scene.
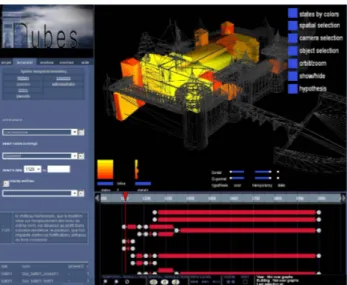
3.3 Tempus: semantic-based temporal queries
After the modeling and referencing stages previously described, on one side, changes over time are dynamically displayed through historic graphs, on the other side, visual information is presented on the model in order to describe the restitution type. The following queries, based on the temporal structuring, are possible (Fig. 7):
• Visualizing information about changes: a notation
graph reflects the history of each group: the temporal position of geometric entities and the sequence of events.
• Displaying temporal states: by means of temporal
attributes affected to morphological entities, color coding is used to better distinguish building components having different temporalities;
• Displaying assumptions: a transparency parameter is
associated with the model to differentiate the hypothetical shapes (existing or destroyed) whose iconographic sources are known ;
• Displaying spatial uncertainties: to distinguish the
kind of uncertainty, we use different diffusion levels: 3D representations can display the actual state of knowledge about time periods
Figure 7. Semantic based temporal query interface. In this visualization system, the user can formulate temporal queries (left), display buildings according to their ancientness, isolate and compare assumptions (top) and display transformations by means of historic graphs (bottom). When a 3D element is selected, its history is displayed and vice versa, at the graph selection, the corresponding 3D elements are displayed.
3.4 Imago: spatial and semantic searching of iconography Regarding the search of graphic sources, we focused on the use of photographs by means of the methods listed below.
Viewpoint-based photograph searching
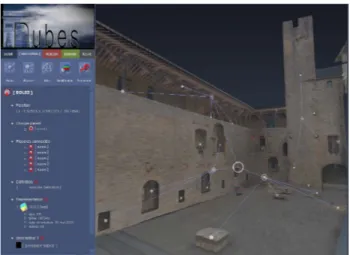
This search method allows a database query to be formulated according to the camera viewpoint (the current position of the navigation camera) in the scene (Bussayarat et al. 2008). It relies on the intersection between the visual pyramid of the browser camera and that of each photo stored in the database. Intersection computing between the visual pyramids considers three main criteria: the browser camera field (size of the visual pyramid), the distance between the browser camera position and the optical center of each camera linked to photographs and the angular difference (around the vertical axis) between the orientation of the camera browser and that of photographs. These three criteria can be configured at any time by the user during navigation of the scene to better filter the query. All information related to the camera geometric models concerning photographs are controlled by a table. This table is internal to the 3D scene, to allow real-time camera detection. Furthermore, at any time, in the interface an indicator displays the number of detected photographs. The display order of results is calculated as a function of the distance and orientation deviations between the viewpoint and the detected photographs (Fig. 8). By knowing the camera parameters of photographs stored in the database, one last feature allows the photograph’s viewpoint to be found in the 3D scene. This function is based on a linear interpolation between the extrinsic and intrinsic parameters of the camera navigation and those of the selected photograph. This corresponds to a displacement and a rotation of the navigation camera in order to reach the optical center associated with the photograph. A final procedure downloads the photo (at small size) from the database and displays it as a texture of that plane in the 3D scene.
Figure 8. Viewpoint-based image searching in the 3D scene. During the navigation in the 3D scene (right) and photos according to the observation point (in real time) are listed on the left of the interface. When the user selects a photo on this list, the navigation camera flies to the corresponding point of view showing the selected image in the 3D scene.
Entity-based photograph searching
This search method allows users firstly to select architectural elements in the 3D scene and finally to launch a query in order to find photos corresponding to the selected object in the database (Fig. 9).
Once a morphological entity is selected (whatever is geometric representation), a function seeks all photographs displaying the entity. The function is structured as follows: for each camera associated with the photographs stored in the database, it is verified whether the object is present in the associated semantic layer (SVG) produced by projection (see section 2.2).
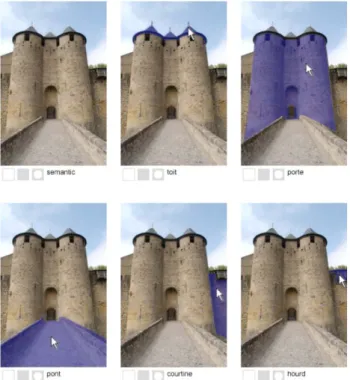
Precision between the polygon resulting from the semantic layer projection and the represented shape in the original image depends on the results of the spatial referencing process. The following process computes the area of visible elements in the image (expressed as percentages) and provides values to sort results: the image in which the selected entity occupies the largest area will be displayed first. The semantic layer overlapped by the image is enhanced by an interactive behavior (in Javascript) permitting discovery of the semantic segmentation of the image as mouse passes over (Fig. 10).
Figure 9. Entity-based images searching in the 3D scene. When one or more 3D entities are selected in the 3D scene, all photographs in which these elements are present are listed. The semantic layer related to the selected elements (mapped on photos as a SVG mask) is highlighted.
The interactive SVG images are hybrid representations combining three types of information: the 2D image, the structure of the 3D scene and the terms used for describing the elements of the 3D scene. This richness of information allows taking into account image searching by element classes or by specific attributes. For instance, it is possible to search in the database all photographs representing a specific type of architectural element or any element affected by a specific kind of degradation.
Figure 10. Interactivity of semantic layers associated to images. Moving the cursor on photos, the semantics coming from the 3D model is highlighted showing vocabulary terms (on the bottom of each image) related to the selected entities.
4. CONCLUSIONS AND FUTURE WORKS In this paper, we presented an integrated platform to manage digital representations of buildings for architectural applications related to the analysis and the documentation of cultural heritage. Various fundamental problems have been explained and various informatics developments have been presented. We are actually working with some specialists in conservation that use our information system in order to organize the 3D representation of artifacts and heterogeneous data coming from analysis of degradation. Two papers discuss these applications (Brunetaud et al., 2010 ; Vallet et al., 2010).
Readers can find a lot of resources about our platform in the following web page: http://www.map.archi.fr/nubes
REFERENCES
(Attene et al., 2009) Attene M, Robbiano F, Spagnuolo M, Falcidieno B. Characterization of 3D shape parts for semantic annotation. Computer-Aided Design 2009;41(10):756–63.
(Blaise et al., 2008) Blaise JY, Dudek I. Beyond graphics: information—an overview of Infovis practices in the field of the architectural heritage. GRAPP 2008:147–50.
(Boehler et al., 2002) Boehler W, Marbs A. 3D Scanning instruments. In: Proceedings of the CIPA WG 6—scanning for cultural heritage recording, Corfou, 2002.
(Brunetaud et al. 2010) Brunetaud X, De Luca L, Badosa S, Beck K, Al-Mukhtar M A database gathering the mapping of degradations and the stonework dating in a 3D realistic model for the completion of a health record of monument. In: Proceedings of the 8th international symposium on the conservation of monuments in the Mediterranean basin. May 31–June 2, Patras, Greece, 2010.
(Bussayarat et al., 2008) Bussayarat C, De Luca L, Ve ́ ron P, Florenzano M An on-line system to upload and retrieve architectural documents based on spatial referencing. In: Proceedings of the IDMME—virtual concept 2008, 10–13 October 2008, Beijing, China, 2008.
(Debevec et al., 1996) Debevec P, Taylor C, Malik J. Modeling and rendering architecture from photographs: a hybrid geometry and image-based approach. In: Proceedings of SIGGRAPH, 1996. p. 11–20.
(De Luca et al. 2007) De Luca L, Ve ́ron P, Florenzano M. A generic formalism for the semantic modeling and representation of architectural elements. The visual computer. Vol. 23(3), Springer Berlin; Heidelberg, 2007.
(Doerr, 2002) Doerr Martin. The CIDOC CRM—an ontological approach to semantic inter- operability of metadata. AI Magazine, Special Issue on Ontologies, November 2002. (Dudek et al. 2003) Dudek I, Blaise J-Y, Beninstant P Exploiting the architectural heritage’s documentation: a case study on data analysis and visualisation. In: Proceed- ings of I-KNOW‘03. Graz, Austria, 2003.
(El-Halim et al. 2003) El Hakim SF, Beraldin A, Picard M, Vettore A Effective 3D modeling of heritage sites. In: Proceedings of the 4th international conference on 3D digital imaging and modeling, Banff, Canada, 2003. p. 302–9. (Falcidieno et al., 1998) Falcidieno B, Spagnuolo MA. Shape-abstraction paradigm for modelling geometry and semantics. Proceedings of the international conference on computer graphics. Los Alamitos, CA: IEEE Computer Society Press; 1998.
(French Ministry of Culture) Bases de données Architecture et Patrimoine. Ministe"re de la Culture et de la Communication. http://www.culture.gouv.fr/culture/inventai/patrimoine. (Guidi et al., 2009) Guidi G, Remondino F, Russo M, Menna F, Rizzi A, Ercoli S. A multi-resolution methodology for the 3D modeling of large and complex archaeological areas. International Journal of Architectural Computing 2009;7(1):40– 55.
(Hartley et al., 2004) Hartley R, Zisserman A. Multiple view geometry in computer vision. Cambridge University Press; 2004.
(Havemann et al., 2008) Havemann S, Settgast V, Berndt R, Eide Ø, Fellner D. The Arrigo showcase reloaded—towards a sustainable link between 3D and semantics. In: Proceed- ings of VAST, 2008. p. 125–32).
(Heine, 1999) Heine E. High precision building documentation: element definition and data structuring. In: Proceedings of The
ICOMOS and ISPRS committee for the documentation of cultural heritage, WGII, 1999.
(Herbig, 1997) Herbig U, Waldhusl P. APIS—Architectural Photogrammetry Information System. International Archives of Photogrammetry and Remote Sensing 1997; XXXII (Part5C1B): 23–7.
(Knuyts et al., 2001) Knuyts K, Kruth J-P, Lauwers B, Neuckermans H, Pollefeys M, Li Q, et al. Vision on conservation: Virterf. Proceedings of the international symposium on virtual and augmented arhitecture. Dublin: Springer Verlag; 2001 p. 125–32.
(Manfredini et al., 2008) Manferdini AM, Remondino F, Baldissini S, Gaiani M, Benedetti B 3D modeling and semantic classification of archaeological finds for management and visualization in 3D archaeological databases. In: Proceedings of the 14th international conference on virtual systems and multiMedia (VSMM), Cyprus, 2008 p. 221–8.
(Marbs et al. 2001) Marbs A, Heinz G, Boehler W. The potential of non-contact close range laser scanners for cultural heritage recording. In: Proceedings of the CIPA interna- tional symposium, Potsdam, Germany, 2001.
(NUBES). NUBES : An integrated platform for describing, analysing, documenting and sharing digital representations of heritage buildings. http://www.map.archi. fr/nubes.
(Renolen, 2004) Renolen A Modeling spatiotemporal information. The Spatiotemporal Object Model, Trondheim, Norway, 2004. p. 1–22.
(Salonia et al., 2000) Salonia P, Negri A. ARKIS: an information system as a tool for analysis and representation of heterogeneous data on an architectural scale. In: Proceedings of the WSCG 2000, Plzen, Czech Republic, 2000.
(Stefani et al., 2010) Stefani C, De Luca L, Ve ́ ron P, Florenzano M. Time indeterminacy and spatio- temporal building transformations: an approach for architectural heritage understanding. International Journal on Interactive Design and Manufacturing 2010;4(1).
(Tsai, 1986) Tsai R. An efficient and accurate camera calibration technique for 3D machine vision. In: Proceedings of the IEEE conference on computer vision and pattern recognition, 1986.
(Vallet et al. 2010) Vallet J-M, De Luca L, Feillou M, Guillon O, Pierrot-Deseilligny M, Baudry O, et al. An interactive 3-dimensional database applied to the conservation of a painted chapel. In: Proceedings of the 7th international conference on science and technology in archaeology and conservation, Petra (Jordan), 7–12 December, 2010.