is an open access repository that collects the work of Arts et Métiers Institute of
Technology researchers and makes it freely available over the web where possible.
This is an author-deposited version published in: https://sam.ensam.eu
Handle ID: .http://hdl.handle.net/10985/8779
To cite this version :
Jingya YAN, Eric GUILBERT, Eric SAUX - An Ontology for Submarine Feature Representation on Charts - In: Seventh International Workshop on Semantic and Conceptual Issues in GIS
(SeCoGIS 2013), Hong Kong, 2013-11 - Proceedings of the seventh International Workshop on Semantic and Conceptual Issues in GIS (SeCoGIS 2013) - 2013
Any correspondence concerning this service should be sent to the repository Administrator : [email protected]
An Ontology for Submarine Feature
Representation on Charts
Jingya Yan1,2, Eric Guilbert2, and Eric Saux1 1
Naval Academy Research Institute, GIS group Lanv´eoc-Poulmic, CC600, 29240 Brest Cedex 9, France
2
Department of Land Surveying and Geo-Informatics The Hong Kong Polytechnic University
Hung Hom, Kowloon, Hong Kong [email protected]
Abstract. A landform is a subjective individuation of a part of a ter-rain. Landform recognition is a difficult task because its definition usu-ally relies on a qualitative and fuzzy description. Achieving automatic recognition of landforms requires a formal definition of the landforms properties and their modelling. In the maritime domain, the Interna-tional Hydrographic Organisation published a standard terminology of undersea feature names which formalises a set of definition mainly for naming and communication purpose. This terminology is here used as a starting point for the definition of an ontology of undersea features and their automatic classification from a terrain model. First, an ontology of undersea features is built. The ontology is composed of an application domain ontology describing the main properties and relationships be-tween features and a representation ontology deals with representation on a chart where features are portrayed by soundings and isobaths. A database model was generated from the ontology. Geometrical properties describing the feature shape are computed from soundings and isobaths and are used for feature classification. An example of automatic classifi-cation on a nautical chart is presented and results and on-going research are discussed.
Keywords: Geographical domain ontology, Landform classification, Nau-tical chart, Digital terrain modelling
1
Introduction
On nautical charts, undersea features are portrayed by sets of soundings (depth points) and isobaths (depth contours) from which the map reader can interpret landforms. As defined by [1], “a landform is a part of the Earth’s surface that is characteristically apprehended as a unitary thing or object because of its partic-ular shape”. However describing its shape is a subjective task as a landform is inherently vague. Shape and boundary are defined qualitatively and their appre-ciation depends on the context or the cultural knowledge of people. Establishing
a list of landform types is therefore not a trivial task. Existing landform classi-fications usually provide an end-user terminology for the need of a community.
In the maritime domain, the International Hydrographic Organisation (IHO) has published a nomenclature of undersea features which provides a standard terminology for the naming of undersea features on charts and in publications [2]. The objective of this research is to generate a submarine feature classification so that features can be identified automatically from the seafloor representation. Such tool can assist both the cartographer and the map reader in selecting or visualising important features and evaluating the quality of a chart. An ontology of undersea features is designed and an application implementing the concepts is developed. The ontology is divided into two parts. The Application Domain Ontology built directly from the IHO terminology, organises and describes the properties of the features, forming a hierarchy of concepts. The Phenomenologi-cal Domain Ontology describes the concepts for representing the seafloor on the chart. Concepts from the ADO are translated so that each feature corresponds to a set of soundings and isobaths and its properties are extracted from the terrain model. A database model is then derived and is implemented in a triplestore database.
This paper first reviews existing works on landform classification and ontolo-gies. Section 3 presents the ADO and PDO detailing how features are classified on the chart. Section 4 presents the database model and discusses classification results obtained from bathymetric data. The last section presents conclusions and directions for future work.
2
Ontologies of landforms
2.1 Landform classification
Landforms characteristics being by essence fuzzy and scale dependent [3], their description can vary easily according to people’s perception and experience. Landform classification in that case is rather a problem of defining formal specifi-cations that correspond to verbal descriptions for the purpose of communication within a community [4]. Existing work in this domain consists in the estab-lishment of a core reference or a domain ontology collecting and formalising knowledge gathered from experts. Major sources of landform taxonomy are pro-vided by spatial data standards such as SDTS and by national mapping agencies such as the IGN-E in Spain [5] and the Ordnance Survey in the UK3. Proposed
ontologies rely on several ontologies including a topographic ontology and a hydrologic ontology. They provide formal qualitative properties and relations between features. However classification requires the assessment of geometrical properties such as height, length or area and so the definition of some quanti-tative descriptors. Existing work in this direction mostly relates to identifying specific landforms such as valley [6], bay [7] and reef [8].
3
An Ontology for Submarine Feature Representation on Charts 3 In the maritime domain, the IHO is the international body engaged in defin-ing standards in order to advance maritime safety. In order to build a common frame for the naming of undersea features, the IHO defined a terminology of undersea feature names [2]. The purpose of the document is to set a standard for communication (the terminology is available in several languages) and for the denomination of undersea features (with a guideline for naming features). Al-though this document is only a terminology with definitions in natural language, it defines a standard, classifies more terms and provides more precise definitions than the Geo-Wordnet4 database or USGS’s SDTS5. Therefore this document
provides a uniform view of undersea features solving most semantic difficulties [9] and is used as a base for the definition of the ontology of submarine features.
2.2 The geographical ontology framework
Conceptualising knowledge for a specific application is done by gathering specific knowledge from a domain and by integrating concepts from higher level ontolo-gies. In order to represent geographic objects from the real world to computer language, [10] introduced a five-universe paradigm. The physical and cognitive universes contain real world phenomena and their representation in the human mind. The logical universe provides explicit ontologies formalising the cognitive universe. The representation universe deals with the description of geographical elements from the logical universe and contains ontologies conceptualising the elements according to the type of representation (e.g. field or object model). Finally, the implementation universe describes algorithms and data structures as implemented in the application.
In order to organise information on geographic worlds into ontologies, [10] considered a multiple-ontology approach where knowledge is shared between the logical universe and the representation universe. [10] defined first the Applica-tion Domain Ontology (ADO), concerned with describing specific subjects and tasks, in the logical universe. It is composed of two kinds of ontology: a subject ontology describing the vocabulary related to a generic domain, and a task on-tology describing a task or application within a specialisation domain. Second, the Phenomenological Domain Ontology (PDO) in the representation universe manages different properties of the geographical phenomena in the GIS. It is composed of method and measurement ontologies. A method ontology defines a set of algorithms and data structures, and a measurement ontology describes the physical process of recording a geographical phenomenon. Both universes are defined separately. Different representations can be defined for one application or one representation used for different applications. The connection between both ontologies is made by semantic mediators.
4 http://geowordnet.semanticmatching.org/ 5
3
An ontology of undersea features
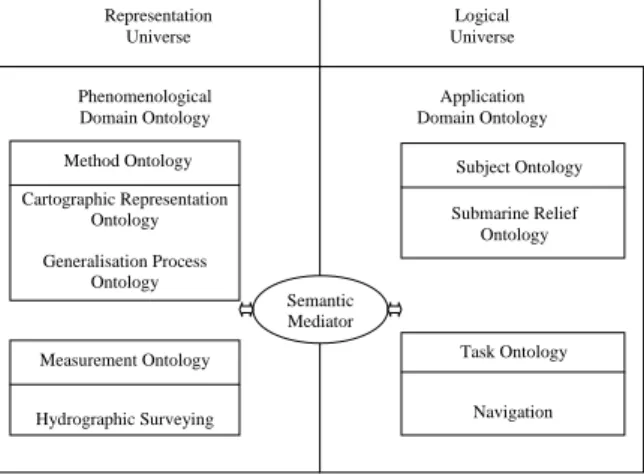
Following Fonseca’s framework, the undersea feature ontology can be divided into two parts (Figure 1). Concepts that belong to the maritime domain are part of the logical universe. The subject ontology conceptualises knowledge about submarine features and is mostly derived from the IHO terminology. The subject ontology describes any activity that requires or analyses seafloor information. In the context of this work, nautical charts being mainly designed for navigation purpose, the task ontology would logically be related to navigation and route planning.
The representation universe is concerned with the representation of undersea features on the nautical chart. The method ontology focuses on terrain rep-resentation techniques including objects on the chart (soundings, isobaths) and operations handling these objects (isobath extraction, generalisation operations) as well as operations matching features from the ADO to the PDO. The measure-ment ontology refers to data collection techniques (e.g. echo sounding, LIDAR).
Phenomenological Domain Ontology Application Domain Ontology Representation Universe Logical Universe Semantic Mediator Cartographic Representation Ontology Generalisation Process Ontology Method Ontology Submarine Relief Ontology Subject Ontology Hydrographic Surveying Measurement Ontology Navigation Task Ontology
Fig. 1. Phenomenological and application domain ontologies of undersea features.
This work focuses on the characterisation of undersea features and their rep-resentation. Task and measurement ontologies require knowledge about data acquisition or maritime navigation and so are not addressed. The next section presents the subject ontology by defining the properties required to describe undersea features. Section 3.2 describes the method ontology and presents how features from the subject ontology are represented in the method ontology. On-tologies also include information such as value restrictions (e.g. depth values range) and specification of logical relationships between concepts (e.g. each mor-phological feature must include at least one isobath or a sounding).
An Ontology for Submarine Feature Representation on Charts 5 3.1 The subject ontology
Building the domain ontology is done in two steps. First, properties and re-lationships characterising each of the 46 features are identified by analysing the definitions and extracting keywords corresponding to feature characteristics. Second, these characteristics are organised into different concepts (composition, shape) describing the feature properties and relationships (mereological, topo-logical, taxonomic). At the end of the process, a hierarchy of features is defined. IHO features correspond to the most specialised concepts and are at the bottom of the hierarchy, inheriting from one or several more generalised concepts such as depression (a feature which is lower than its surrounding) or prominence (a feature which is higher than its surrounding). The hierarchical structure pro-vides several levels of semantic precision which can be adjusted according to the accuracy of the input data or to the required precision of the description. For example, although a large number of features are part of the ocean floor, a detailed description is not needed on an offshore navigation chart as they cannot be portrayed precisely on a large scale map.
Figure 2 shows the structure of the subject ontology. A full description of properties, relationships and concepts involved at top level and application level is given in [11]. Properties describing the features are the composition (e.g. rock, sand), the depth level and the shape properties. The depth level relates fea-tures with parts of the seafloor at different range of depths and having different geomorphological properties.
Fig. 2. Concepts describing undersea features.
In order to describe the feature shape, the feature can be divided into three parts: its body, tip and base. The body is described by the feature height, vertical profile and relative spatial extent. The vertical profile defines the overall shape (peak, ridge, plane area) which includes the morphometric class as well as the type of slope (steep, gentle, horizontal). The relative spatial extent indicates if a feature is relatively large or small. The tip concept applies to eminences and depressions and describes the shape of the extremity. For example, a summit can be sharp (like a pinnacle) or flat (like a plateau). Finally, the base is described by the horizontal profile (e.g. elongated, circular).
3.2 The method ontology
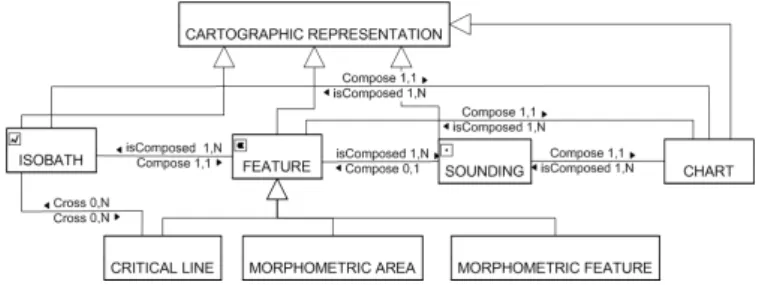
The method ontology formalises the way submarine features are represented on the chart. It includes concepts and rules defined by hydrographic offices [12, 13]. Four main concepts (chart, isobath, sounding and feature) are defined to-gether with their spatial relationships and properties (Figure 3). The chart con-cept mostly includes metadata about the scale and the symbology. Isobaths and soundings are the elements portraying the seafloor. A sounding is defined by a depth and a position. Soundings are also classified into different classes accord-ing to their importance in characterisaccord-ing features that are relevant to navigation [11]. An isobath is defined by a line and its depth. Topological relationships between soundings and isobaths are also recorded.
Fig. 3. Chart elements defined in the method ontology.
The chart feature concept corresponds to the representation of an undersea feature from the subject ontology. As mentioned in section 2.1, classification is scale dependent and is based on fuzzy characteristics. In the context of repre-sentation on a chart, a feature is portrayed by a set of soundings and isobaths that the reader can interpret. For example, a reef feature is represented by a sounding which is close to the sea level, representing a hazard and an isobath containing the sounding. The method ontology also defines operations extracting the isobaths from a set of soundings and cartographic generalisation operations (e.g. selection, filtering) adapting the chart elements to the scale.
4
Implementation
4.1 System design
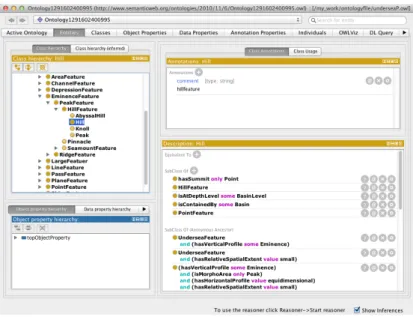
Both ADO and PDO ontologies6 were built in the Prot´eg´e 4.2 platform and exported into a RDF file. Figure 4 is an extract of the undersea feature ontology. The ontological model was then integrated in Virtuoso. It can function as a web application server as well as a host for data-driven web services. Virtuoso offers a triplestore database that is a purpose-built database for the storage and retrieval of triples in RDF terminology in the form of subject-predicate-object expressions.
6
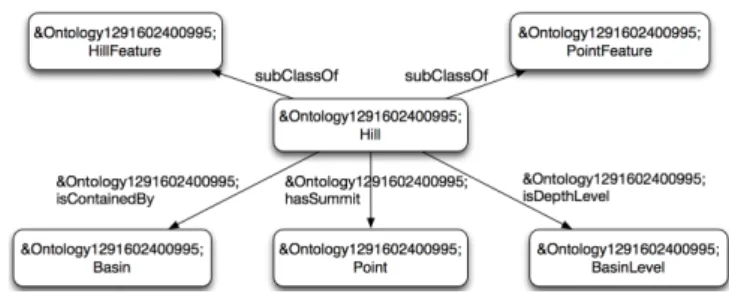
An Ontology for Submarine Feature Representation on Charts 7 Triplestore is in coherence with the current emphasis on development of native stores since their performance are optimised for the storage and retrieval of triples. Information or knowledge is accessible via SPARQL. The Jena API was used to read from and write to the RDF graph. An example of such a RDF graph is proposed in figure 5. The Hill concept, defined in the IHO terminology, inherits from the HillFeature and the PointFeature concepts and describes a feature having a point tip. The HillFeature concept is a generalisation of different concepts which differ by the type of tip and their possible location.
Fig. 4. Extract of the ADO in Prot´eg´e: the Hill concept.
A triplestore is also built for the storage of the bathymetric data of a chart (soundings, isobaths, undersea features). Its schema is generated by the ontolog-ical triplestore. Predicates in this database connect data together (e.g. isobath I belongs to feature F ) and data with concepts (e.g. isobath I is an instance of the isobath concept). Finally, the ontological and data knowledge are connected to the geographical information system. As our information system was initially developed in C++ language, Java Native Interface (JNI) is used to connect Java (i.e. Jena) and C++.
4.2 Results
The model was tested on a set of soundings provided by the French Hydrographic Office for a large scale map (1:12500) of a coastal area. Isobaths were extracted with a 1 metre vertical interval by interpolation. A first step before feature classi-fication is their identiclassi-fication. On such a chart, cartographers and readers mostly make use of isobaths to delineate hazards and navigation routes. Therefore, fea-tures are characterised by one or several isobaths at the same depth marking
Fig. 5. Graph associated to the RDF/XML description of the Hill concept.
their boundary [14]. A current limitation of this approach is that only depres-sions and prominences are considered. The method extracts features based on depth variations between adjacent isobaths and yields a feature tree providing topological relationships between features (adjacency and inclusion). Relation-ships between isobaths and soundings are defined by a constrained Delaunay triangulation.
Only features that inherit from the prominence and depression concepts are classified as they are the only ones identified on the chart. Shape properties are computed from the soundings and isobaths composing a feature. Base properties are computed from the boundary contours. The tip is defined by starting from the highest or deepest sounding and by adding neighbouring triangles to ex-tract the largest possible horizontal surface. Figure 6 presents a set of classified features. Figure 6A shows leaves of the feature tree, i.e. feature which do not contain any other features. Figure 6B shows features at the top of the hierarchy. The hierarchy of feature concepts defined in the ADO was used as a decision tree to reach the highest level of precision. Seven types of feature (peak feature, reef, bank, shoal, pit, channel and basin feature) were identified and charac-terised (Table 1). The first four features are prominences and three of them are defined in the IHO terminology. The last three are depressions and are not in the terminology because in shallow areas, noticeable features are mainly features which represent a danger for navigation. A channel corresponds to an elongated depression. The largest one, shown on Figure 6B, indicates a navigation route. Others are indeed contained by the first one.
Table 1. Undersea features (features defined in the IHO terminology in bold). Peak feature Reef Bank Shoal Pit Channel Basin feature Total
25 6 4 9 34 6 17 101
8
An Ontology for Submarine Feature Representation on Charts 9
Fig. 6. Results of undersea features characterization. The colour figure with more de-tails of undersea features is accessible on line8.
5
Conclusion
This paper introduced an ontology of undersea features for landform classifica-tion. The concepts were implemented into a cartographic application to enrich the bathymetric database for purpose of cartographic and model generalisation. The ontology is divided into an application domain, defining the feature prop-erties, and a phenomenological domain, addressing their representation on a chart. On top of the IHO definitions, general concepts were added to provide a description at different precisions. These general concepts are useful for the representation because on one side, the bathymetric database usually does not contain enough data for a full characterisation of all features and on the other side, the amount of details is adapted to the scale and the purpose of the chart. All concepts defined in the ontology have not been implemented yet. Only features that are bounded by one or several isobaths are identified. Due to the in-herent vagueness of landforms, delineating undersea features with a crisp bound-ary is subjective however it corresponds to the representation that is given on the chart and provides a rigorous definition for shape properties. Further work can be done by representing features by one or several soundings (e.g. a seamount where only the summit is marked) or by dealing with plane features. In such cases, features are not represented on the chart with a crisp boundary and there-fore vagueness has to be taken into account in the position and computation of geometric properties [15]. As the level of complexity would increase greatly with the number of feature concepts involved, the decision tree may be pruned ac-cording to the type of chart (large or small scale, coastal or offshore navigation) to limit the number of features considered.
This work is part of a larger project on the cartographic and model gener-alisation of the seafloor for nautical chart production. Therefore the next step is the integration of cartographic rules and generalisation constraints and op-erators in the method ontology. The feature ontology may also be extended by adding more information about relevance to navigation: some prominences are
already marked as hazards, channels can also be marked as navigation routes to be preserved. Based on this knowledge, the application shall be able to infer plans for automatic processing and to evaluate the quality of the generalised data.
Acknowledgments. The work presented in this paper is funded by the Con-sulate General of France in Hong Kong and the R´egion Bretagne in France under grant 0211/ ARE 09011/00026102 and partly by grant A-PK56. The authors wish to thank the “Service Hydrographique et Oc´eanographique de la Marine” in France for their cartographic data.
References
1. Mark, D.M., Smith, B.: A science of topography: From qualitative ontology to digital representations. In Bishop, M.P., Shroder, J.F., eds.: Geographic Information Science and Mountain Geomorphology, Praxis Publishing (2004) 75–100
2. International Hydrographic Organization: Standardization of undersea feature names. 4th edn. International Hydrographic Bureau, Monaco (2008)
3. Chaudhry, O., Mackaness, W.: Creating mountains out of mole hills: Automatic identification of hills and ranges using morphometric analysis. Transactions in GIS 12(5) (2008) 567–589
4. Smith, B., Mark, D.M.: Do mountains exist? towards an ontology of landforms. Environment and Planning B: Planning and Design 30(3) (2003)
5. G´omez-P´erez, A., Ramos, J., Rodr´ıguez-Pascual, A., Vilches-Bl´azquez, L.: The IGN-E case: Integrating through a hidden ontology. In Ruas, A., Gold, C., eds.: Headway in Spatial Data Handling, Springer (2008) 417–435
6. Straumann, R.K., Purves, R.S.: Computation and elicitation of valleyness. Spatial cognition and computation 11(2) (2011) 178–204
7. Feng, C.C., Bittner, T.: Ontology-based qualitative feature analysis: Bays as a case study. Transactions in GIS 14(4) (2010) 547–568
8. Duce, S.: Towards an ontology for reef islands. In Janowicz, K., Raubal, M., Lev-ashkin, S., eds.: GeoSpatial Semantics. Volume 5892 of Lecture Notes in Computer Science., Berlin Heideberg, Springer-Verlag (2009) 175–187
9. Bittner T, Donnelly M, Winter S.: Ontology and semantic interoperability. In Large-Scale 3D Data Integration (2005) 139–160
10. Fonseca, F.T.: Ontology-driven geographic information systems. PhD thesis, The University of Maine (2001)
11. Yan, J., Guilbert, E., Saux, E.: An ontology of the submarine relief for analysis and representation on nautical charts. The Cartographic Journal, to appear. 12. National Oceanic and Atmospheric Administration, U.S. Department of
Com-merce: Nautical Chart User’s Manual. (1997)
13. Service Hydrographique et Oc´eanographique de la Marine: Etude d’aide `a la pr´eparation des cartes marines – ´etude de faisabilit´e: Partie 2 Conception d´etaill´ee des traitements. (1995)
14. Guilbert, E.: Multi-level representation of terrain features on a contour map. Geoinformatica 17(2) (2013) 301–324
15. Bittner, T.: Vagueness and the trade-off between the classification and delineation of geographic regions - an ontological analysis. International Journal of Geographical Information Science 25(5) (2011) 825–850
![Figure 2 shows the structure of the subject ontology. A full description of properties, relationships and concepts involved at top level and application level is given in [11]](https://thumb-eu.123doks.com/thumbv2/123doknet/7364245.214123/6.892.258.663.623.763/structure-ontology-description-properties-relationships-concepts-involved-application.webp)