Pépite | Étude théorique de la revolatilisation d’iodures métalliques et d'oxydes de ruthénium lors d'accident nucléaire
189
0
0
Texte intégral
(2) Thèse de Hao Hu, Université de Lille, 2019. THÈSE DE DOCTORAT PRÉSENTÉE PAR. Hao HU POUR L’OBTENTION DU TITRE DE. DOCTEUR DE L’UNIVERSITÉ DE LILLE Ecole Doctorale: Sciences de la Matière, du Rayonnement et de l’Environnement Spécialité : Chimie théorique, physique, analytique. Theoretical Study of the Revolatilization of Control Rod Metal Iodides and Ruthenium Oxides Species in Nuclear Accident. Soutenue le 28 mai 2019 devant le jury composé de : Dr. David LOFFREDA. ENS Lyon. Pr. Frederik TIELENS. Vrije Universiteit Brussel. Dr. Hadrien PERRON. EDF-RD. Examinateur. Dr. Murielle RIVENET. ENSCL. Examinateur. Pr. Jean-François PAUL. Université de Lille. Dr. Laurent CANTREL. IRSN. © 2019 Tous droits réservés.. Président, Rapporteur Rapporteur. Directeur de thèse Co-directeur. lilliad.univ-lille.fr.
(3) Thèse de Hao Hu, Université de Lille, 2019. Pag © 2019 Tous droits réservés.. lilliad.univ-lille.fr.
(4) Thèse de Hao Hu, Université de Lille, 2019. I know that I know nothing. -Socrates. © 2019 Tous droits réservés.. lilliad.univ-lille.fr.
(5) Thèse de Hao Hu, Université de Lille, 2019. Pag © 2019 Tous droits réservés.. lilliad.univ-lille.fr.
(6) Thèse de Hao Hu, Université de Lille, 2019. ACKNOWLEDGEMENTS. ACKNOWLEDGEMENTS In this short page, I would like to express my appreciation to all the people who have given me help and support in my period of my PhD study and research. Firstly, I thank the French State for the finance of this research work under the program “Investissements d'Avenir” managed by the National Research Agency (ANR) under grant agreement no ANR-11-RSNR-0013-01 (MiRE project). And I would like to express my sincere gratitude to my supervisors, Pr. Jean-François PAUL from UCCS (Unité de Catalyse et Chimie du Solide) and Dr. Laurent CANTREL from IRSN (Institut de Radioprotection et de Sûreté Nucléaire), for their guidance, kindness, understanding and encouragement during these years. Moreover, I would like to thank all members of the jury, Dr. David LOFFREDA, Pr. Frederik TIELENS, Dr. Hadrien PERRON and Dr. Murielle RIVENET for the evaluations of this work and the corrections on the manuscript. Then, I would like to acknowledge all the members of our MODSPEC team, especially to Asma, Sylvain, Siwar, for their kindness help on my thesis work. I would also like to thank all my colleagues and friends in UCCS laboratory, Martine, Pardis, Mélanie, Sarah, Grèce, Noura, Bertrand, Guillaume P., Hermann, Carmen, Bingyu, Shuo, Xiu, Bang, Yu Xiang, Shi Dichao, and also those who has already finished their works or studies, Guillaume R., Hélori, Parnian, Eric G., Yaqian, Yann, Anita, Mengdie, Zhiping, Tong, Cyril, Soraya…Furthermore, I would also like thanks to my friends of ASC Master, Clément, Yevheniia and Diksha, for their supports and encouragement during these years. In the end, I would like to thanks all my family, my father, my spouse Valentin, all my family in-law and especially my little sunshine Lylia.. © 2019 Tous droits réservés.. Page | I lilliad.univ-lille.fr.
(7) Thèse de Hao Hu, Université de Lille, 2019. ACKNOWLEDGEMENTS. II | Page © 2019 Tous droits réservés.. lilliad.univ-lille.fr.
(8) Thèse de Hao Hu, Université de Lille, 2019. ABSTRACT. ABSTRACT In 2011, the nuclear accident in Fukushima reminded an absolute requirement to assure a high level of safety in nuclear installations. In fact, a severe nuclear accident could lead to significant radiological consequences due to the releases of radio toxic compounds. These fission products will be liberated from degraded fuel, transported in the primary circuit. They may reach to the containment and therefore could be released into the environment. Depending on their half-lifetimes and their chemical evolution, some isotopes, such as:. 131. I,. 103. Ru and. 106. Ru, are particularly dangerous. due to their high volatility and significant radiological consequences. In the primary circuit aerosols formed at high temperatures will partially condense and nucleate on the walls of the primary circuit. In this work, the adsorption of some fission products (control rod metal iodides and ruthenium oxides) on the surface of the primary circuit will be studied as well as the mechanisms leading to the re-volatilization of these deposits. Since the surface of the primary circuit, constituted by 304L stainless steel, is mainly composed by iron and chromium oxides, we studied theoretically (by DFT periodic calculations) the adsorption mechanisms of control rod metal iodides and ruthenium oxides on iron oxide and chromium oxide model surfaces. These surfaces are modified to take into account the experimental conditions. We investigated in this thesis the formation of gaseous components (I 2(g), RuO3(g) or RuO4(g)) from these adsorbed species as well as the oxidation of RuO2 surface. Our results show that it is possible to form I2(g), RuO3(g) or RuO4(g). However, I2(g) only possible forms on oxidized chromium oxide surface. On the other surfaces, the co-adsorption of an oxidant (OH●) is needed to form I2(g). On the same surfaces, the formation of RuO3(g) or RuO4(g) is possible with or without the presence of O2(g). We have found that the stainless steel surface plays an important role in the decomposition of RuO4 and can also catalyse the reaction.. Keywords: DFT, Reaction mechanism, Activation energy, Nuclear accident, Silver iodide, Cadmium iodide, Ruthenium oxides.. © 2019 Tous droits réservés.. Page | III lilliad.univ-lille.fr.
(9) Thèse de Hao Hu, Université de Lille, 2019. RESUME. RESUME En 2011, l’accident nucléaire de Fukushima a rappelé la nécessité absolue d’assurer un haut niveau de sureté des installations nucléaires. Les conséquences de ces accidents sont liées principalement aux rejets de composés radiotoxiques produits par la fission de l’uranium. Ces composés peuvent être transportés dans le circuit de refroidissement primaire et atteindre l’enceinte de confinement. En cas de fuite de cette enceinte, ils sont, in fine, dispersés dans l’environnement. En fonction de la période radioactive ou de leur évolution chimique, certains isotopes, par exemple :. 131. I,. 103. Ru,. 106. Ru, sont particulièrement nocifs, en raison de leur grande volatilité et de leurs. radiotoxicités importantes. Dans le circuit primaire, en raison d’un fort gradient thermique, les aérosols formés à haute température, près du cœur du réacteur, vont se condenser sur les parois du circuit primaire. Dans ce travail, nous avons étudié l’adsorption de ces produits de fissions (iodures métalliques et ruthénium oxydes) sur la surface du circuit primaire ainsi que les mécanismes conduisant à la revolatilisation de ces dépôts. La surface du circuit primaire, en inox 304L, est constituée majoritairement d’oxydes de fer ou de chrome. Nous avons étudié par voie théorique (calculs périodiques par DFT) les mécanismes d’adsorption d’iodures métalliques et d'oxydes de ruthénium sur des modèles de surfaces d’oxyde de fer, d’oxyde de Chrome modifiées pour tenir compte des conditions expérimentales. Nous avons étudié la formation des composés gazeux (I2(g), RuO3(g) ou RuO4(g)) à partir de ces molécules adsorbées et à partie de surface de RuO2. Nos résultats ont montré qu’il est possible de former I2(g), RuO3(g) ou RuO4(g) à partir des molécules adsorbées. Cependant, seule la surface d'oxyde de chrome suroxydée permet de former I2 spontanément à haute température. Dans les autres cas, la coadsorption d’un oxydant (OH●) est indispensable pour former I2(g). Par contre, la formation de RuO3(g) ou RuO4(g) est possible avec ou sans présence de l’O 2(g). Nous avons démontré que la surface d’inox joue un rôle important dans la décomposition de RuO4 qui peut aussi accélérer la réaction. Mots-clés: DFT, Mécanisme réactionnel, Énergie d'activation, Accident nucléaire, Iodure d’argent, Iodure de cadmium, Oxyde de ruthénium.. IV | Page © 2019 Tous droits réservés.. lilliad.univ-lille.fr.
(10) Thèse de Hao Hu, Université de Lille, 2019. TABLE OF CONTENTS. TABLE OF CONTENTS Acknowledgements ..................................................................................................... I Abstract ..................................................................................................................... III Résumé ..................................................................................................................... IV Table of Contents ....................................................................................................... V Table of Figures ......................................................................................................... IX Table of Tables ........................................................................................................ XIX. CHAPTER 1 Introduction ...................................................................................1 1.1 Presented Nuclear Power Plant (NPP) ..................................................................1 1.2 Severe Nuclear Accident .......................................................................................3 1.3 Radiological Consequences of Fission Products ...................................................5 1.4 Release and Transport of Fission Products ...........................................................7 1.5 Objective of Work ..................................................................................................8 1.5.1 Nature of the Substrate ................................................................................8 1.5.2 Structural model .........................................................................................10 1.5.3 Conclusion..................................................................................................12 Reference ..................................................................................................................14. CHAPTER 2 Methodology ................................................................................19 2.1 Theoretical context ..............................................................................................19 2.1.1 Schrödinger Equation .................................................................................19 2.1.2 Born-Oppenheimer Approximation .............................................................20 2.2 Density Functional Theory ...................................................................................21 2.2.1 Hohenberg-Kohn theorem ..........................................................................21. © 2019 Tous droits réservés.. Page | V lilliad.univ-lille.fr.
(11) Thèse de Hao Hu, Université de Lille, 2019. TABLE OF CONTENTS. 2.2.2 Kohn-Sham Method ...................................................................................22 2.2.3 Approximations to exchange correlation functional ....................................23 2.3 Transition state theory .........................................................................................28 2.3.1 Nudged elastic band method (NEB) ...........................................................29 2.4 Molecular Dynamics ............................................................................................31 2.4.1 Born-Oppenheimer Molecular Dynamics ....................................................31 2.4.2 Verlet Algorithm ..........................................................................................32 2.4.3 Ensemble and Thermostat .........................................................................33 2.5 Application in Our Work .......................................................................................34 2.5.1 Geometry Optimization ...............................................................................34 2.5.2 Energy and Thermodynamic Calculation ....................................................34 References ................................................................................................................37. CHAPTER 3 Reactivity of Iodine on Surface Nuclear Reactor Coolant System ....................................................................................................................41 3.1 Literature Review on Iodine .................................................................................41 3.1.1 Physical Properties of Iodine and Metal Iodide...........................................41 3.1.2 Behaviour of Iodine and Metal Iodide in Severe Accident Conditions ........44 3.2 Adsorption of AgI on chromium and iron oxide surfaces......................................51 3.2.1 Thermodynamic study ................................................................................51 3.2.2 Reactivity Study..........................................................................................57 3.2.3 Conclusion..................................................................................................65 3.3 Adsorption of CdI2 on chromium and iron oxide surfaces. ...................................65 3.3.1 Thermodynamic study ................................................................................65 3.3.2 Reactivity Study..........................................................................................71 3.3.3 Conclusion..................................................................................................77. VI | Page © 2019 Tous droits réservés.. lilliad.univ-lille.fr.
(12) Thèse de Hao Hu, Université de Lille, 2019. TABLE OF CONTENTS. 3.4 General Conclusion .............................................................................................77 Reference ..................................................................................................................79. CHAPTER. 4. Reactivity. of. Ruthenium. in. Severe. Accident. Conditions .............................................................................................................83 4.1 Literature Review on Ruthenium .........................................................................83 4.1.1 Physical Properties of Ruthenium and Ruthenium Oxides .........................84 4.1.2 Ruthenium Oxides Behaviour in Severe Accident Conditions ....................86 4.1.3 Conclusion..................................................................................................94 4.2 Adsorption of Ruthenium Oxides on Chromium and Iron Oxide Surfaces. ..........95 4.2.1 Thermodynamic Study ...............................................................................95 4.2.2 Reactivity Study........................................................................................ 109 4.2.3 Conclusion................................................................................................ 130 4.3 Adsorption of Dioxygen on Ruthenium Dioxide Aerosols................................... 131 4.3.1 Stability of Different RuO2 surfaces .......................................................... 131 4.3.2 Adsorption O2(g) on Different RuO2 Surfaces ............................................ 132 4.3.3 Re-Vaporization of Ruthenium Gaseous Species from Different Adsorbed RuO2 Surfaces .......................................................................................... 135 4.3.4 Conclusion and Perspective ..................................................................... 141 4.4 Conclusion ......................................................................................................... 141 Reference ................................................................................................................ 143. CHAPTER 5 General Conclusion and Perspectives ............................. 149 Reference ................................................................................................................ 152. Appendix ............................................................................................................. A.1. © 2019 Tous droits réservés.. Page | VII lilliad.univ-lille.fr.
(13) Thèse de Hao Hu, Université de Lille, 2019. TABLE OF CONTENTS. VIII | Page © 2019 Tous droits réservés.. lilliad.univ-lille.fr.
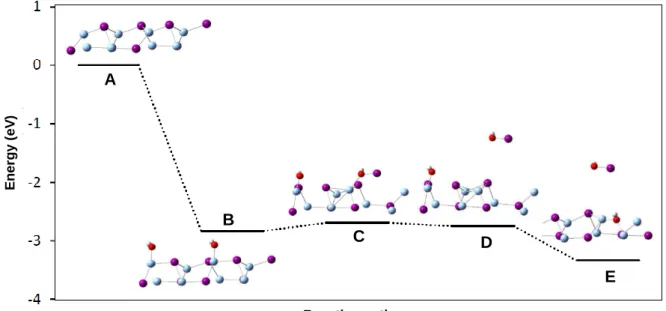
(14) Thèse de Hao Hu, Université de Lille, 2019. TABLE OF FIGURES. TABLE OF FIGURES Figure 1.1. Schematic presentation of Pressurized Water Reactor (PWR). ................2 Figure 1.2. International Nuclear Events Scale (INES) ...............................................3 Figure 1.3. Scheme of human being contamination following a release of radionuclides to environment. ............................................................................................................5 Figure 1.4. Physical-chemical phenomena occurring in the primary circuit in a severe accident .......................................................................................................................7 Figure 1.5. SEM surface micrographs in backscattered electrons at two different magnification (×500 and × 3000) of oxidized specimens at 1200°C in air for 20 seconds. ......................................................................................................................9 Figure 1.6. SEM images of 304L (a) before oxidation and after oxidation in air at (b) 750°C 24 h...................................................................................................................9 Figure 1.7. ToF-SIMS depth profiling on specimens after oxidation in air and steam atmospheres. Short line: CrO-; point: MnO-; line: FeO- ..............................................10 Figure 1.8. Theoretical models for the different chromium and iron oxide surfaces under different pressures, temperatures and atmospheres. (a) Cr 2O3Cr (neutral chromium oxide surface), (b) Chromyl (oxidized chromium oxide surface), (c) Cr2O3Cr2(OH)3 (hydrated chromium oxide surface), (d) Fe 2O3Fe (neutral iron oxide surface). Chromium: green. Iron: blue. Oxygen: red. Hydrogen: yellow. ...................12. Figure 2.1. Self-consistent Field (SCF) process .......................................................23 Figure 2.2. Schematic illustration of all-electron (solid lines) and pseudo-electron (dashed lines) potentials and their corresponding wave functions. The radius at which all-electron and pseudo-electron value match is designated 𝑟𝑐 ..................................26 Figure 2.3. Schematic illustration of equation of all-electron wave function. .............27 Figure 2.4. Schematic illustration of a reaction path .................................................29 Figure 2.5. The nudge-elastic band (NEB) method for locating transition states. .....29. © 2019 Tous droits réservés.. Page | IX lilliad.univ-lille.fr.
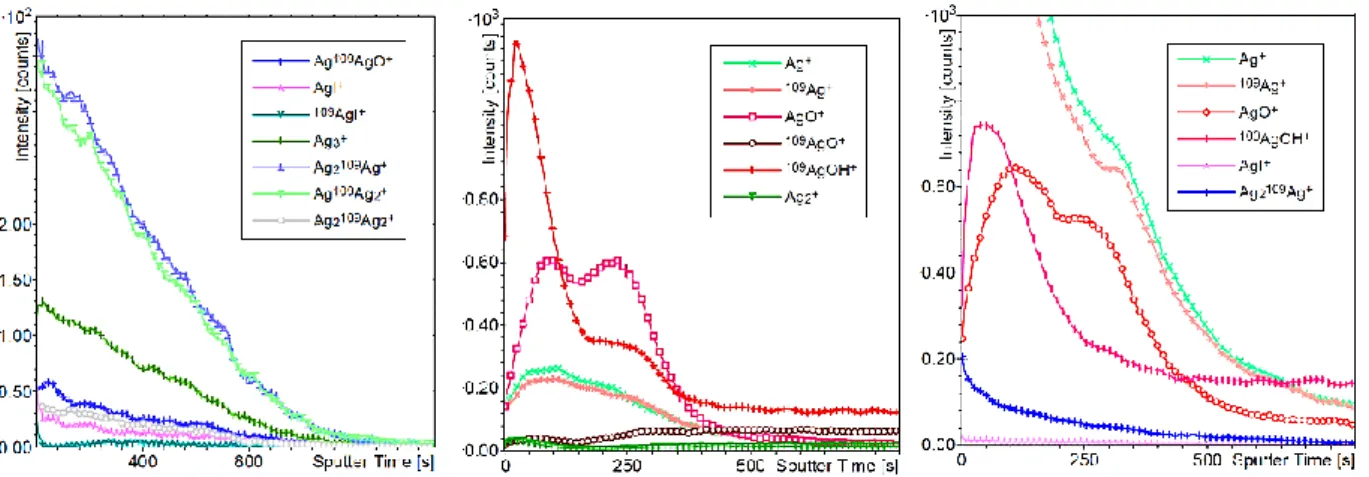
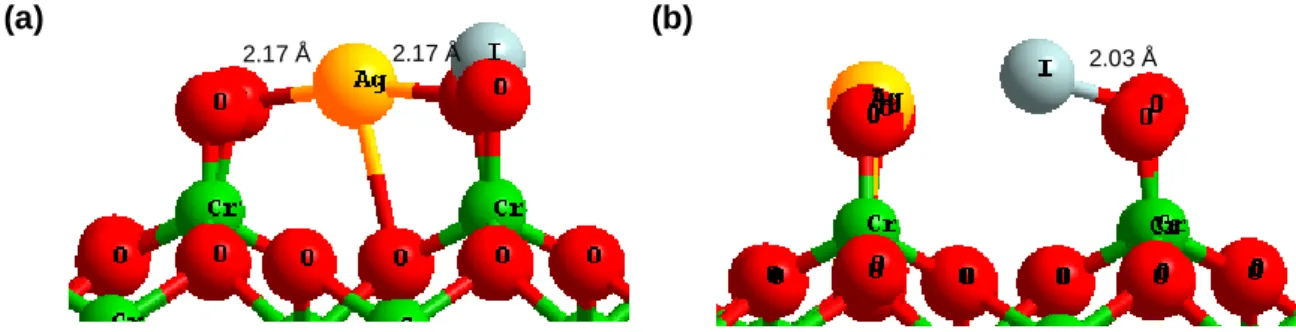
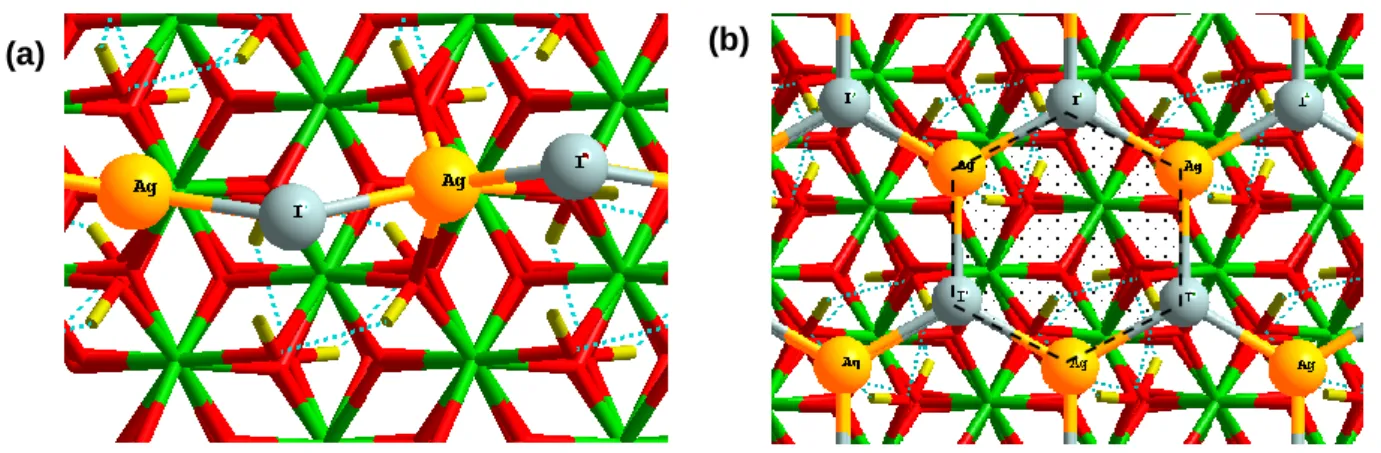
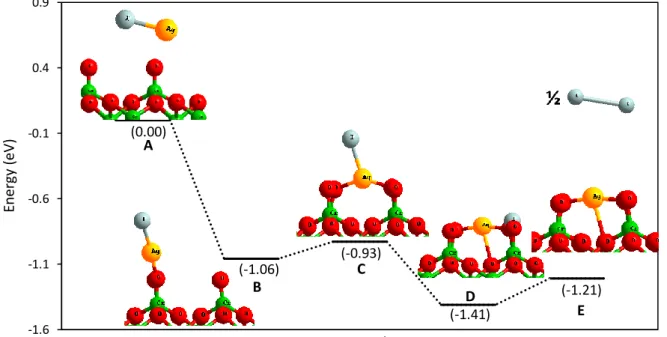
(15) Thèse de Hao Hu, Université de Lille, 2019. TABLE OF FIGURES. Figure 3.1. Iodine molecule (I2) in (a) solid form and (b) gas form. ...........................42 Figure 3.2. Silver iodide (AgI): (a) β-phase solid form (side view) (b) β-phase solid form (top view); (c) gas form. .............................................................................................43 Figure 3.3. Cadmium iodide (CdI2) molecule: (a) solid form (side view) (b) solid form (top view); (c) gas form. .............................................................................................43 Figure 3.4. Pressure evolution of the saturation vapour of AgI (line, circle) CdI 2 (short line, triangle) and I2 (point, square). ...........................................................................44 Figure 3.5. Paths of iodine from I– ion dissolved in solution to I2(g) in the air. ............46 Figure 3.6. Reaction pathway leading to the formation of IOH including the oxidizing the surface twice with two OH● (Ag, I, H and O are respectively coloured in bright blue, purple, red and white). ...............................................................................................48 Figure 3.7. Transport behaviour by (a) Resuspension (b) Re-entrainment (c) Revaporization (d) Re-volatilization. ...............................................................................49 Figure 3.8. ToF-SIMS profiles of Ag-containing ionic fragments for a re-vaporized cutting under (left) synthetic air (middle) argon/steam (%vol. 70/30) (right) air/steam (%vol. 20/80) at 750 °C..............................................................................................51 Figure 3.9. Tripod structure of AgI on the surface. Cr: green. O: red. Ag: yellow. I: grey. ..................................................................................................................................53 Figure 3.10. Side view adsorption of AgI on the Chromyl surface at 25% coverage (a) side bc (b) side ac. Chromium: green. Oxygen: red. Silver: yellow. Iodine: grey. ......54 Figure 3.11. Top view for adsorption of AgI at (a) 50% (b) 100% coverage on the Chromyl surface. Chromium: green. Oxygen: red. Silver: yellow. Iodine: grey. .........54 Figure 3.12. Top view for adsorption of AgI with (a) 50% (b) 100% coverage on the Cr2O3Cr2(OH)3 surface. Chromium: green. Oxygen: red. Silver: yellow. Iodine: grey. Hydrogen: light yellow................................................................................................55 Figure 3.13. a) Totally saturated hydrate chromium oxide surface (with six water molecules). b) AgI adsorbed on totally saturated hydrate chromium oxide surface. Cr: green. O: red. Ag: yellow. I: grey. H: light yellow. ......................................................56 Figure 3.14. Tripod structure of AgI on the surface. Fe: Blue. O: red. Ag: yellow. I: grey............................................................................................................................56. X | Page © 2019 Tous droits réservés.. lilliad.univ-lille.fr.
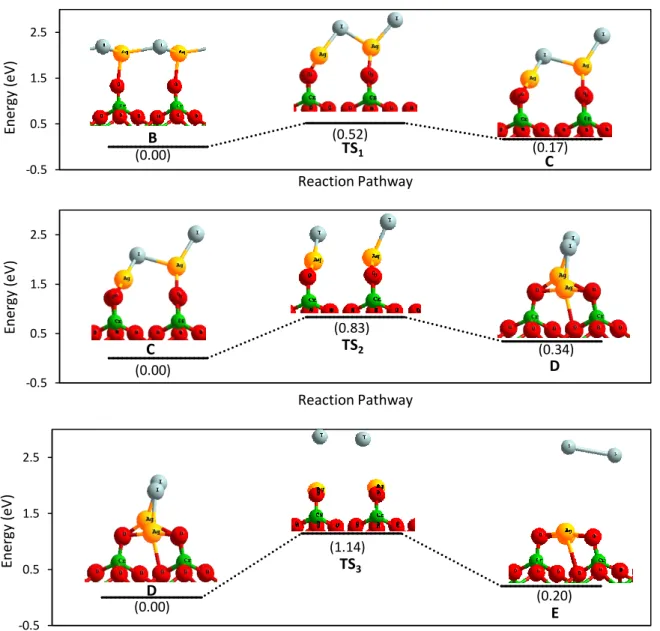
(16) Thèse de Hao Hu, Université de Lille, 2019. TABLE OF FIGURES. Figure 3.15. Bipod and chain structure of AgI on the surface. Fe: Blue. O: red. Ag: yellow. I: grey. H: light yellow. ....................................................................................56 Figure 3.16. Gibbs free energy for (black) formation of I 2(g) and (red) sublimation of AgI(g) on surfaces Cr2O3Cr and Fe2O3Fe with AgI coverage equal to (line) 25%, (short line) 50% and (point) 100% from 0 K to 1300 K. ........................................................59 Figure 3.17. Gibbs free energy for (black) formation of I 2(g) and (red) sublimation of AgI(g) on surfaces Chromyl with AgI coverage equal to (line) 25%, (short line) 50% and (point) 100% from 0 K to 1300 K. ..............................................................................60 Figure 3.18. Energy diagram for formation of I2(g) on Chromyl surface adsorbed by AgI at 25% coverage. Chromium: green. Oxygen: red. Silver: yellow. Iodine: grey. ........61 Figure 3.19. Energy diagram of transition states for formation of I 2(g) on Chromyl surface with AgI adsorbed with a coverage equal to 25%. (top) transition state from state C to D (down) transition state from state D to E. Chromium: green. Oxygen: red. Silver: yellow. Iodine: grey. ........................................................................................62 Figure 3.20. Energy diagram for formation of I2(g) on Chromyl surface adsorbed by AgI with coverage equal to 50%. Chromium: green. Oxygen: red. Silver: yellow. Iodine: grey............................................................................................................................63 Figure 3.21. Energy diagram of transition states for formation of I 2(g) on Chromyl surface with AgI adsorbed with a coverage equal to 50%. (top) transition state from state B to C (middle) transition state from state C to D (down) transition state from state D to E. Chromium: green. Oxygen: red. Silver: yellow. Iodine: grey. .........................64 Figure 3.22. (a) Tripod structure of CdI2 on the surface. (b)Top view for adsorption of CdI2 with 100% coverage on the Cr2O3Cr surface. Chromium: green. Oxygen: red. Cadmium: yellow. Iodine: grey...................................................................................68 Figure 3.23. Top view for adsorption of CdI2 with (a) 50% (b) 100% coverage on the Chromyl surface. Chromium: green. Oxygen: red. Cadmium: yellow. Iodine: grey. ...68 Figure 3.24. Top view for adsorption of CdI2 with (a) 50% (b) 100% coverage on the Cr2O3Cr2(OH)3 surface. Chromium: green. Oxygen: red. Cadmium: yellow. Iodine: grey. Hydrogen: light yellow. ......................................................................................69 Figure 3.25. a) Totally saturated hydrated chromium oxide surface (with six water molecules). b) CdI2 adsorbed on totally saturated hydrated chromium oxide surface.. © 2019 Tous droits réservés.. Page | XI lilliad.univ-lille.fr.
(17) Thèse de Hao Hu, Université de Lille, 2019. TABLE OF FIGURES. Chromium: green. Oxygen: red. Cadmium: yellow. Iodine: grey. Hydrogen: light yellow. ..................................................................................................................................70 Figure 3.26. (a) Tripod structure of CdI2 on the surface. (b)Top view for adsorption of CdI2 with 100% coverage on Fe2O3Fe surface. Iron: blue. Oxygen: red. Cadmium: yellow. Iodine: grey. ...................................................................................................70 Figure 3.27. Gibbs free energy for (black) formation of I 2(g) and (red) sublimation of CdI2(g) on surfaces Cr2O3Cr and Fe2O3Fe with CdI2 coverage equal to (line) 25%, (short line) 50% and (point) 100% from 0 K to 1300 K. ........................................................73 Figure 3.28. Gibbs free energy for (black) formation of I 2(g) and (red) sublimation of CdI2(g) on surfaces Chromyl with coverage of CdI2 equal to (line) 25%, (short line) 50% and (point) 100% from 0 K to 1300 K.........................................................................74 Figure 3.29. Energy diagram for formation of I2(g) on Chromyl surface adsorbed by CdI2 with coverage equal to 25%. Chromium: green. Oxygen: red. Cadmium: yellow. Iodine: grey............................................................................................................................75 Figure 3.30. Energy diagram of transition states for formation of I 2(g) on Chromyl surface with CdI2 adsorbed with coverage equal to 25%. (top) transition state from state B to C (down) transition state from state C to D. Chromium: green. Oxygen: red. Cadmium: yellow. Iodine: grey...................................................................................76. Figure 4.1. Crystal model for metallic ruthenium. ......................................................84 Figure 4.2. Theoretical models for ruthenium oxides molecules: (a) ruthenium monoxide (gas) (b) ruthenium dioxide (solid) (c) ruthenium dioxide (gas) (d) ruthenium trioxide (gas) (e) ruthenium tetroxide (gas). Ruthenium: yellow; Oxygen: red. ..........85 Figure 4.3. (Left) Ruthenium species at thermodynamic equilibrium in air at 1 bar pressure. (Right) Ruthenium species at thermodynamic equilibrium in 50wt% air-steam mixture. ......................................................................................................................90 Figure 4.4. Theoretical model for RuO2 (1 1 0) surface. Respectively, the directions a, b, and c are [0 0 1], [-1 1 0] and [1 1 0]. The definitions for different special sites (Ru br, Rucus, Obr and O3f) are indicated in the figure. Ruthenium: yellow. Oxygen: red. .......91. XII | Page © 2019 Tous droits réservés.. lilliad.univ-lille.fr.
(18) Thèse de Hao Hu, Université de Lille, 2019. TABLE OF FIGURES. Figure 4.5. XPS spectra of Ru 3d core level lines: (a) on a clean metallic sample, (b) of anhydrous RuO2, (c) of hydrated RuO2·xH2O, (d) of a ruthenium layer deposited on a piece of stainless steel............................................................................................93 Figure 4.6. Tripod structure of RuO2 on the surface. Cr: green. O: red. Ru: yellow. .97 Figure 4.7. Side view for adsorption direct of RuO 2 with (a) 25 % and (b) 100 % coverage on the Chromyl surface. Chromium: green. Oxygen: red. Ruthenium: yellow. ..................................................................................................................................98 Figure 4.8. a) Totally saturated hydrate chromium oxide surface (with six water molecules). b) RuO2 adsorbed on totally saturated hydrate chromium oxide surface. Chromium: green. Oxygen: red. Ruthenium: yellow. Hydrogen: light yellow. ............99 Figure 4.9. Tripod structure of RuO2 on the surface. Fe: Blue. O: red. Ru: yellow. ...99 Figure 4.10. Tripod structure of RuO3 on the surface. Cr: green. O: red. Ru: yellow....................................................................................................................... 101 Figure 4.11. Top view for adsorption of RuO3 with (a) 50% (b) 100% coverage and (c) side view for adsorption of RuO3 with 100% coverage on the Cr2O3Cr surface. Chromium: green. Oxygen: red. Ruthenium: yellow. ............................................... 101 Figure 4.12. RuO3 adsorbed on totally saturated hydrate chromium oxide surface with (a) 25% and (b) 50% coverage. Chromium: green. Oxygen: red. Silver: yellow. Iodine: grey. Hydrogen: light yellow. .................................................................................... 102 Figure 4.13 Tripod structure of RuO3 on the surface. Fe: Blue. O: red. Ru: yellow. 103 Figure 4.14. Top view for adsorption of RuO3 with (a) 50% (b) 100% coverage and (c) side view for adsorption of RuO3 with 100% coverage on the Fe2O3Fe surface. Iron: Blue. Oxygen: red. Ruthenium: yellow. .................................................................... 103 Figure 4.15. Configuration of RuO4 on the surface. Cr: green. O: red. Ru: yellow. . 105 Figure 4.16. Top view for adsorption of RuO4 with (a) 50% (b) 100% coverage and (c) side view for adsorption of RuO4 with 50% and 100% coverage on the Cr2O3Cr surface. Chromium: green. Oxygen: red. Ruthenium: yellow. ............................................... 105 Figure 4.17. RuO4 adsorbed on totally saturated hydrate chromium oxide surface for (a) 25% and (b) 50% coverage. Chromium: green. Oxygen: red. Ruthenium: yellow. Hydrogen: light yellow.............................................................................................. 106. © 2019 Tous droits réservés.. Page | XIII lilliad.univ-lille.fr.
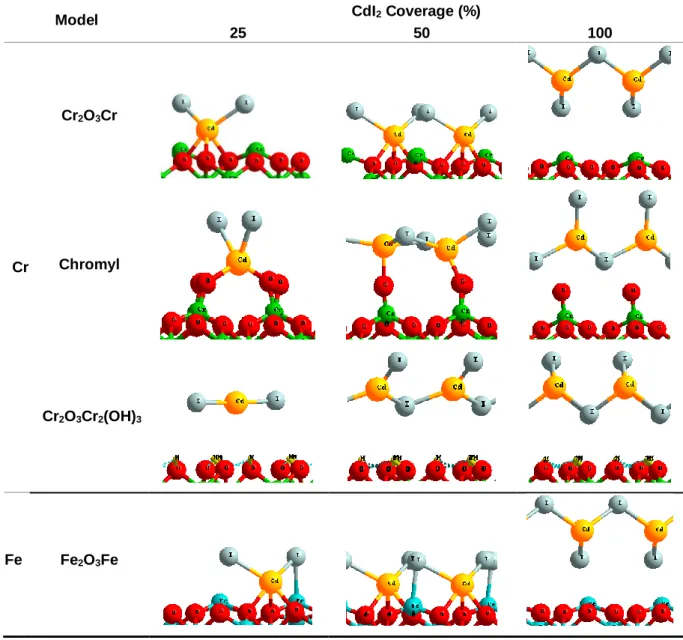
(19) Thèse de Hao Hu, Université de Lille, 2019. TABLE OF FIGURES. Figure 4.18. Configuration of RuO4 on the surface. Fe: blue. O: red. Ru: yellow. ... 107 Figure 4.19. Top view for adsorption of RuO4 with (a) 50% (b) 100% coverage and (c) side view for adsorption of RuO4 with 50% and 100% coverage on the Fe 2O3Fe surface. Iron: Blue. Oxygen: red. Ruthenium: yellow. .............................................. 107 Figure 4.20. Gibbs free energy for (black) decomposition of RuO3 and (red) sublimation of RuO3(g) on surfaces Cr2O3Cr and Fe2O3Fe with a coverage of RuO3 equal to (line) 25%, (short line) 50% and (point) 100% from 0 K to 1300 K. ............ 111 Figure 4.21. Gibbs free energy for (black) decomposition of RuO3 and (red) sublimation of RuO3(g) on Chromyl surfaces with a coverage of RuO3 equal to (line) 25%, (short line) 50% and (point) 100% from 0 K to 1300 K. .................................. 112 Figure 4.22. Gibbs free energy for (black) decomposition of RuO 4 into RuO2, (blue) decomposition of RuO4 into RuO3 and (red) sublimation of RuO4(g) on Cr2O3Cr2(OH)3 with a coverage of RuO4 equal to (line) 25%, (short line) 50% and (point) 100% from 0 K to 1300 K. ............................................................................................................. 116 Figure 4.23. Gibbs free energy for (black) decomposition of RuO 4 into RuO2, (blue) decomposition of RuO4 into RuO3 and (red) sublimation of RuO4(g) on Cr2O3Cr surfaces with a coverage of RuO4 equal to (line) 25%, (short line) 50% and (point) 100% from 0 K to 1300 K. ............................................................................................................. 116 Figure 4.24. Gibbs free energy for (black) decomposition of RuO4 into RuO2, (blue) decomposition of RuO4 into RuO3 and (red) sublimation of RuO4(g) on surfaces Fe2O3Fe with a coverage of RuO4 equal to (line) 25%, (short line) 50% and (point) 100% from 0 K to 1300 K......................................................................................... 117 Figure 4.25 Energy diagram for decomposition of RuO4(g) on Cr2O3Cr surface adsorbed by RuO4 with coverage equal to (Top) 50% and (Bottom) 100%. Chromium: green. Oxygen: red. Ruthenium: yellow. .................................................................. 118 Figure 4.26. Energy diagram decomposition of RuO4(g) on Fe2O3Fe surface adsorbed by RuO4 with a coverage equal to (top) 25% and (bottom) 50%. Iron: blue. Oxygen: red. Ruthenium: yellow. ........................................................................................... 119 Figure 4.27. Gibbs free energy for (black) sublimation of RuO 2(g), (red) re-vaporization of RuO4(g) and (green) re-vaporization of RuO3(g) on surfaces Chromyl with a coverage. XIV | Page © 2019 Tous droits réservés.. lilliad.univ-lille.fr.
(20) Thèse de Hao Hu, Université de Lille, 2019. TABLE OF FIGURES. of RuO2 equal to (line) 25%, (short line) 50% and (point) 100% from 0 K to 1300 K. ............................................................................................................................. 123 Figure 4.28. Energy diagram of the re-vaporization RuO4(g) from RuO2 adsorbed on Chromyl surface with coverage equal to 25%. Chromium: green. Oxygen: red. Ruthenium: yellow. .................................................................................................. 124 Figure 4.29. Energy diagram of the transition states for re-vaporization of RuO4(g) from RuO2 adsorbed on a Chromyl surface with a coverage equal to 25%. (Top) transition state from state B to C (Bottom) transition state from state C to D. Chromium: green. Oxygen: red. Ruthenium: yellow. ............................................................................. 125 Figure 4.30. Energy diagram of the re-vaporization RuO4(g) on from RuO2 adsorbed on Chromyl surface with coverage equal to 50%. Chromium: green. Oxygen: red. Ruthenium: yellow. .................................................................................................. 126 Figure 4.31. Energy diagram of transition states for re-vaporization of RuO4(g) from RuO2 adsorbed on Chromyl surface with a coverage equal to 50%. (Top) transition state from state B to C (middle) transition state from state C to D (Bottom) transition state from state D to E. Chromium: green. Oxygen: red. Ruthenium: yellow. .......... 127 Figure 4.32. Energy diagram of the re-vaporization RuO3(g) from RuO2 adsorbed on a Chromyl surface with coverage equal to 100 %. Chromium: green. Oxygen: red. Ruthenium: yellow. .................................................................................................. 128 Figure 4.33. Energy diagram of the transition states for the re-vaporization of RuO3(g) from RuO2 adsorbed on a Chromyl surface with a coverage equal to 100%. (Top) transition state from state B to C (middle, top) transition state from state C to D (middle, bottom) transition state from state D to E (Bottom) transition state from state E to F. Cr: green. O: red. Ru: yellow. .................................................................................. 129 Figure 4.34. Theoretical model for RuO2 surfaces. (Left)(a) [1 1 0] (b) [1 0 0] (c) [0 0 1] (d) [1 1 1]. (Right) The definitions of different special sites (Ru br, Rucus, Obr and O3f) for the most stable surface [1 1 0] are indicated in the figure. Ruthenium: yellow. Oxygen: red. ............................................................................................................ 132 Figure 4.35. The Ru-O-O-Ru bridge structure in surface totally covered by O 2 who is found in literature. Ru: yellow. O: red. Adsorbed O: light blue. ................................ 134. © 2019 Tous droits réservés.. Page | XV lilliad.univ-lille.fr.
(21) Thèse de Hao Hu, Université de Lille, 2019. TABLE OF FIGURES. Figure 4.36. Systems used in Molecular Dynamics (left) molecular adsorption and (right) dissociative adsorption of dioxygen molecule on [0 0 1] ruthenium dioxide surface with a coverage of O2 equal to 25%.t = 0 fs. Ruthenium: yellow; Oxygen: red. Adsorbed oxygen atom: light blue. .......................................................................... 136 Figure 4.37. Variation of total energy during Meta Molecule Dynamic simulation with Slow-growth approach for ruthenium gaseous species from surface with dioxygen molecule adsorbed associative on [0 0 1] ruthenium dioxide surface from t = 0 to 20 000 fs. ...................................................................................................................... 137 Figure 4.38. Configurations corresponding to stationary points for re-vaporization of ruthenium gaseous species from surface with dioxygen molecule adsorbed associative on [0 0 1] ruthenium dioxide surface. (Left) Transition state (TS): t ≈ 6 000 fs. (Middle) state B: t ≈ 12 000 fs. (Right) state C: t ≈ 20 000 fs. Ru: yellow; O: red. Adsorbed O: light blue. ................................................................................................................. 138 Figure 4.39. Variation of total energy during Meta Molecule Dynamic simulation with Slow-growth approach for ruthenium gaseous species from surface with dioxygen molecule adsorbed dissociative on [0 0 1] ruthenium dioxide surface from t = 0 to 20 000 fs. ...................................................................................................................... 139 Figure 4.40. Configurations corresponding to stationary points for re-vaporization of ruthenium gaseous species from surface with dioxygen molecule adsorbed dissociative on [0 0 1] ruthenium dioxide surface. (Left) Transition State (TS): t ≈ 6 000 fs. (Middle) state B: t ≈ 10 000 fs. (Right) state C: t ≈ 20 000 fs. Ru: yellow; O: red. Adsorbed O: light blue. ............................................................................................ 140. Figure A.1. Adsorption of AgI with (a) 25% (b) 50% (c) 75% and (d)100% coverage adsorbed on totally saturated hydrated chromium oxide surface (with six water molecules). .............................................................................................................. A.1 Figure A.2. Adsorption of CdI2 with (a) 25% (b) 50% (c) 75% and (d)100% coverage adsorbed on totally saturated hydrated chromium oxide surface (with six water molecules).. ............................................................................................................. A.2. XVI | Page © 2019 Tous droits réservés.. lilliad.univ-lille.fr.
(22) Thèse de Hao Hu, Université de Lille, 2019. TABLE OF FIGURES. Figure A.3. Adsorption of RuO2 with (a) 25% (b) 50% (c) 75% and (d)100% coverage adsorbed on totally saturated hydrated chromium oxide surface (with six water molecules). .............................................................................................................. A.3 Figure A.4. Adsorption of RuO3 with (a) 25% (b) 50% (c) 75% and (d)100% coverage adsorbed on totally saturated hydrated chromium oxide surface (with six water molecules).. ............................................................................................................. A.4 Figure A.5. Adsorption of RuO4 with (a) 25% (b) 50% (c) 75% and (d)100% coverage adsorbed on totally saturated hydrated chromium oxide surface (with six water molecules). .............................................................................................................. A.5 Figure A.6. Density of states for d orbitals of reference molecules (top) RuO 4 (middle) RuO3 (bottom) RuO2. ............................................................................................... A.6 Figure A.7. Density of states for d orbitals for most stable structure of RuO 2 adsorbed on Chromyl surface with 25% of coverage (top) alpha (bottom) beta. ..................... A.7 Figure A.8. Density of states for d orbitals for most stable structure of RuO 3 adsorbed on Chromyl surface with 25% of coverage (top) alpha (bottom) beta. ..................... A.8 Figure A.9. Variation of temperature during Meta Molecule Dynamic simulation with Slow-growth approach for associative adsorption of dioxygen molecule on [0 0 1] ruthenium dioxide surface.t = 0 to 20 000 fs. ........................................................... A.9 Figure A.10. Variation of temperature during Meta Molecule Dynamic simulation with Slow-growth approach for associative adsorption of dioxygen molecule on [0 0 1] ruthenium dioxide surface.t = 0 to 20 000 fs. ........................................................... A.9. © 2019 Tous droits réservés.. Page | XVII lilliad.univ-lille.fr.
(23) Thèse de Hao Hu, Université de Lille, 2019. TABLE OF FIGURES. XVIII | Page © 2019 Tous droits réservés.. lilliad.univ-lille.fr.
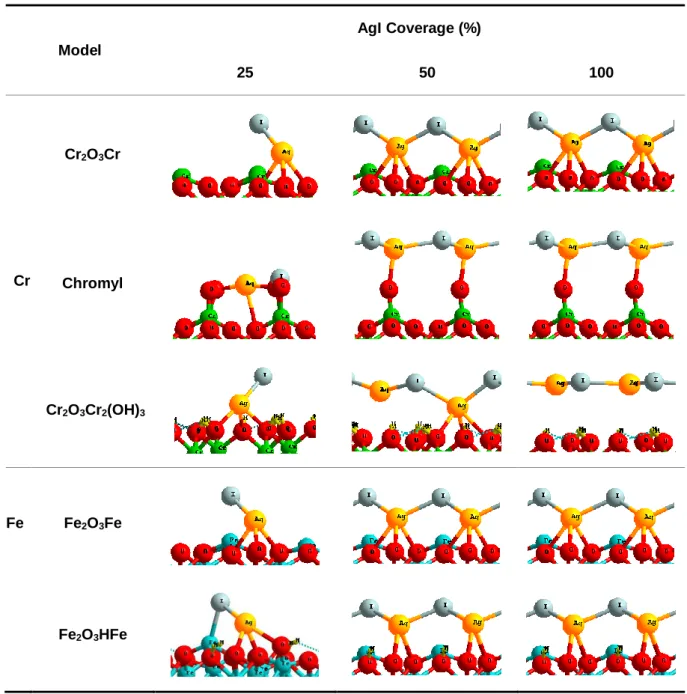
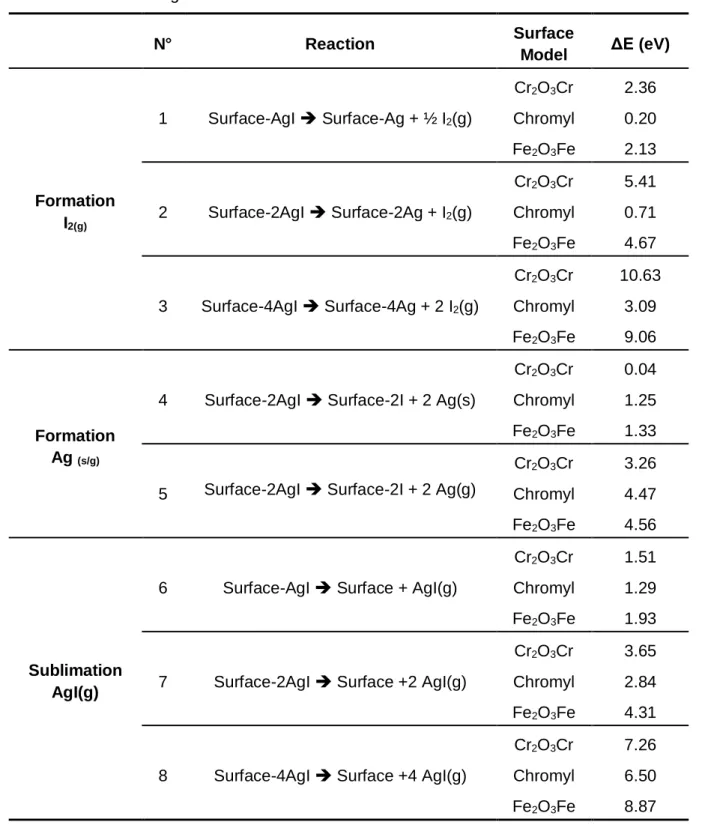
(24) Thèse de Hao Hu, Université de Lille, 2019. TABLE OF TABLES. TABLE OF TABLES Table 1.1. Isotopes released by Nuclear Accidents in PBq.(PBq=1015Bq) ..................4 Table 1.2. Physical and toxicological characteristics of certain fission products. ........5 Table 1.3. Fission-product classification and possible chemical states in irradiated UO 2 fuel rods .......................................................................................................................6. Table 3.1. Residual quantities of I, Ag, Mn, Cr and Fe after re-vaporization of AgI deposition in different atmospheric conditions (XPS quantitative analysis, %at.) after treatment at 750°C ....................................................................................................50 Table 3.2. Adsorption of AgI on chromium and iron oxide surfaces in function of its coverage. Chromium: green. Iron: blue. Oxygen: red. Hydrogen: light yellow. Silver: yellow. Iodine: grey. ...................................................................................................52 Table 3.3. Adsorption energy per AgI, for different coverages, on chromium and iron oxide surfaces. ..........................................................................................................53 Table 3.4. Formation energy of I2(g) and Ag (s/g) and sublimation energy of AgI(g) from different surface models with AgI adsorbed. ..............................................................58 Table 3.5. Formation energy of I2(g) on chromium oxide and iron oxide surface with AgI adsorbed in presence of oxidants (OH●)....................................................................65 Table 3.6. Adsorption of CdI2 on chromium and iron oxide surfaces in function of its coverage. Chromium: green. Iron: blue. Oxygen: red. Cadmium: yellow. Iodine: grey............................................................................................................................66 Table 3.7. Adsorption energy per CdI2 adsorbed for different CdI2 coverage on chromium and iron oxide surfaces. ............................................................................67 Table 3.8. Formation energy of I2(g) and Cd. (s/g). and sublimation energy of CdI2(g) from. different surface models with CdI2 adsorbed. ............................................................72 Table 3.9. Formation energy of I2(g) on oxide chromium and oxide iron surface with CdI2 adsorbed in presence of oxidants (OH●). ...........................................................77. © 2019 Tous droits réservés.. Page | XIX lilliad.univ-lille.fr.
(25) Thèse de Hao Hu, Université de Lille, 2019. TABLE OF TABLES. Table 4.1. Chemical steps leading to RuO4(g) decomposition with or without steam. 87 Table 4.2. Standard enthalpies of formation ∆fH° (298 K) of ruthenium and ruthenium oxides in kJ/mol .........................................................................................................88 Table 4.3. Adsorption of RuO2 on chromium and iron oxide surfaces in function of coverage. Chromium: green. Iron: blue. Oxygen: red. Hydrogen: light yellow. Ruthenium: yellow. ....................................................................................................96 Table 4.4. Adsorption energy per RuO2 adsorbed for different coverages on chromium and iron oxide surfaces..............................................................................................97 Table 4.5. Adsorption of RuO3 on chromium and iron oxide surfaces in function of coverage. Chromium: green. Iron: blue. Oxygen: red. Hydrogen: light yellow. Ruthenium: yellow. .................................................................................................. 100 Table 4.6. Adsorption energy per RuO3 adsorbed for different coverages of RuO 3 on chromium and iron oxide surfaces. .......................................................................... 101 Table 4.7. Adsorption of RuO4 on chromium and iron oxide surfaces in function of coverage. Chromium: green. Iron: blue. Oxygen: red. Hydrogen: light yellow. Ruthenium: yellow. .................................................................................................. 104 Table 4.8. Adsorption energy per RuO4 adsorbed for different coverages of RuO4 on chromium and iron oxide surfaces. .......................................................................... 105 Table 4.9. Electron charge on ruthenium atom for some interested configurations and reference species. ................................................................................................... 108 Table 4.10. Energy for decomposition and sublimation of RuO 3 on different surfaces. .................................................................................................................. 110 Table 4.11. Energy for decomposition of RuO4(g) and sublimation of RuO4(g) from different surfaces with RuO4 adsorbed at 0 K. ......................................................... 114 Table 4.12. Energy for re-vaporization of RuO3(g) and RuO4(g) from different surfaces with RuO2 adsorbed under presence of O2(g). .......................................................... 121. XX | Page © 2019 Tous droits réservés.. lilliad.univ-lille.fr.
(26) Thèse de Hao Hu, Université de Lille, 2019. TABLE OF TABLES. Table 4.13. Energy for re-vaporization of RuO3(g) and RuO4(g) and sublimation of RuO2(g) from Chromyl surfaces with RuO2 adsorbed without O2(g). .......................... 122 Table 4.14. Surface energy for different surface RuO2............................................ 131 Table 4.15. Most stable structures for molecular and dissociative adsorption of O2(g) on different RuO2 surfaces and adsorption energy per O 2 adsorbed in electron volt. Ruthenium: yellow. Oxygen: red. Adsorbed oxygen atom: light blue. ...................... 133. © 2019 Tous droits réservés.. Page | XXI lilliad.univ-lille.fr.
(27) Thèse de Hao Hu, Université de Lille, 2019. TABLE OF TABLES. XXII | Page © 2019 Tous droits réservés.. lilliad.univ-lille.fr.
(28) Thèse de Hao Hu, Université de Lille, 2019. CHAPTER 1. T. INTRODUCTION. he global warming is clearly observed since the beginning of the 20th century, origin is the industrial revolution, though the increase of earth, water and air. temperature. This temperature increase will have important consequences: increase of extreme weather events, rise of ocean levels (disappearance of coasts and island), glacier ablation, changes on ecology system which also may have an influence on biodiversity. In Fifth Assessment Report of the Intergovernmental Panel on Climate Change (IPCC), it was concluded that "It is extremely likely that human influence has been the dominant cause of the observed warming since the mid-20th century."1 Greenhouse gas effect is one of the initial main causes of global warming. Carbon dioxide, nitrous oxide and fluorinated gases (such as: hydrofluorocarbons, perfluorocarbons, sulfur hexafluoride and nitrogen trifluoride) are all greenhouse gases. One of the most important causes of carbon dioxide emission is through electricity production. Therefore, an energy source with small CO2 emission and a low cost should be chosen for ecological and economic reasons. A Nuclear Power Plant (NPP) seems to be a good example for producing a worthy energy as it releases less CO2 at cheaper cost than fossil fuel based energy plants.2 However, there is important disadvantages for Nuclear Power Plant (NPP). In the worst situation, a severe nuclear accident can lead to significant radiological consequences. These consequences are due to radiotoxic compounds, in particular fission products (FPs), which may be released in the atmosphere. They will be released from degraded fuels, and then be transported in the primary circuit, to finally reach the containment building. FPs releases in the environment result from natural leakages and from the venting procedure if it is operated.3 Depending on their half-life and their chemical evolution, some isotopes, such as. 131. I,. 103. Ru and. 106. Ru are especially dangerous due to their high volatility and. important radiological consequences. 4. 1.1 PRESENTED NUCLEAR POWER PLANT (NPP) A Nuclear Power Plant (NPP) is a thermal power station where the fissile fuel is used as a heat source. The heat is produced by the fission reaction of nuclei. © 2019 Tous droits réservés.. 235. U and 239Pu. Page | 1 lilliad.univ-lille.fr.
(29) Thèse de Hao Hu, Université de Lille, 2019. INTRODUCTION. and is used to generate the steam. Most NPP in the world are Light-Water Reactor (LWR). They can be separated in two categories: one generate directly steam in the reactor (Boiling Water Reactor/ BWR) and the other one generate the steam in a secondary loop whose water is heated by the primary system via a heat exchanger called “steam generator” (Pressurized Water Reactor/ PWR). All the reactor in France are PWRs.5. Figure 1.1. Schematic presentation of Pressurized Water Reactor (PWR).6. More in details, a Pressurized Water Reactor (PWR) is represented in Figure 1.1. The fuel rods are made by a corrosion-resistant alloy where the fission reactions of 235U or 239. Pu occur and produce heat. Fission reactions of 235U and 239Pu give new fragments. that contain at least one radioactive daughter nuclei. These new fragments and their daughters are called fission products (FPs) and they continue to disintegrate until stable nuclei are formed. Water in the primary core cooling system [also called primary circuit, or reactor cooling system (RCS)] extracts the heat generated by the nuclear core (around 300°C) to the secondary cooling system. In the secondary cooling system, steam will be produced through a heat exchanger (exchange heat from the primary circuit with the secondary circuit), then the steam will drive the turbine and produce electricity. In the end, the steam in the second cooling system will be condensed by cold water from the cooling tower and then reutilized for the generation of electric power.. 2 | Page © 2019 Tous droits réservés.. lilliad.univ-lille.fr.
(30) Thèse de Hao Hu, Université de Lille, 2019. Severe Nuclear Accident. As the fission products are highly radioactive, three barriers present inside a NPP in order to avoid the leaks of FPs to environment. The first barrier is constituted by sheaths made by Zircaloy that contains the fuel pellets. However, there is still some defects who can allow very small amount of the FPs entry into the primary circuit. The second barrier is the closed primary circuit that allows the exchange of heat between the nuclear core and the secondary circuit. The third barrier is the nuclear containment building that contains both the nuclear core and the primary circuit. This building, made by concrete, can resist to high internal pressure and should confine FPs in case of a break occurring to the primary circuit.. 1.2 SEVERE NUCLEAR ACCIDENT A severe nuclear accident can lead to significant consequences to the population and the environment. According to their severity and impact on environment and human being, nuclear incidents and accidents are classified into seven levels (International Nuclear Events Scale/ INES; Figure 1.2) by International Atomic Energy Agency (IAEA).. Figure 1.2. International Nuclear Events Scale (INES). Nowadays, three serious accidents have been occurred by Light-Water Reactors (LWR).. © 2019 Tous droits réservés.. Page | 3 lilliad.univ-lille.fr.
(31) Thèse de Hao Hu, Université de Lille, 2019. INTRODUCTION. . 1979: Three Mile Island accident (USA) Level 5 (PWR). . 1986: Chernobyl accident (ex-USSR) Level 7 (RBMK reactor design, sort of specific BWR). . 2011: Fukushima accident (Japan) Level 7 (BWR). In a severe accident, the fuel is not enough cooled down and can melt with emission of large amounts of fission products (FPs) and leading to significant amounts of radioactive FPs released to environment [called “Source Term” (ST)]. Table 1.1 gives part the radioactivity released into the atmosphere during the two major accidents. It can be noticed that a large activity due to Cs and I isotopes is liberated. Furthermore, ruthenium isotopes were also detected. In Chernobyl accident, Ru isotopes and. 131. I. and 137I are responsible for similar radioactive activity in air and on the ground.7,8 106Ru is also observed in the Fukushima accident, with a. 106. Ru/137Cs activity ratio around. 0.07-0.2 in water.9 Table 1.1. Isotopes released during Nuclear Accidents in Pbq.10 (PBq=1015Bq) Nuclide. Half life. Chernobyl. Fukushima. Factor difference. 134. 2.0 y. 85. 12. ×7. 137. 30 y. 85. 12. ×7. 129. 1.6 × 10⁷ y. 45 × 10-6. 5.7 × 10⁻⁶. ×8. 131. 8d. 1 760. 150. × 12. 133. Cs Cs I I I. 21 h. 910. 146. ×6. 132. Te. 3.2 d. ~ 1 150. ~ 180. ×6. 129. 34 d. 240. 15. × 16. Te. Source terms during an accident can be dispersed widely. For the accident of Chernobyl, during the 10-day period of maximum release (between April 26 and May 6, 1986), volatile radionuclides were broadly dispersed over Europe and the all northern hemisphere.7,11,12 At 8 000 km from Chernobyl (Hiroshima, Japan), a relatively important quantity of nuclides was detected.13 According to the type of accident and location, radionuclides can be transported by sea and by air14 over large areas. During this accident, more than 80% of FPs are solubilized into the ocean.15 35. S radioactivity has even been measured in California and has been supposed to. come from Fukushima Nuclear Plant.16. 4 | Page © 2019 Tous droits réservés.. lilliad.univ-lille.fr.
(32) Thèse de Hao Hu, Université de Lille, 2019. Radiological Consequences of Fission Products. 1.3 RADIOLOGICAL CONSEQUENCES OF FISSION PRODUCTS The releases of fission products to the environment can lead to important radiological consequences. Radionuclides disintegrate more or less rapidly according to their stability. During disintegration, ionizing radiation and energy are emitted and can damage biological tissues. However, the radiotoxicity depends on the type of isotopes, their activity, the type of radiation and energy released. The physical and toxicological characteristic of fission products, that will be studied, are listed in Table 1.2. The possible pathway for human being contamination following a release of radionuclides to environment is shown in Figure 1.3. Table 1.2. Physical and toxicological characteristics of certain fission products. 17. Radionuclide. Emission. Half-life (d). 131. I. 𝛽− , 𝛾. 8.04. 4.6 × 10¹⁵. 2.92 × 10⁻⁷ (Thyroid). 103. Ru. 𝛽−. 39.3. 1.19 × 10¹⁵. 7.3 × 10⁻¹⁰ (Colon). 106. 𝛽. 368.2. 1.24 × 10¹⁴. 7.0 × 10⁻⁹ (Colon). Ru. Mass Activity DPUI* public inhalation (Sv/Bq) (Bq/g) (Target organ). *DPUI: dose per unit intake.. Figure 1.3. Scheme of human being contamination following a release of radionuclides to environment.. © 2019 Tous droits réservés.. Page | 5 lilliad.univ-lille.fr.
(33) Thèse de Hao Hu, Université de Lille, 2019. INTRODUCTION. In Table 1.3, fission products, in which we are interested, and their possible chemical states are sorted depending on the effect on human beings and environment. Iodine will be either released as metallic iodide aerosols (for example: AgI, CsI, CdI2 etc.) or,as gaseous iodine (I2 (g) and CH3I (g)).18,19 131I is the radionuclides that have the most significant impact on the exposed population at short term.20 It can be easily deposited into humans’ thyroid. From a radiological point of view, toxicity group while. 103. Ru belongs to the medium. 106. Ru has high toxicity.17 The metallic Ru behaves in the human. body in a similar way as the other platinum group metals meanwhile volatile ruthenium (RuO4 (g)) can be deposited into the lungs or throat after inhalation. 21 In Chernobyl case, volatile iodine and ruthenium aerosols of microscopic size have been produced. They had high mobility and travel up to 1400-1800 km22 from the nuclear plant. Iodine may have severe impact on environment especially as it may react with the atmospheric species23 to form numerous volatile species or fine particles after nucleation processes. The main toxicity of ruthenium is due to the deposition of fission products on skin.24 Table 1.3. Fission-product classification and possible chemical states in irradiated UO 2 fuel rods25 Class. Fission Products. Chemical State*. 1. Xe, Kr. Xe, Kr. 2. I, Br. Single phase halide solution CsI, I, I2. 3. Cs, Rb. Cs, CsI, Cs2UO3.56, Cs2UO4, Cs2Te, Cs2MoO4. 4. Te, Sb. Single phase chalcogenide solution Cs 2Te. 5. Ba, Sr. Oxides which can dissolve to some extent in the fuel and form separate phases BaO, Ba2(Zr –U-Pu)O3. 6. Mo. Single phase metallic alloy, MoO2, Cs2MoO4. 7. Tc, Ru, Rh, Pd. Single phase metallic alloy. 8. La, Y, Zr, Nb, lanthanides, actinides Oxides which dissolve in fuel. 9. Ag, Cd, In, Sn, Sb. Not determine really. * Principle element used as surrogate for other members of the group of fission products. 1.4 RELEASE AND TRANSPORT OF FISSION PRODUCTS As mentioned in paragraph 1.1 (p.1), the fission products are generated by fission reactions of 235U and. 239. Pu inside the nuclear reactor. It has been shown in Table 1.3. 6 | Page © 2019 Tous droits réservés.. lilliad.univ-lille.fr.
(34) Thèse de Hao Hu, Université de Lille, 2019. Release and Transport of Fission Products. that fission products can be presented in different chemical states after fission reaction. According to different research programs26–29, fission products can be classed into four categories: . Fission gas and volatile fission products (Kr, Xe, I, Cs, Br, Rb, also Te, Sb, Ag).. . Semi-volatile fission products (Mo, Ba, Y, Rh, Pd, Tc).. . Fission products with low volatility (Sr, Nb, Ru, La, Ce, Eu, Np).. . Non-volatile fission products (Zr, Nd).. Primary Circuit Surface Deposition. Sorption. Re-vaporization. Condensation Oversaturated vapors. Input flux. Gas phase. Release. Nucleation. Aerosol. Output flux. Agglomeration. Chemical reaction Primary Circuit Surface. Figure 1.4. Physical-chemical phenomena occurring in the primary circuit in a severe accident. In a nuclear accident, FPs will be, in a first step, released to the primary circuit and transported by it. Depending on the nature of the accident, the FPs can be transported to other parts of NPP (until nuclear containment building) or even environment. The comportment of fission products in the primary circuit is quite complex. The temperature inside the primary circuit varies a lot according to the location. At the beginning of the primary circuit (close to the nuclear reactor), the temperature may be as high as 1500 °C. For a break in the cold leg, the temperature near the break is down to 200°C. The physical-chemical phenomena occurring in the primary circuit in a serious accident are presented in Figure 1.4.30 First of all, fission gases and vapours of fission products can react with other gases/vapour, aerosols and surfaces. It is noticing that structural and control rod materials may be involved the FPs chemical reactivity. Then, the fission products vapour condenses together and form aerosols by homogeneous or heterogeneous nucleation or condenses directly on the surface of the primary circuit. Thereafter, aerosols can be deposited to the surface by Brownian diffusion; thermophoresis; diffusiophoresis, electrophoresis, sedimentation, flowgeometry changes, turbulence and pool scrubbing. The deposits formed in the RCS can potentially be remobilized due to chemical reaction with the surfaces or with a. © 2019 Tous droits réservés.. Page | 7 lilliad.univ-lille.fr.
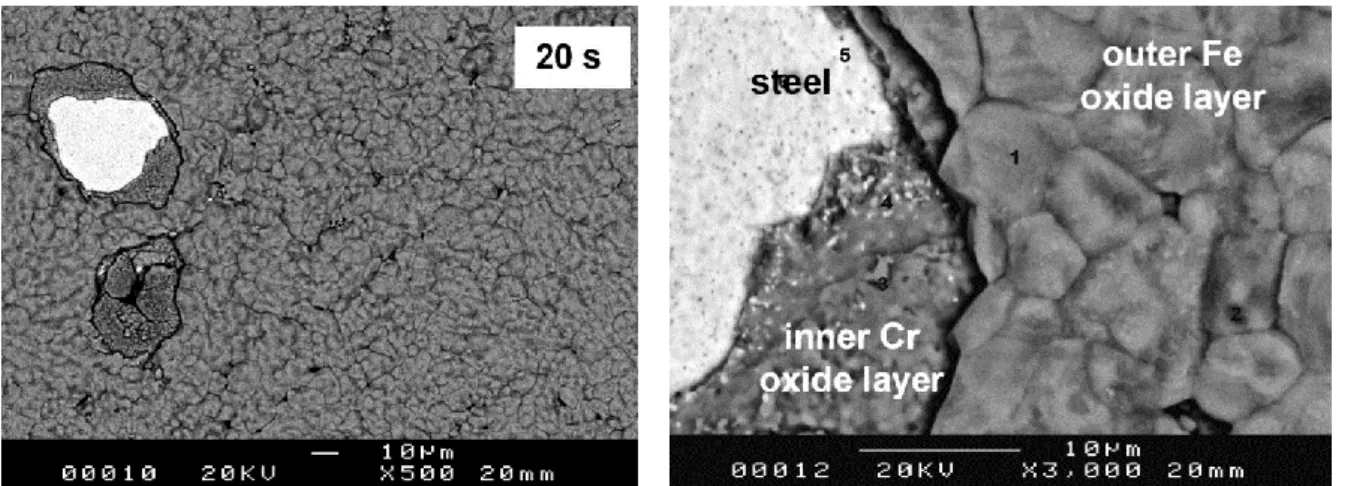
(35) Thèse de Hao Hu, Université de Lille, 2019. INTRODUCTION. change in the carrier gas with potential formation of higher volatile species or mechanical resuspension due to gas flow acceleration. Consequently, it is important to understand the phenomena occurring on the surface of the primary circuit to evaluate this remobilisation phenomena.. 1.5 OBJECTIVE OF WORK As we mentioned before, in a severe nuclear accident, fission products will be released from the nuclear reactor and parts of them will be deposited on the surface of the primary circuit. In our work, we will study the chemical reactions occurring on the surface of the primary circuit in case of severe accident (adsorption of fission products, re-vaporization of volatile species, etc.). The nature of the RCS surfaces will be discussed in the introduction. The chemical behaviour of iodine and ruthenium species will be presented in the introduction of chapter three and four respectively.. 1.5.1 NATURE OF THE SUBSTRATE Adsorption and reactions will occur on the surface of the primary circuit. To model these surfaces, it is mandatory to define the nature of the materials in contact with the gas flow. The RCS surface is made in 304L stainless steel that has good resistance to corrosion thanks to its high concentration of chromium. This alloy is mainly constituted by iron and chromium (18.17wt. %) and a little quantity of other metals (ex: Mn 1.74 wt. % etc.). 31 This surface can be exposed to a mixture of air and steam or steam. Consequently oxidation of the surface may occur. Hence many studies have been realized at different temperatures, for different duration, on the oxidation of 304L stainless steel by air and steam. N, Zacchetti et al.32 have used SEM (Scanning Electron Microscope) and GDOES (Glow Discharge Optical Emission Spectroscopy) techniques to understand the early stage oxidation on 304L stainless steel surface under air at different temperatures. At 1200 °C, they found that, in the first few seconds, oxidation of chromium occurred and a fine-grained oxide layer of Cr2O3 is formed on the surface. When all the chromium on the surface has been totally oxidized, chromium will diffuse from the steel and the oxidation of iron will begin. These iron oxides will be grown outside the initial chromium oxides layer and these two oxide layers will cover the steel (Figure 1.5). After 20s of 8 | Page © 2019 Tous droits réservés.. lilliad.univ-lille.fr.
(36) Thèse de Hao Hu, Université de Lille, 2019. Objective of Work. oxidation, a 7.5 mm thick duplex scale is formed which is unchanged even after 200s. After 1200s, its thickness growth up to 9.5 mm. They also study the oxidation under air at lower temperature (≤1000°C). The formation rate for oxide film is quite low. However, formation of a thin chromium rich oxide layer can always be observed which is much thinner than at 1200°C.. Figure 1.5. SEM surface micrographs in backscattered electrons at two different magnification (×500 and × 3000) of oxidized specimens at 1200°C in air for 20 seconds. 32. Using the combination of TOF-SIMS (Time of Flight-Secondary Ion Mass Spectrometry), XPS (X-ray Photoelectron Spectroscopy) and LEIS (Low Energy Ion Scattering), A.-S. Mamede et al.33 have studied the influence of temperature on the oxidation of 304L stainless steel surface under air and steam for long timescale. They found that the global surface composition does depend neither on oxidation temperature nor an oxidation time. However, the exact nature of the crystallites formed may change. For oxidation under air, at 750°C (Figure 1.7 left top and middle), a mixture of manganese chromite (small particles, representing very small part of the surface, large crystals present in point 1 in Figure 1.6), iron chromite and separated chromium and iron oxides are presented on the surface.. Figure 1.6. SEM images of 304L (a) before oxidation and after oxidation in air at (b) 750°C 24 h.. © 2019 Tous droits réservés.. Page | 9 lilliad.univ-lille.fr.
(37) Thèse de Hao Hu, Université de Lille, 2019. INTRODUCTION. With LEIS analyses, it has been evidenced that iron is not present on the first atomic layer, but it is detected on the second atomic layer in a close contact with chromium. However, it is hard to distinguish between the mixed oxides and the pure oxide phases. When the temperature rises to 950°C (Figure 1.7 left down), the surface becomes more homogeneous with a mixture of Cr2O3 and MnCr2O4, iron oxide being detected in a second oxide layer. For the oxidation under steam (Figure 1.7 right), the nature of the surface is different. At 750 °C, the first atomic layer is almost MnO, while, at 950 °C, a mixture of manganese and iron can be found on the surface.. Figure 1.7. ToF-SIMS depth profiling on specimens after oxidation in air and steam atmospheres. short line: CrO-; point: MnO-; line: FeO- 33. 1.5.2 STRUCTURAL MODEL In our work, we will model the reactions, on the surface of the primary circuit (made by 304L stainless steel). Consequently, the theoretical models of the surfaces should be chosen. As mentioned in the previous paragraph, the global composition of the surface does not change for oxidation under air. However, the nature of the surface is quite complex depending on the temperature and exposition time. Overall, manganese oxide (MnO), manganese chromite (MnCr2O4), chromium oxide (Cr2O3), iron oxides (Fe2O3),. 10 | Page © 2019 Tous droits réservés.. lilliad.univ-lille.fr.
(38) Thèse de Hao Hu, Université de Lille, 2019. Objective of Work. mixture of manganese and iron oxides and mixture of chromium and iron oxides might be present on the surface. The theoretical study on magnetic orderings in MnO(s) have been performed recentely.34 It was found that magnetic coupling constants 𝑠 is well described by hybridDFT, but not at the GGA level. However, hybrid-DFT calculations are much more time consuming than GGA one. Consequently, it will not be possible to study the reactivity on surfaces at this level. For manganese chromite (MnCr2O4), only few theoretical studies have been published. D. Das et al.35 have run the first systematic study on the bulk chromite series (including MnCr2O4) comparing their structural and magnetic properties by using DFT+U method. They found that in order to obtain the correct structure for the ground state, it is necessary to include the electron-electron correlation. In the bulk, MnCr2O4 is different from the ideal spinel structure with significant local structural distortions. However, no theoretical study has been performance on manganese oxide (MnO) and manganese chromite (MnCr2O4) for their stability under different conditions. S. Souvi et al. 36,37 have realized a theoretical study on chromium oxide and iron oxide surface in order to determine the most stable structure under different atmospheres (O2, H2 and H2O) and temperature. For a chromium oxide surface, the most stable structure is terminated with 1 Cr and 3 O atoms. It will be named as Cr2O3Cr (Figure 1.8 a). At ambient temperature, the dissociative adsorption of O 2 stabilizes the surface. In this case, one oxygen atom is adsorbed on top of the chromium atom of the surface (Cr2O3Cr) and this oxidized surface will be called Chromyl (Figure 1.8 b). At 600K, 900K and 1200K, this structure is always the most stable one above 10-8, 10-1 and 300 bars. Cr2O3Cr surface is the most stable one even under oxygen. At ambiance temperature, under steam, the surface with 1.5 water molecules adsorbed on each site is the most stable one for pressures lower than 3 bars. This hydrated surface is named Cr2O3Cr2(OH)3 (Figure 1.8 c). Above 3 bars, totally saturated surface becomes the most stable one with 3 water molecules adsorbed per site. At 600K, Cr 2O3Cr2(OH)3 is stable above 3.10-3 bar of water. Below these pressures, Cr2O3Cr surface is still the more stable one. For the iron oxide, in conditions relevant to severe accident the most stable surface is similar to the chromium one. This surface is called Fe2O3Fe (Figure 1.8 d).. © 2019 Tous droits réservés.. Page | 11 lilliad.univ-lille.fr.
(39) Thèse de Hao Hu, Université de Lille, 2019. INTRODUCTION. Cr. (a). (b). Cr2O3Cr. (c). Chromyl. O. Fe. H. (d). Cr2O3Cr2(OH)3. Fe2O3Fe. Figure 1.8. Theoretical models for the different chromium oxide and iron oxide surfaces under different pressures, temperatures and atmospheres. 36,37 (a) Cr2O3Cr (neutral chromium oxide surface), (b) Chromyl (oxidized chromium oxide surface), (c) Cr2O3Cr2(OH)3 (hydrated chromium oxide surface), (d) Fe2O3Fe (neutral iron oxide surface). Chromium: green. Iron: blue. Oxygen: red. Hydrogen: yellow.. 1.5.3 CONCLUSION There are many possibilities of oxide formation on the 304L stainless steel surface in case of severe nuclear accident: manganese oxide (MnO), manganese chromite (MnCr2O4), chromium oxide (Cr2O3), iron oxides (Fe2O3), as well as mixture of manganese and iron oxide and mixture of chromium and iron oxides. Calculations surfaces of all these magnetic oxides will be challenging and time consuming. Since chromium oxide and iron oxide surfaces have already been investigated and since they have similar structures, this work will focus only on these two systems. The calculations on other surfaces should be performed in the future. The goal of this work is to investigate the vaporization of iodine and ruthenium species coming from the aerosol deposited on the RCS surfaces or vapours condensed on the RCS surfaces. For iodine, it is supposed that the aerosols are formed for metallic iodide such as CsI, AgI and CdI2.38–40 The iodide formation form CsI has been studied in a 12 | Page © 2019 Tous droits réservés.. lilliad.univ-lille.fr.
(40) Thèse de Hao Hu, Université de Lille, 2019. Objective of Work. previous work, we will focus on AgI and CdI2. At high temperature, the volatile species of ruthenium are ruthenium oxides such as RuO2, RuO3 and RuO4. We will investigate theoretically, at the GGA-DFT level, their interactions with chromium and iron oxides. In the following chapters, firstly, calculation methods will be presented. Then the adsorption of metal iodides (AgI and CdI 2) on chromium and iron oxides surface and the possible formation volatile species (I2 (g)) will be discussed. In the following chapter, the adsorption of ruthenium oxides on these two surfaces will be presented. Additionally, the formation of volatile ruthenium oxide (RuO 4 (g)) from these surfaces and from ruthenium dioxide surfaces (RuO2 (s)) will be presented.. © 2019 Tous droits réservés.. Page | 13 lilliad.univ-lille.fr.
(41) Thèse de Hao Hu, Université de Lille, 2019. INTRODUCTION. REFERENCE (1). Stocker; T.F., D. Qin, G.-K. Plattner, M. Tignor, S.K. Allen, J. Boschung, A. Nauels, Y. Xia, V. B. and P. M. M. (eds. Summary for Policymakers. In: Climate Change 2013: The Physical Science Basis. Contribution of Working Group I to the Fifth Assessment Report of the Intergovernmental Panel on Climate Change. CEUR Workshop Proc. 2015, 1542, 33–36.. (2). Nuclear Power and Sustainable Development; Non-serial Publications; INTERNATIONAL ATOMIC ENERGY AGENCY: Vienna, 2016.. (3). Ducros, G.; Malgouyres, P. P.; Kissane, M.; Boulaud, D.; Durin, M. Fission Product Release under Severe Accidental Conditions: General Presentation of the Program and Synthesis of VERCORS 1-6 Results. Nucl. Eng. Des. 2001, 208 (2), 191–203.. (4). Preedy, V.; Burrow, G.; Watson, R. Comprehensive Handbook of Iodine; Elsevier, 2009.. (5). International Atomic Energy Agency. Nuclear Power Reactors in the World. 2017, No. 2, 88.. (6). Gordon, E. A Light-Water Nuclear Fission Reactor for the Production of Electric Power https://chem.libretexts.org/LibreTexts/Furman_University/CHMA_Chemistry_an d_Global_Awareness_(Gordon)/A_Nuclear_Energy/A_Nuclear_Reactor_Comp onents (accessed Nov 29, 2017).. (7). Fry, F. A.; Clarke, R. H.; O’Riordan, M. C. Early Estimates of UK Radiation Doses from the Chernobyl Reactor. Nature 1986, 321 (6067), 193–195.. (8). DENSCHLAG, Η. O.; DIEL, A.; GLÄSEL, Κ.-Η.; HEIMANN, R.; KAFFRELL, Ν.; KNITZ, U.; MENKE, H.; TRAUTMANN, Ν.; WEBER, M.; HERRMANN, G. Fallout in the Mainz Area from the Chernobyl Reactor Accident. Radiochim. Acta 1987, 41 (4).. (9). Schwantes, J. M.; Orton, C. R.; Clark, R. A. Analysis of a Nuclear Accident: Fission and Activation Product Releases from the Fukushima Daiichi Nuclear Facility as Remote Indicators of Source Identification, Extent of Release, and State of Damaged Spent Nuclear Fuel. Environ. Sci. Technol. 2012, 46 (16),. 14 | Page © 2019 Tous droits réservés.. lilliad.univ-lille.fr.
Figure
+7
Documents relatifs
: les verbes en er -Comprendre que des éléments de la phrase fonctionnent ensemble (groupe nominal) ; comprendre la notion de « chaine d'accords ».. -Maitriser les marques
Element relations in the years 1997 and 2000 of the youngest needle age classes in different treatments: (IL) irrigation with liquid fertilizer, (WA) wood ash, (I) irrigation,
The Migrant Workers’ Project compliments our general advice service and aims to address the barriers that migrant workers experience in employment and when accessing services..
A group test, carried out on the mixture of samples taken from n people, when it proves negative, makes it possible to end the lockdown for all members of the group.. • The
The main contribution of this paper is to prove that, depending on the network parameters, allowing every transmitter to use several channels simultaneously instead of a single one
(ii) Secondly, when using analytical expressions of virial coef- ficients, the radius of convergence of the series has to be calculated in order to deduce the volume range on which
When Syt1 oligomerization is compromised with a targeted mutation (F349A), a large majority (85%) of these SUVs (Syt1 349 -vSUV) are mobile and spontaneous fuse similar to vSUVs,
Hence, the purpose of this paper is to present a case study, based around the concept of <Laparoendoscopic single-site surgery> 2 , in which a methodology anchored in
