HAL Id: hal-01631926
https://hal.archives-ouvertes.fr/hal-01631926
Submitted on 9 Nov 2017
HAL is a multi-disciplinary open access
archive for the deposit and dissemination of
sci-entific research documents, whether they are
pub-lished or not. The documents may come from
teaching and research institutions in France or
abroad, or from public or private research centers.
L’archive ouverte pluridisciplinaire HAL, est
destinée au dépôt et à la diffusion de documents
scientifiques de niveau recherche, publiés ou non,
émanant des établissements d’enseignement et de
recherche français ou étrangers, des laboratoires
publics ou privés.
Dashboard for monitoring student engagement in mind
mapping activities
Rubiela Carrillo, Clément Renaud, Yannick Prié, Élise Lavoué
To cite this version:
Rubiela Carrillo, Clément Renaud, Yannick Prié, Élise Lavoué. Dashboard for monitoring student
en-gagement in mind mapping activities. 2017 IEEE 17th International Conference on Advanced
Learn-ing Technologies (ICALT), Jul 2017, Timisoara, Romania. pp.433-437, �10.1109/ICALT.2017.100�.
�hal-01631926�
Dashboard for monitoring student engagement in
mind mapping activities
Rubiela Carrillo
∗, Cl´ement Renaud
∗, Yannick Pri´e
†and ´
Elise Lavou´e
‡∗Universit´e de Lyon, CNRS
Universit´e Lyon 1, LIRIS, CNRS5205, F-69622, Villeurbanne, France Email: {rubiela.carrillo-rozo, clement.renaud}@liris.cnrs.fr
†Universit´e de Nantes, LS2N - UMR 6004, CNRS, France
Email: yannick.prie@univ-nantes.fr
‡Universit´e de Lyon, CNRS
IAE Lyon, Universit´e Jean Moulin Lyon 3, LIRIS, CNRS5205, F-69355, Lyon, France Email: elise.lavoue@univ-lyon3.fr
Abstract—Our work aims at helping teachers to monitor learners’ engagement during mind mapping activities. The use of mind maps helps students to elaborate cognitive learning strategies like creating and organizing contents. To assess the quality of these mind maps, teachers need tools to understand students’ choices and strategies when constructing their mind maps. We have defined in collaboration with teachers a set of indicators based on learners’ interaction traces. Those indicators have been implemented and integrated in a dashboard dedicated to teachers. In this paper, we introduce a first version of the dashboard: its design, implementation, and the results of its evaluation conducted during interviews with real teachers.
Keywords—dashboard, interaction traces, visualization, en-gagement, mind mapping, xAPI
I. INTRODUCTION
The use of mind maps in the classroom tends to become a widespread practice [11]. This kind of activity helps students to elaborate learning strategies like creating and organizing contents studied in class. Teachers usually consider the rich-ness of expression given to the students as a major strength of this kind of tool. Nevertheless, this richness can easily turn into a challenge when it comes to interpret and evaluate learners’ productions. As the exercises based on mind maps usually do not have a unique answer, understanding the construction processes could be very important for teachers. Moreover the understanding of these processes is often instrumental for teachers with regard to particular choices of a learner.
The goal of the present research is to supply teachers with indicators that reflect the way learners engage in the activity of mind maps construction. We propose to distinguish behavioral and cognitive engagement [12]. Behavioral engagement can be understood as the way learners use the tool (i.e. number and types of actions), while cognitive engagement deals with the construction processes of mind maps (i.e. creation and deletion of links and nodes in the maps). The definition of these indicators relies on activity traces that have been collected during the use of a mind mapping tool in the classroom.
In this paper, we answer two main research questions: which indicators can be used to monitor student engagement during the construction of mind maps? How can these indicators be represented on a dashboard? We propose indicators to monitor
learners’ engagement based on interviews with 5 teachers, as well as a first version of a dashboard. We also report the results of a qualitative evaluation conducted with 3 teachers.
The first section of this paper introduces the literature about 1) mind maps as a support for knowledge construction, 2) the-oretical frameworks on learner engagement and 3) dashboards that offer indicators on learner engagement. In the second section, we describe the methodology used to define indicators and the associated visualizations. The third section is dedicated to the description of the indicators we propose as well as the details of the dashboard and its technical implementation. The last section presents and discusses the first results of the evaluation of the dashboard. We conclude on the limitations of this study and the new issues raised by our work.
II. LITERATUREREVIEW
A. Mind Maps
Mind maps are lists of words structured and organized as trees to represent an idea, a concept or a plan [6]. Concept maps are diagrams that use lines to organize and represent relationships between concepts [19]. Despite these minor differences, these two types of diagrams emphasize the graphic representation of relationships against the use of verbal or written descriptions. Mind maps usually take the form of graphs where ideas and concepts are identified as nodes and the relationships between them as edges. In the present work, we use a mind mapping tool called Renkan (http: //www.iri.centrepompidou.fr/outils/renkan/) created by the IRI research lab (Institut de Recherche et d’Innovation du Centre Pompidou). This tool allows easily creating mind maps in the user browser and integrating media content from the Web (e.g. links, images).
B. Learning Engagement and Strategies
Existing conceptual approaches of learner engagement pro-vide multiple, sometimes contradictory, definitions of the concept of engagement. It can be understood as effort, interest, persistence, motivation or even learning strategies [3]. Our work is based on the theoretical frameworks proposed by Fredricks et al. [12] and Linnenbrick and Pintrich [16] which
consider learner engagement as being composed of three dimensions: motivational, behavioral and cognitive.
Motivational engagement includes interest, affect and values perceived by learners while carrying out learning tasks [16]. It is well recognized now that positive and negative emotions have an impact on learning processes and regulatory strategies [24], [20]. We do not consider this dimension in our study.
Behavioral engagement refers to observable actions from the learners while carrying out a learning task, their positive con-duct as well as their participation in collective activities outside School [12]. During mind mapping activities, actions referring to behavioral engagement may correspond for instance to accessing the map, taking time to construct it, defining nodes and links to represent ideas and their connections.
Cognitive engagement relates to the deployment of learning strategies. These strategies may be cognitive, self-regulatory or related to resource management [21]. Examples of cognitive strategies used during the elaboration and organization of contents are: selecting important ideas, summarizing, spatially and logically organizing the ideas while note-taking, or elabo-rating conceptual maps as diagrams. Such activities incite deep reflection that is beneficial to the learning processes of the learner [16]. We think that the actions carried out by the learners when constructing a mind map and their temporality can be revealing of their cognitive engagement.
C. Learning Dashboards
Several approaches offer visualizations of the behavioral engagement of learners calculated from their interaction traces. These visualizations help teachers to monitor student activities by providing information on their actions, but they do not provide explanations of observed behaviors.
University of Purdue’s Signals dashboard [5] shows at risk students with a color code; Data Wranglers [7] presents the visits on forums, pages, wikis and tests of a course; Competency Map [14] shows the proportion of assignments done to estimate the skills acquired in a program; GLASS [15] offers indicators on the frequency of actions by learning group or by activity type; VISEN [23] provides result indicators from clicks, duration, and test results; finally, the dashboard proposed by [22] shows the time spent on activities (e.g per tool used, per student compared to the average). These indi-cators describe learners’ behaviors, but they are not sufficient to understand why learners have engaged in activities or not, and how they have achieved these results.
Some dashboards are more interactive to facilitate the exploration of indicators about learners’ actions. For instance, SAM [13] represents the same information in several vi-sualizations (i.e. timelines, parallel coordinates) allowing to discover details. However, these representations only provide statistical results (e.g. time dedicated to activities over a period of time), which are limited to explain actions. Mastery Grids [17] presents a main grid with the themes of the course and their associated resources. The cells are colored to indicate the level of accomplishment of the activities and the users can click on the cells to visualize the level of accomplishment of the sub-themes of the course. A horizontal timeline indicates
the current week of the course, but does not tell when the learners have performed their actions.
Other approaches apply data mining techniques and ite-rative statistical analysis on interaction traces to identify typologies of behaviors. For instance, Bouvier et al. identify users’ engaged behaviors based on their interaction traces [2]. Desmarais and Lemieux [10] developed visualizations of sequences of activities according to the behavior types they identified. Anderson et al. [4] represent the percentage of learners by typology over time. Coffrin et al. [8] construct sequences of states representing the transitions between re-sources and teaching content. However, users need analytical and data processing skills to construct and understand these visualizations because they are not automatically generated.
To sum up, dashboards generally provide indicators on learner participation or hies/her use of resources to describe his/her behavior. Such indicators can hardly explain these behaviors, and especially the cognitive effort or learning strategies adopted. Moreover, most of the works about cogni-tive engagement use observation techniques and self-reported questionnaires [12] and are not based on interaction traces as required in our context. That is why we decided to focus our work on the design of a dashboard that show indicators on cognitive and behavioral engagement and the relations between both types of engagement.
III. DESIGNMETHODOLOGY
A. Preliminary Teachers Interviews
We follow an iterative methodology that actively involves teachers. A first workshop with 19 teachers allowed us defining a set of questions and requirements as well as potential evaluation methods regarding the use of mind maps in the classroom. We then conducted semi-structured interviews with 5 of these teachers focusing on the integration of mind maps in their educational activities and on their expectations regarding learners monitoring when constructing mind maps. First we presented the terminology and the features offered by the mind mapping software Renkan. Then we introduced a specific use case to bring interviewees into a specific teaching situation, while answering questions about the interest of the use of mind maps in educational situations. Their answers allowed us identify three main ways of using mind maps in class: 1) as a summary of a chapter previously studied in class, 2) as an exercise before and after a chapter of the course to reorganize, complement and correct wrong ideas if needed, and 3) as a final medium for oral synthesis of a chapter studied in class.
The first two uses especially interest us, as they include the creation and the manipulation of the maps. The third one has been ignored as it focuses on oral presentation. Teachers noticed the difficulty to understand why some of the maps produced by learners do not show coherent representations of the studied topic. They also emphasized the important amount of time required by the navigation, the understanding and the evaluation of each map. Several teachers also mentioned a lack of information preventing them identifying quickly students that have faced difficulties during the mind mapping process.
t0 t1
t2 t3
t4 t5
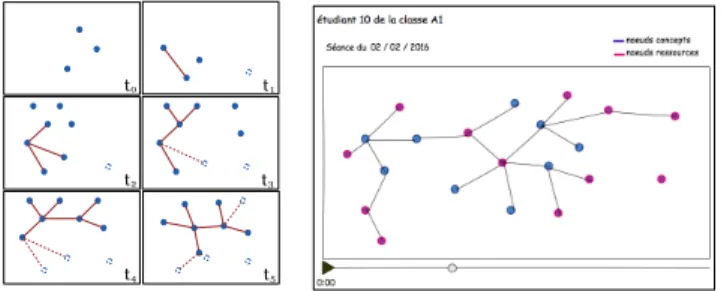
Fig. 1. Two proposals for representing the evolution of the mind map structure over time. Left: using small multiples. Right: using a dynamic slider.
B. Visualization Mock-ups for Indicators
We used mock-ups as a basis for discussions with the teachers about the choices and the visualization of indicators to monitor the mind mapping process (more details in [1]). Those mock-ups contain several indicators that describe behavioral engagement: number of elements in the final graph (i.e nodes and/or links), number of existing web resources and number of actions executed during the construction of the map (create, delete, modify, move). Temporal indicators about the evolution of the structure of the graph itself (i.e. nodes and links) were also proposed. This kind of indicators is useful to monitor the sequencing of the organization of ideas by the learner and so to assess the his/her cognitive engagement.
Figure 1 shows two interface mock-ups representing the manipulation of the graph over time. The visualization on the left uses small multiples to provide an overview of the process, but turns out to be very difficult to interpret by the intervie-wees. They mentioned that the choice of instants (t) was a complex task that influences much the inclusion or exclusion of potential information on the mind map construction process. Teachers also emphasized the importance of accessing three levels of representation for the learners monitoring: a detailed view of each student, a list of all students within the class, and an overview of the class as a whole. This third level was considered as less important as it does not support the comparison between the students in the class.
IV. DASHBOARD ONLEARNERENGAGEMENT
A. Indicators of Learner Engagement
We propose five indicators to describe the learner engage-ment during mind mapping activities:
1) Number of actions: Total count of the actions on nodes and links (create, delete, update and move).
2) Number of nodes: Total number of nodes in the final mind map.
3) Clarity of the approach: Ratio between number of nodes and edges creations and deletions during the mind map-ping process.
4) Links per node: Average degree for each node in the mind map. The degree is the number of incoming and outgoing links of a node.
5) Medias: Ratio between the number of nodes containing Web resources (URL) and the total number of nodes. These different indicators allow us to understand how the mind map was built. The number of nodes shows if the
exercise has been finished, that is if there are nodes in the map. Actions indicators (“number of actions” and “clarity”) provides hints on the behavior of the learner. The number of links by node gives an estimate of the overall connexity of the map by showing how disparate or connected its elements are. Finally, the “medias” indicator shows if the learner has been seeking resources on the Web during the mapping.
To help identify extreme values, or values that radically differ from those of the overall class, we chose to consider 3 sets: average values, further values and extreme values. We converted the values of each indicator into Z-scores (z) allowing to distinguish discrepancies between the values.
We defined thresholds to separate the three groups as follows: 0 < |z| < 1 , 1 < |z| < 2 and 2 < |z|.
B. Indicators’ Visualization and Dashboard
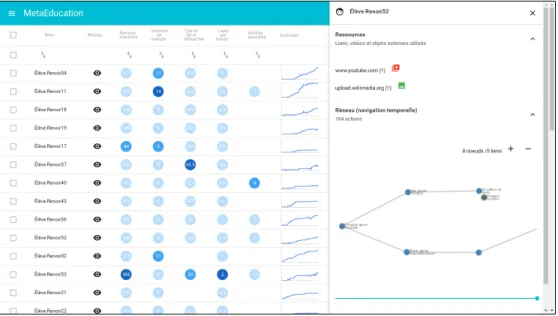
We propose two levels of representation: the first one gives an overview of the whole class with details for each learner, the second shows single learner data. The left part of the dash-board contains a list of all learners with different indicators organized in columns (see Fig. 2). The learners’ order can be reorganized by ascending and descending indicators values in the columns. Each indicator is represented by a circular badge containing the numerical value of the indicator. The scale of blue coloring the circle shows the z-group (groups based on z-score) where the value belongs: the deeper the blue is, the further the value is from the average. This use of color was meant to allow users to identify quickly learners’ patterns of use that differs radically from others. The use of small graphs (in the “Evolution” column on the figure 2) shows the evolution of the number of elements in the mind maps over time (creation and deletion of nodes and edges), allowing quickly identifying patterns of use.
By clicking on the eye icon, the dashboard opens a lateral slide dock (on the right on Fig. 2) which contains details about the construction of the mind map of a specific learner. The upper part shows all the Web resources added by the learner, while the lower part gives the user the ability to replay the creation of the map by playing a time lapse with a slider. C. Software Architecture
1) Data Collection: The MetaEducation platform stands at the core of the software architecture. In the classroom, learners can access it through their standard learning environment (Figure 3). Once connected on the platform learners can access the mind mapping software Renkan. Each of their actions is recorded in the Learning Locker (http://learninglocker.net/) LRS (Learning Record Store) using TinCan API / xAPI state-ments (http://tincanapi.com/) and made available through a web service. All data are stored following xAPI standard using CREATE, UPDATE, DELETE, VIEW, et MOVE actions. The name of the students have been anomymized beforehand.
2) Data Pre-processing: A Python software crawls the web API at regular intervals, and a set of actions are executed to clean and pre-process the data. Our workflow is as follow: extract data from raw xAPI format, reconstruct the successive states of each mind map, and identify and count the different actions.
Fig. 2. The dashboard interface. On the left: an overview of the whole class with a list of all learners. On the right: the details about the mind map construction for a learner.
Fig. 3. Software architecture of the visualization dashboard
3) Indicators Calculation and Visualization: The dashboard is built on a classical client-server web application. The server, written in NodeJS, calculates the different indicators on-the-fly from the pre-processed data and serves them through a JSON API. Lists of classes and students are also made available. The user interface itself is a single-page application relying on different front-end Javascript frameworks for data management (Redux) and visualization (React, d3js, CytoscapeJS).
V. EVALUATION
A. Evaluation Methodology
We conducted semi-structured interviews with three tea-chers, two of whom had taken part in previous discussions about educational uses and expectations about mind maps in the classroom (see III-A). These two teachers teach in middle school; the third one is an university professor.
Our interview grid had 16 questions following 2 main evaluation criteria: usability of the dashboard and perceived utility of the indicators. These items are evaluated using open questions, allowing interviewees to freely add remarks and
comments. The usability of the dashboard was evaluated by asking participants to do simple tasks (e.g. tell how many students have used Web resources in their maps, identify students who never deleted a single node or link). These tasks aim at starting discussions about the clarity of the interface, the choices of representation, and the means of interaction.
The interviews lasted for about an hour. They were con-ducted through remote calls, participants were also asked to share their screens to watch the actions made while doing the proposed tasks. Voice recording and screen capture software programs were used to keep track of the whole discussion.
B. Results
A first evaluation helped us to gather feedback on the dash-board described above and to identify possible improvements. 1) Dashboard Usability: The interactions proposed in the main interface allowed to easily explore information regarding the group (e.g. ordering the students by indicator, showing simplified versions of the mind maps).
Basic indicators came in handy, especially to make com-parisons between students. But more sophisticated ones, like ratios, are more difficult to interpret despite the captions. The “clarity” indicator was seen as particularly ambiguous, its caption suggesting already an interpretation. Alternative captions have been proposed as “ratio between number of deletion and creation”and “percent of deletion”.
The use of colors for extreme indicator values that differ from the average did not help teachers to identify learners in difficulty, and was sometimes misleading. The choice of colors and the way to show groups based on z-scores have to be rethought.
The spatial organization of the dashboard did not generate important comments. Regarding the overall interface, teachers have confirmed the interest of showing two levels of infor-mation (individuals and group with details on each student).
Teachers have expressed the need to access the final state of the graph using an image or a link while evaluating the construction process. They also mentioned the need for more explanations about the indicators, possibly during the handling phase of the dashboard.
2) Utility of Indicators: Indicators have been considered useful for the monitoring of learner engagement and the understanding of learners’ actions during the mind mapping process. While the intended use of the indicators was to identify learners at risk, one of the teachers suggested that the dashboard could also be used to evaluate the mind maps (“...it could become a very interesting tool for evaluation”).
The replay of the map has helped teachers to understand the construction process, and how a learner has handled the graph to create the final map. One of the teacher mentioned that showing this replay to the learner could become a handy tool to help his/her reflection. The inline visualization of the media resources used in the maps also gave teachers interesting elements to evaluate the map content.
VI. CONCLUSION ANDFUTUREWORK
In this paper we proposed a dashboard to help teachers monitor learners’ engagement during the use of mind maps in educational activities in class. We focused on cognitive and behavioral dimensions of engagement and their relations. The first preliminary step was a design workshop with teachers that informed us of educational uses of mind maps in the class and possible criteria for evaluation. Next we proposed scenarii and mock-ups to start a discussion with the teachers about the visualization of these criteria. We then defined indicators built from traces collected during exercises in class and designed and implemented a first version of the teacher dashboard. The dashboard shows both a representation of the group of students and of each student. Its key features include a replay of the map construction and simplified browsing of web materials associated to the map. The evaluation interviews with teachers showed that most of the indicators we had originally defined allowed them better understanding the learners’ processes of mind mapping. The time lapse reconstruction of the mind maps stands as a promising feature that needs to be explored further. Future work involves designing and developing the next version of our prototype, which should include new indi-cators about the mind map quality, and pursue our fieldwork experiments with more classes and teachers.
ACKNOWLEDGMENT
This research work is funding from the M´eta ´Education Project supported by the Investissement d’Avenir Programme.
REFERENCES
[1] R. Carrillo, ´E. Lavou´e, and Y. Pri´e. Towards Qualitative Insights for Visualizing Student Engagement in Web-based Learning Environments. In Proc. of the Workshop on Web Science and Technology for Education in conjunction with the 25th International World Wide Web Conference (WWW 2016), WEBED ’16, pages 893–898. 2016.
[2] P. Bouvier, K. Sehaba, Karim and ´E. Lavou´e. A Trace-based Ap-proach to Identifying Users’ Engagement and Qualifying Their Engaged-behaviours in Interactive Systems: Application to a Social Game. User Modeling and User-Adapted Interaction, 24(5):413–451, 2014.
[3] P. Bouvier, ´E. Lavou´e, and K. Sehaba. Defining Engagement and Characterizing Engaged-Behaviors in Digital Gaming. Simulation & Gaming, 45(4-5):491–507, 2014.
[4] A. Anderson, D. Huttenlocher, J. Kleinberg, J. Leskovec Engaging with Massive Online Courses. In Proc. of the 23rd Int. Conf. on World Wide Web, WWW ’14, pages 687–698, 2014.
[5] K. Arnold and M. Pistilli. Course Signals at Purdue: Using Learning Analytics to Increase Student Success. In Proc. of the 2nd Int. Conf. on Learning Analytics and Knowledge, LAK ’12, pages 267–270. 2012. [6] B. Buzan, T. Buzan, and M. Bouvier. Mind map, dessine-moi
l’intelligence. Eyrolles, Paris, Aug. 2012.
[7] D. Clow. Data Wranglers: Human Interpreters to Help Close the Feedback Loop. In Proceedings of the Fourth Int. Conference on Learning Analytics And Knowledge, LAK ’14, pages 49–53, 2014. [8] C. Coffrin, L. Corrin, P. de Barba, and G. Kennedy. Visualizing Patterns
of Student Engagement and Performance in MOOCs. In Proceedings of the Fourth International Conference on Learning Analytics And Knowledge, LAK ’14, pages 83–92, 2014.
[9] M. Davies. Concept mapping, mind mapping and argument mapping: what are the differences and do they matter? Higher Education, 62(3):279–301, Sept. 2011.
[10] M. Desmarais and F. Lemieux. Clustering and visualizing study state sequences. In Educational Data Mining 2013, 2013.
[11] M. J. Eppler. A comparison between concept maps, mind maps, conceptual diagrams, and visual metaphors as complementary tools fr knowledge construction and sharing. Information Visualization, 5(3):202–210, Sept. 2006.
[12] J. A. Fredricks, P. C. Blumenfeld, and A. H. Paris. School Engagement: Potential of the Concept, State of the Evidence. Review of Educational Research, 74(1):59–109, Jan. 2004.
[13] S. Govaerts, K. Verbert, E. Duval, and A. Pardo. The Student Activity Meter for Awareness and Self-reflection. In Extended Abst. on Human Factors in Computing Systems, CHI EA ’12, pages 869–884, 2012. [14] J. Grann and D. Bushway. Competency Map: Visualizing Student
Learning to Promote Student Success. In Proceedings of the Fourth International Conference on Learning Analytics And Knowledge, LAK ’14, pages 168–172, New York, NY, USA, 2014. ACM.
[15] D. Leony, A. Pardo, L. de la Fuente Valentn, D. S. de Castro, and C. D. Kloos. GLASS: A Learning Analytics Visualization Tool. In Proceedings of the 2Nd International Conference on Learning Analytics and Knowledge, LAK’12, pages 162–163, 2012.
[16] E. A. Linnenbrink and P. R. Pintrich. The Role of Self-Efficacy Beliefs Instudent Engagement and Learning Intheclassroom. Reading & Writing Quarterly, 19(2):119–137, Apr. 2003.
[17] T. D. Loboda, J. Guerra, R. Hosseini, and P. Brusilovsky. Mastery Grids: An Open-source Social Educational Progress Visualization. In Proceedings of the 2014 Conference on Innovation & Technology in Computer Science Education, ITiCSE ’14, pages 357–357, 2014. [18] G. Molinari, B. Poellhuber, J. Heutte, E. Lavou´e, D. S. Widmer, and
P.-A. Caron. L’engagement et la persistance dans les dispositifs de formation en ligne : regards crois´es. Distances et m´ediations des savoirs. Distance and Mediation of Knowledge, (13), Feb. 2016.
[19] J. D. Novak and A. J. Theoretical Origins of Concept Maps, How to Construct Them, and Uses in Education. Reflecting Education, 3(1):29– 42, Nov. 2007.
[20] R. Pekrun, T. Goetz, W. Titz, and R. P. Perry. Academic Emotions in Students’ Self-Regulated Learning and Achievement: A Program of Qualitative and Quantitative Research. Educational Psychologist, 37(2):91–105, June 2002.
[21] P. R. Pintrich. The role of motivation in promoting and sustaining self-regulated learning. International Journal of Educational Research, 31(6):459–470, 1999.
[22] J. L. Santos, S. Govaerts, K. Verbert, and E. Duval. Goal-oriented Visualizations of Activity Tracking: A Case Study with Engineering Students. In Proceedings of the 2Nd International Conference on Learning Analytics and Knowledge, LAK ’12, pages 143–152, 2012. [23] B. Yousuf and O. Conlan. VisEN: Motivating Learner Engagement
Through Explorable Visual Narratives. In G. Conole, T. Klobuˇcar, C. Rensing, J. Konert, and E. Lavou´e, editors, Design for Teaching and Learning in a Networked World, number 9307 in Lecture Notes in Computer Science, pages 367–380. Springer, 2015.
[24] M. Zeidner. Test Anxiety in Educational Contexts: Concepts, Findings, and Future Directions. In P. A. S. Pekrun, editor, Emotion in Education, Educational Psychology, pages 165–184. Academic Press, 2007.