Follow the leader: On the relationship
between leadership and scholarly impact in
international collaborations
Zaida Chinchilla-Rodrı´guezID1,2*, Cassidy R. Sugimoto2, Vincent Larivière3,4
1 Instituto de Polı´ticas y Bienes Pu´blicos (IPP), Consejo Superior de Investigaciones Cientı´ficas (CSIC),
Madrid, Spain, 2 School of Informatics and Computing, Indiana University Bloomington, Bloomington, Indiana, United States of America, 3 E´ cole de bibliothe´conomie et des sciences de l’information, Universite´ de Montre´al, Montre´al, Quebec, Canada, 4 Observatoire des Sciences et des Technologies (OST), Centre Interuniversitaire de Recherche sur la Science et la Technologie (CIRST), Universite´ du Que´becàMontre´al, Montre´al, Quebec, Canada
*zaida.chinchilla@csic.es
Abstract
National contributions to science are influenced by a number of factors, including economic capacity, national scientific priorities, science policy, and institutional settings and cultures. Nations do not have equal opportunities to access the global scientific market, and there-fore, often seek out international partners with complementary resources and expertise. This study aims at investigating national collaboration strategies, with a focus on research leadership—measured through corresponding authorship—and its relationship with scien-tific impact. Results show that countries with higher R&D investments are more scienscien-tifically independent, and confirm that international collaboration is positively related to citation impact. However, leadership in international collaboration is inversely related with a coun-tries’ share of international collaboration and there is a very little relationship between cita-tion impact and internacita-tional leadership. For instance, most countries—and particularly those that have fewer resources—have higher scientific impact when they are not leading. This suggests that, despite increasing global participation in science, most international col-laborations are asymmetrical, and that the research system remains structured around a few dominate nations.
Introduction
In most social systems, there is a tension between cooperation and competition [1–2]. Scien-tific activity is no different: while researchers compete for the monopoly of scienScien-tific authority [3] they are also cooperating on collaborative projects [4–5]. The tension between cooperation and competition is also apparent in national science policies [6–7]. Scientific research can be seen as a strategic investment that can lead to competitive advantages in terms of economics, security, politics, and health [8]. National science agencies often tout their national competi-tiveness in production and impact. This emphasis on national production may be seen as
a1111111111 a1111111111 a1111111111 a1111111111 a1111111111 OPEN ACCESS
Citation: Chinchilla-Rodrı´guez Z, Sugimoto CR,
Larivière V (2019) Follow the leader: On the relationship between leadership and scholarly impact in international collaborations. PLoS ONE 14(6): e0218309.https://doi.org/10.1371/journal. pone.0218309
Editor: Lutz Bornmann, Max Planck Society,
GERMANY
Received: May 2, 2018 Accepted: May 31, 2019 Published: June 20, 2019
Copyright: This is an open access article, free of all
copyright, and may be freely reproduced, distributed, transmitted, modified, built upon, or otherwise used by anyone for any lawful purpose. The work is made available under theCreative Commons CC0public domain dedication.
Data Availability Statement: All relevant data are
within the paper and its Supporting Information files.
Funding: This work was supported by the
Ministerio de Economia y Competitividad and the Ministerio de Educacio´n, Cultura y Deporte), Spain (Zaida Chinchilla), the National Science Foundation, US (Cassidy Sugimoto), and the Canada Research Chairs program, Canada (Vincent Larivière). The funders had no role in study design, data collection
antithetical to collaboration; however, the complexity and specialization of modern science has led to the internationalization of the research community [9–10], as evidenced through increased mobility and collaboration [11–19]. In the race for scientific impact, mobile researchers and internationally collaborative projects tend to lead to higher citations [20–26], exacerbating the cooperation-competition dynamic.
Research councils tend to encourage collaboration among different stakeholders as part of a funding strategy to maximize impact and stimulate economic growth [8,27–28]. However, international collaboration can introduce additional challenges, as advanced and developing nations do not have the same access to the global scientific market [29]. Therefore, strategies of openness—which involve greater rates of collaboration and mobility [30]—have different costs and rewards for countries according to their capacity to trade researchers at various lev-els. This competitive agenda for science has been intensified by incentives to publish and the increasing focus on quantitative research evaluation, whereby publications are the major cri-terion for assessing researchers and institutions [31–34]. Collaboration is on the rise [1–2] and the increasing number of authors on a byline makes competition fierce for leadership positions (i.e., first, last, and corresponding authors), which signal dominant contributions to the scientific community. In order to understand and construct global indicators for sci-ence, we must first understand the role of these leadership positions in international collaborations.
This study analyses the leadership roles of nations, using corresponding authorship of inter-nationally co-author publications as an indicator of leadership [35–46]. Specifically, we seek to answer the following research questions (RQ):
RQ 1: How do collaboration practices vary across countries?
RQ 2: How do advanced and developing countries vary in terms of their leadership roles in international collaborations?
RQ 3: What is the citation advantage of various collaboration strategies?
RQ 4: What is the citation advantage of leadership in international collaborations? RQ 5: How do these relationships vary according to the scientific capacity of nations?
We consider three different types of papers (national, international, and non-collabora-tion), average normalized citations, as well as two indicators of scientific capacity: relative investments in R&D (GERD / GDP) and total numbers of papers. While the first indicator of research capacity is scale independent (i.e., relative), the second one is absolute and measures the ‘raw’ research capacity of a country. We analyze relationships and patterns in each country with a special emphasis on their significance when a country acts as a leader in international partnerships.
Background
Scientific capacity and dependency. Government and industry R&D spending
increas-ingly favors cooperation. Funding agencies, however, differ in their approach to collaboration. While European agencies foster international collaboration through funding programs [27], countries like the US tend to focus their funding internally, creating incentives for national collaboration [47]. These different approaches have implications for building and maintaining scientific capacity, defined as the infrastructure, investment, institutional and regulatory framework, and personnel available to conduct scientific research and technological develop-ment [48].
and analysis, decision to publish, or preparation of the manuscript.
Competing interests: The authors have declared
For developing countries, collaboration may have mixed benefits in building scientific capacity. There is increasing recognition of the need for greater efforts aimed specifically at building the capacity of developing countries to generate, disseminate, and use S&T to address both current and future needs in national, regional, and international arenas [49]. There remain, however, persistent disparities among countries in their capacity to create and use knowledge and technology for development and to participating and competing in the scien-tific and technology-based global marketplace [50–52].
Many countries with weaker scientific capacity depend upon international collaboration, which may impede the development of their capacity and diminish attention to topics of national priority [53–54]. Striking the balance between local and global science remains a chal-lenge [55]. It has been debated whether international relationships fulfill the needs of develop-ing countries: research topics may be more reflective of the research interests of international partners than those of their own country [47]. Therefore, relations of scientific co-operation among countries and processes of internationalization are understood as an unequal structure of output and divulgation of knowledge on the part of industrialized countries as opposed to peripheral ones [56–59]. Hence, while international collaboration is associated with higher sci-entific impact and economic growth, this relationship may not have symmetrical benefits [60]. This tension between national and international science is also reflected in research evaluation frameworks, in which publication-based evaluations create biases against the research agendas and dissemination languages of the non-English speaking countries [61–65].
Leadership in science. Leadership in scientific research has been the focus of several
stud-ies. These have shown that scientific leaders are associated with a capacity to recruit necessary resources and expertise to launch and sustain projects [48], and are associated with higher pro-duction and scientific impact [66–67]. From a bibliometric point of view, leadership has been measured through authorship position. Authorship is the mechanism through which research-ers—and by extension the institutions, countries and geographical regions to which they belong—are acknowledged for their research activities and, thereby, demonstrate scientific capacity [32,68–70]. The position of authors in the byline of scholarly publications can be determined by their contribution to a piece of research [33,35,71–73]. Despite disciplinary differences in authorship practices, we generally observe that first, last and corresponding author are more dominant contributors than middle authors [37,69].
To limit irresponsible authorship listing, the International Committee of Medical Editors (ICMJE) decided on a number of authorship criteria that should be met, and details what the role of corresponding authors is. It states that the corresponding author takes primary respon-sibility for communication with the journal during the manuscript submission, peer review, and publication process, and typically ensures that all the journal’s administrative require-ments are properly completed. The corresponding author should be available to respond to editorial queries in a timely way, and should be available after publication to respond to cri-tiques of the work and cooperate with any requests from the journal for data or additional information should questions about the paper arise after publication [74].
Perception-based studies reinforce the dominant role of corresponding authorship [33,37]. Being named as a corresponding author—generally the first or the last author [24,31,38,40,
75–76]—confers greater acknowledgment, leadership, seniority or dominance; in contrast, absence in these roles could be associated with subordination or secondary role [43]. First and last-authored positions have also been used as proxies for leadership and indicators of the strength of a science system [73]. For example, the importance of author position—especially corresponding authorship—in promotion or tenure cases demonstrates the emphasis placed on these roles [32]. Some countries gone so far as to monetized this position of leadership: Korea, China, and Pakistan all have governmentally funded incentive structures for those who
are first and corresponding authors on papers in journals such asScience, Nature, or Cell
[77–78].
The concept of a research guarantor has also been suggested as an indicator of leadership. This concept considers the guarantor not to be an individual corresponding author, but rather the research group or institution to which the corresponding author belongs. Studies on guar-antors have found differences in normalized impact and corresponding author distribution depending on the international collaboration rates and degree of scientific development of the collaborating countries [38]. The effect of the research guarantor on scientific impact was ana-lyzed for more than 500 institutions worldwide demonstrating regional differences in the effects of leadership [39]. Analyses of the field of nanoscience and nanotechnology have shown that countries with the highest international collaboration present the lowest leadership [40]; opposite findings were obtained for Latin-American institutions, which have high leadership and low international collaboration in the field of Public Health and Medicine [42,46]. Others found that developing countries’ scholarly impact is higher when they do not assume leading roles [42]. However, benefits in terms of citations may not be equally distributed among all countries engaging in these practices and may vary according to a leadership role and scientific capacities. For example, in the fields of tropical medicine, parasitology and pediatrics, coun-tries with low and middle human development are less likely to lead international collabora-tions, and obtain much lower citation rates [43]. Some of these studies suggest that scientific collaboration and the establishment of alliances with more developed countries constitute an important mechanism through which less developed countries can be integrated into research activities. A review and validation of this approach has been recently published [44]. Building on these studies, in this analysis, we use corresponding authors’ country of affiliation as an indicator of scientific leadership in international collaboration.
Materials and methods
Data for this paper were retrieved from Clarivate AnalyticsScience Citation Index Expanded
(SCIE), Social Sciences Citation Index (SSCI), and Arts and Humanities Citation Index (AHCI).
For the selected period (2000–2016), the database includes 19,460,980 papers (articles and reviews). The analysis is limited to the 94 countries that produced at least 7,000 documents over the entire period studied; those account for more than 98% of the world output (S1 Table). Research and Development (R&D) expenditures were drawn from the World Data Bank [79] for all countries except for Taiwan, for which we use OECD data.
For each of the countries analyzed, papers were grouped into three mutually exclusive cate-gories, based on the institutional addresses of the authors: 1) papers that only have a single institution (no inter-institutional collaboration), 2) papers that have at least two institutions from at the same country (national collaboration), and 3) papers that have at least two institu-tions from at least two different countries (international collaboration). Leadership was mea-sured through the country of affiliation of the corresponding author, and all others are considered as non-leading countries.
The number of citations of each paper was normalized by the average citations of all papers published in the same discipline in the same year [80–82], to obtain the Mean Normal-ized Citation Score. The field and subfield definition used here was that of the National Sci-ence Foundation. When the MNCS is above 1, it means that the papers have obtained, on average, impact above the world average; when it is below 1, it means the opposite. One of the focal points of the analysis is the degree to which a country benefits (as measured through citations) when it leads international collaborations. The benefit indicator is calculated as the difference between normalized citations when in a leading role versus a non-leading role, for
internationally-collaborative publications. If the value is negative, the country does not derive benefits from collaborations when it is in a leading role. This difference should be interpreted within the contextual frame of the overall production of a given country.
Research and Development (R&D) expenditures as a proportion of GDP, defined by the World Bank, were used as an indicator of the economic capacity of countries. GERD is composed of three main components: Business Expenditure on R&D (BERD), Higher Educa-tion Expenditure on R&D (HERD), and Government Intramural Expenditure on R&D (GOVERD). We categorize countries into four groups: those countries investing more than 2% (17 countries—green color); those investing less than 2%, but more than 1% (17 countries— blue color); countries investing less than 1%, but more than 0.5% (18 countries—orange color); and countries investing less than 0.5% (40 countries—red color). As shown, these groups are not of equal size.
Results
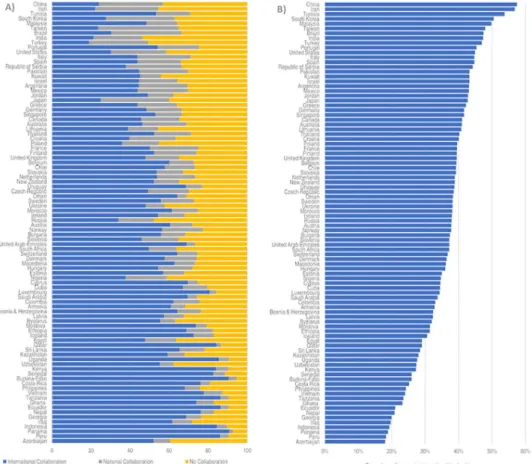
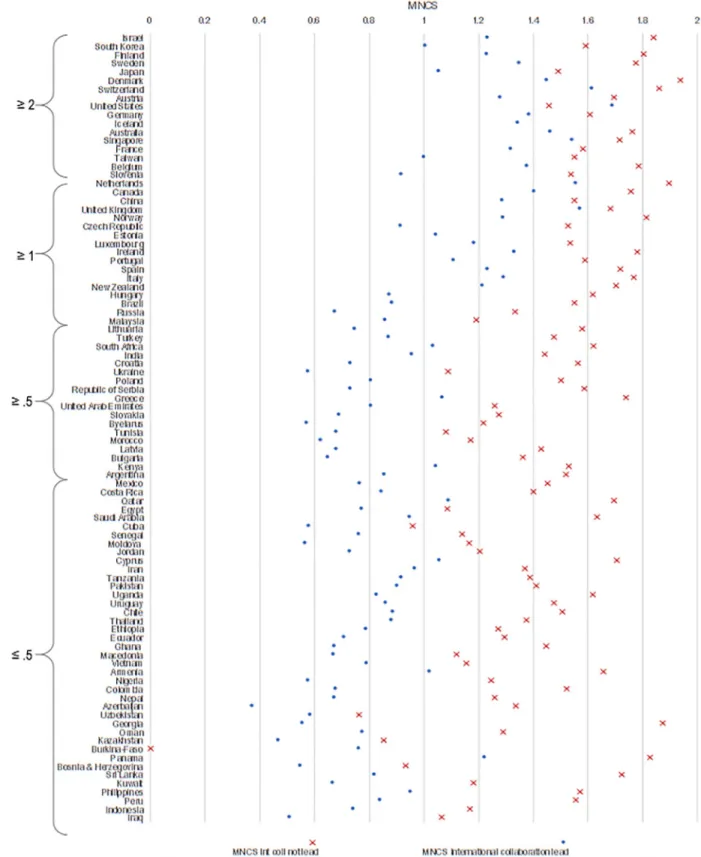
Countries vary in the proportion of their output that is a result of international collaboration (Fig 1). For many Asian countries (e.g., China, South Korea, Taiwan, and Japan), the propor-tion of domestic collaborapropor-tions exceeds the proporpropor-tion of internapropor-tional collaborapropor-tion. On the other end of the spectrum, several smaller and less developed countries (e.g., Azerbaijan, Peru, Panama and Iraq, depend almost exclusively on international collaboration for their output, with low degrees of domestic collaboration and sole authorship.
Fig 1. Percentage of papers in international collaboration, national collaboration and without collaboration (panel A), and proportion international collaboration papers in a leadership position (panel B), 2000–2016.
These results are consistent with several previous results on collaboration, which demon-strate the effects of size, geographic proximity, and socio-political-economic affinities on the collaboration behavior of a country [83,84]. However, the situation is more nuanced when examining those countries with low degrees of international collaboration. While these coun-tries—notably, China, Iran, Brazil, and the United States—vary in size and scientific capacity, they are each economic leaders in their region of the world, which might explain their lower proportion of international collaboration [17,85]. Despite the differing opportunities for and engagement with international collaboration, an almost invariant inverse relationship can be observed between the percentage of international collaboration and the proportion of papers in which the country is in a leadership role. That is, the lower the international collaboration rate of a country, the more likely it is to serve as the lead on international collaborations. This reinforces the findings of previous studies [38,43–44].
These differences might be explained by differences in the scientific capacity of countries. We use number of papers as an indicator of scientific activity, and GERD/GDP of countries as an indicator of funding intensity. Taken together, these indicators provide a more informed understanding of underlying mechanisms of international collaboration and leadership.
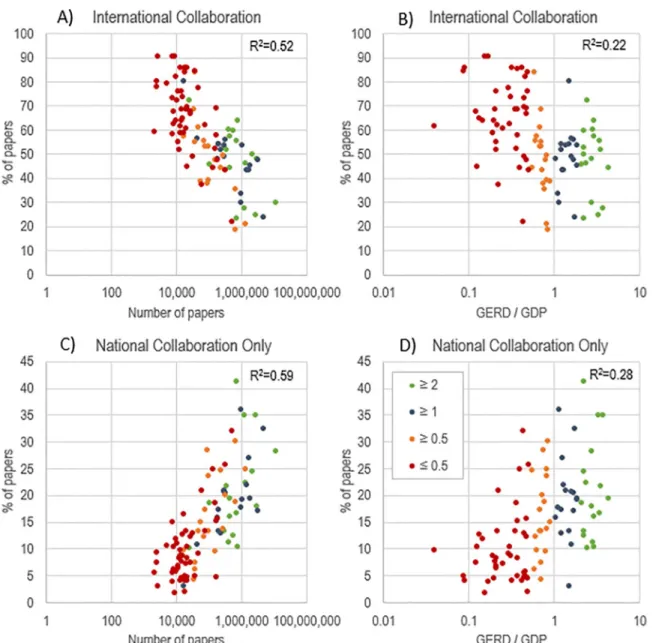
Fig 2depicts the relationship between scientific capacity indicators (i.e., number of papers and GERD/GDP) and the proportion of papers in international and national collabo-ration (statistical analysis in Fig B inS1 Fig). As shown in the logarithmic plots, there is a negative relationship between the proportion of papers in international collaboration (with a significant coefficient of determination (0.52) and their GERD/GDP (0.22), whereas a pos-itive relationship can be observed between the proportion of papers in national collaboration (0.59) and investment (0.28). Simply put, the greater the scientific capacity of a country, the more internalized the production. This is fairly intuitive: the more a country invests in R&D, the greater its capacity for creating infrastructure, training skilled researchers, attract-ing talent, and creatattract-ing cohesion among domestic institutions. Countries with low invest-ments are more dependent on resources and other forms of capital held by developed countries.
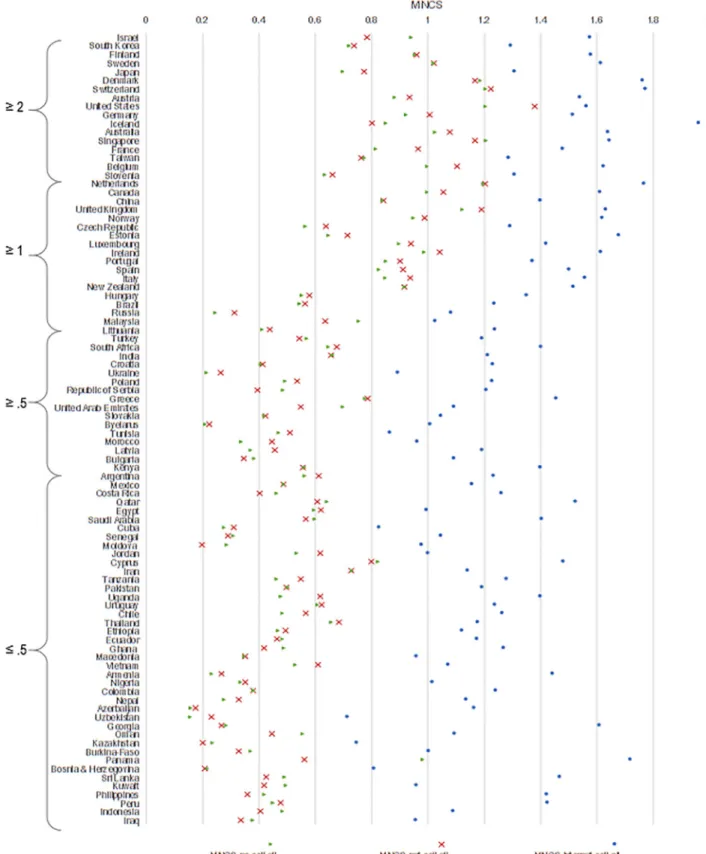
R&D investments are also strongly related to citation gains [30,40,86–87]. As shown inFig 3, those countries that invest more than 2% of their GDP into R&D realize higher citation gains than those with lower levels of research investment, although the difference between papers in international collaboration and other papers is smaller. In all cases, international col-laboration has a higher citation gain than national colcol-laboration [88]. For countries with less than 1% of GDP dedicated to research, only the products of their international collaboration yield greater than the world average in terms of citations. On average, domestic output from these countries garners rates at lower than the world average. This suggests a strong relation-ship between international production and citation. The only countries which obtain citations above the world average in their non-collaborative leading outputs are Sweden, Denmark, Switzerland, the United States, Australia and Singapore.
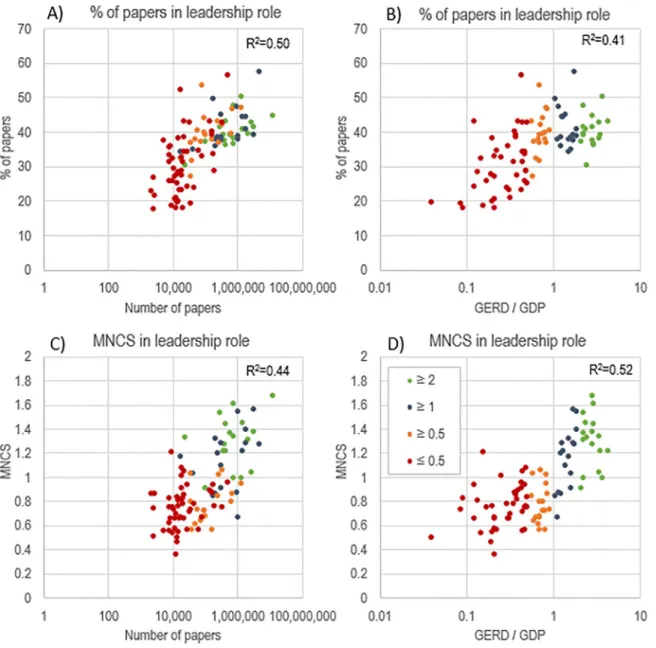
Fig 4presents the percentage of papers in leadership role as a function of number of papers (panel A) and of GERD / GDP (panel B), and the MNCS in leadership role as a function of number of papers (panel C) and of GERD / GDP (panel D). A logarithmic plot of the data shows that there is a significant coefficient of determination between the number of papers (0.5) and investment (0.41) with leading international papers (statistical analysis in inS2 Fig). Nations with greater research capacity—be it in terms of absolute numbers of papers or rela-tive R&D investments—and research performance are more likely to serve as leaders and gar-ner higher citations when they lead (Fig 5). Countries with the highest research investment obtain citation rates above the world average on any paper on which they collaborate—regard-less of whether they are in a leadership position, with the exception of Slovenia (among the
countries with the highest investment) and some Eastern European countries (i.e., Russia, Malaysia, and Turkey) among those investing more than 1%. However, countries with the low-est invlow-estment only achieve above world average positions when they are in non-leading posi-tions (with few excepposi-tions: i.e., Greece and Kenya).
To investigate this further, we calculate the difference between the average field-normalized citation impact on papers when countries are in leading and non-leading positions (Fig 6). As shown, the United States is the only country that benefits, in terms of citations, when playing a leading role on scientific publications. In all other cases, there is a greater citation gain, on average, when countries assume a non-leading position. This corroborates findings of previous studies [38,43–44].
Fig 2. Relationship between the percentage of papers in international collaboration and number of papers (panel A) and GERD / GDP (panel B), and between the percentage of papers in national collaboration and number of papers (panel C) and GERD / GDP (panel D), by country, 2000–2016.
Fig 3. MNCS of papers with no collaboration, in national collaboration, and in international collaboration, by country, 2000–2016.
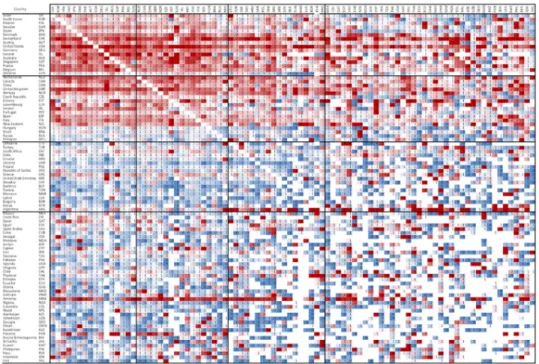
This does not imply, however, that there is never a citation advantage for other countries when leading. This impact is often realized in localized partnerships or in partnerships of equalized research investment.Fig 7presents a heat map of the MNCS of international part-nerships by country, where the rows represent leading positions and the columns, non-leading positions. As evident, there is a relatively high citation payoff when countries with greater rela-tive investment are in leadership positions. For example, Argentina achieves relarela-tively high
citation averages when leading with other countries of low scientific capacity.
Discussion
Competition in the knowledge economy is affected by several factors: differences in institu-tional settings and cultures [5,8], national scientific profiles [20,89–90], scientific policies and
Fig 4. Percentage of papers in leadership role as a function of number of papers (panel A) and of GERD / GDP (panel B), and the MNCS in leadership role as a function of number of papers (panel C) and of GERD / GDP (panel D), by country, 2000–2016.
Fig 5. MNCS of papers in international collaboration, when in leadership role and when not leading, by country, 2000–2016.
economic capacities [47,91], and mobility [26,30], among other things. One avenue for over-coming these constraints is to seek out international partners with the necessary resources and expertise. Our analysis sought to understand the balance of this activity across nations and the relative advantages for countries according to their status as corresponding authors.
We found that the greater the research activity of a nation (in terms of number of papers), the more internalized the production. This is not a particularly novel finding: others have dem-onstrated that size often drives international collaboration [83–84,92–93]. One should not, however, conflate size of country with size of production. For example, the United States and Japan both have highly productive scientific systems and similar profiles in terms of interna-tional collaboration. The higher the skilled personnel and amount of resources within a coun-try, the more scientific independence; the inverse creates dependencies, as shown through the high rates of international partnerships [94].
Fig 6. Gain in MNCS when leading international collaborations, by country, 2000–2016.
These dependencies are not necessarily negative. Greater institutional cohesion among countries may have positive implications in nations’ performance and overall benefits for the geography of science [15,39,95–96]. These relationships are not politically neutral, however. For example, countries like Iran, Turkey, and India show the lowest level of internationaliza-tion (Fig 1), though the probabilities for establishing international partnerships are quite dif-ferent among them. For example, Iran has experienced several embargos over the last decade and recently suffers visa restrictions from the US, which may affect their openness, whereas India and Turkey show high levels of international mobility [29]. Simply put, nations do not have the same opportunities to access to the global scientific market and the notion of open-ness works at different levels depending on the scientific capacities of countries and its ability to maintain and attract talent [30].
While international collaboration is positively related to citation impact (as shown in sev-eral other studies [20–22]), international leadership is inversely related to international collab-oration and there is a very little relationship with citation impact and international leadership. As measured by MNCS, our results show that high levels of leadership without international collaboration may be an indicator of either research isolation (for small and developing coun-tries) or consolidated scientific systems (for advanced and resourced councoun-tries). These find-ings are consistent with previous studies, which have shown that highly cited publications are negatively linked to leadership [39–40] since high values of leadership are more valuable and competitive for internationally collaborative papers [46].
Overall, nearly all countries have higher citation impact when they do not play a leading role in international publications. However, this gain differs considerably from one country to another (Fig 6). From a policy perspective, we might assume that countries with lower ben-efit rates (e.g., 20–25%) may be those with fairly high scientific capacity; whereas those with larger rates are those with strong dependencies. Only the most consolidated scientific
Fig 7. Matrix of the MNCS of international collaboration ties between countries, 2000–2016. Rows represent
leading positions; columns represent non-leading positions. Results are presented as percentiles of MNCS.
systems, (e.g., United States, Switzerland, Sweden, Finland, Singapore and Australia), obtain higher citation impact when they lead international collaborations (with the exceptions of Greece and Kenya) (Fig 5). There is, of course, a tradeoff: even in the case of consolidated sci-entific systems, domestic collaboration directly increases national capacity, while foreign countries would potentially increase the knowledge base and resources available for local development.
Limitations and future work
Research leadership based on corresponding authorship and international collaboration, although limited and not equally valid in all domains of science and scholarship [35–46], advances our ability to assign credit and responsibility at the global level. However, this is com-plicated by changing practices in authorship. Perhaps as a result of the emphasis on lead authorship in evaluation [97–98], there is a growing number of joint- first, last, and corre-sponding authorships [99].
It has been argued that analyses at lower levels of disciplinary aggregation more accurately represent the strengths of countries [20,90]. This is certainly an element of analysis that requires further scrutiny—it can be hypothesized that concentration in certain specialties may have an impact on production and leadership. Additionally, as our analysis is based on mostly English language papers, a sizeable proportion of papers authored by researchers in non-Western countries are not covered, and those might exhibit different collaboration pat-terns [63–66].
Data on GERD is also imperfect. This is especially the case when grouped according to level of funding intensity, where there may exist important national disparities—particularly in the case of those countries with less than 0.5%. The use of this indicator instead of Gov-ernment Budget Allocations or Outlays on R&D (GBARD) used in other studies [30,87] is justified because we are interested in the level of infrastructure, human capital, and com-mitment in R&D activities for each country. Limiting the analysis only to government spending and/or Higher Education may be justified when analysis is focused in some spe-cific nations [100], but that may exclude outputs and human capital funded by private companies.
Although indicators based on average citation counts are frequently used, they are also criti-cized in the literature [101–102]. Additional analyses should incorporate other indicators based on the idea of counting highly cited publications [103]. On the other hand, our analysis revealed the asymmetric relationship of citation impact and leadership (Fig 7): while there is a high degree of reciprocity in countries with high scientific capacity, the relationship becomes asymmetrical for countries with lower capacities. However, interesting regional variations can be observed, as well as unique outliers. These countries should serve as a focus for future study: understanding the mechanisms that make a country a high-impact regional leader will be an important consideration for policy purposes.
Conclusion
Strategies for international collaboration do not equally benefit all countries. A disproportion-ately high reliance on international collaboration may imply that a country lacks the resources necessary to be independent. Collaboration may facilitate scientific advancement in that country, but it comes at a cost. For relatively disadvantaged countries, there is no citation ben-efit to lead research, but there is one for collaborating. In an era where bibliometric indicators play an important role in the allocation of resources, this may dissuade researchers and institu-tions from developing and leading their own research agenda, with potentially negative
consequences in terms of linguistic and topical diversity. Robust science policy must take into account inequalities in labor and reward rather than defaulting to a universal strategy towards international collaboration.
Supporting information
S1 Fig. Results of statistical analysis describing relationship between scientific capacity indicators and the proportion of papers in international and national collaboration.
(XLSX)
S2 Fig. Results of statistical analysis describing relationship between the scientific capacity indicators and the proportion of leading international papers.
(XLSX)
S1 Table. Data and indicators used in the study.
(XLSX)
Acknowledgments
The authors appreciate the comments of the reviewers, which served to improve the quality and clarity of the manuscript, as well as support in the statistical analysis of data offered by Manuel Escabias (University of Granada).
Author Contributions
Conceptualization: Zaida Chinchilla-Rodrı´guez. Data curation: Vincent Larivière.
Formal analysis: Zaida Chinchilla-Rodrı´guez, Cassidy R. Sugimoto, Vincent Larivière.
Funding acquisition: Zaida Chinchilla-Rodrı´guez, Cassidy R. Sugimoto, Vincent Larivière.
Investigation: Zaida Chinchilla-Rodrı´guez, Cassidy R. Sugimoto, Vincent Larivière.
Methodology: Zaida Chinchilla-Rodrı´guez, Cassidy R. Sugimoto, Vincent Larivière.
Validation: Zaida Chinchilla-Rodrı´guez, Cassidy R. Sugimoto, Vincent Larivière.
Visualization: Zaida Chinchilla-Rodrı´guez, Cassidy R. Sugimoto, Vincent Larivière.
Writing – original draft: Zaida Chinchilla-Rodrı´guez, Cassidy R. Sugimoto, Vincent
Larivière.
Writing – review & editing: Zaida Chinchilla-Rodrı´guez, Cassidy R. Sugimoto, Vincent
Larivière.
References
1. Deutsch M. A theory of co-operation and competition. Hum Relat. 1949; 2(2):129–152.
2. Van der Besselaar P. Hemlin S. van der Weijden I. Collaboration and competition in research. Higher Education Policy. 2012; 25(3):263–266.
3. Bourdieu P. The specificity of the scientific field and the social conditions of the progress of reason. 1975. Social Science Information. 1975; 14(6):19–47
4. Hagstrom WO. Competition in science. Am Sociol Rev. 1974; 39: 1–18.
5. Whitley R. The Intellectual and Social Organisation of the Sciences. Oxford, England: Oxford Univer-sity Press; 1984
6. Anderson MS, Ronning EA, De Vries R, Martinson BC. The perverse effects of competition on scien-tists’s work and relationships. Sci Eng Ethics. 2007; 13(4): 437–461. https://doi.org/10.1007/s11948-007-9042-5
7. UNESCO. UNESCO Science Report Towards 2030. UNESCO Publishing; 2015
8. European Commission. Enhancing and focusing EU International Cooperation in Research and Inno-vation: A Strategic Approach. Brussels, COM (2012) 497 final. 2012.Available from: at:http://ec. europa.eu/research/iscp/pdf/policy/com_2012_497_communication_from_commission_to_inst_en. pdf#view=fit&pagemode=none
9. Leahey E, Reikowsky R. Research specialization and collaboration patterns in sociology. Soc Stud Sci. 2008; 38(3)425–440
10. Suresh S. Global challenges need global solutions. Nature. 2012; 490, 337–32https://doi.org/10. 1038/490337aPMID:23075966
11. Sonnenwald DH. Scientific collaboration. Annual Review of Information Science and Technology. 2008; 41, 643–681
12. Freeman RB. Globalization of scientific and engineering talent: international mobility of students, work-ers, and ideas and the world economy. Economics of Innovation and New Technology. 2010; 19 (5):393–406.
13. Wuchty S, Jones BF, Uzzi B. The increasing dominance of teams in production of knowledge. Sci-ence. 2007; 316(5827):1036–1039.https://doi.org/10.1126/science.1136099PMID:17431139 14. Wagner CS, Leydesdorff L. Network structure, self-organization, and the growth of international
collab-oration in science. Res Policy. 2005; 34:1608–1618
15. Wagner CS, Park HW, Leydesdorff L. The Continuing Growth of Global Cooperation Networks in Research: A Conundrum for National Governments. PLoS ONE. 2015; 10(7): e0131816.https://doi. org/10.1371/journal.pone.0131816PMID:26196296
16. Adams J. The rise of research networks. Nature. 2012; 490,335–336https://doi.org/10.1038/490335a
PMID:23075965
17. Bornmann L, Wagner C, Leydesdorff L. BRICS countries and scientific excellence: A bibliometric anal-ysis of most frequently cited papers. J Assoc Inf Sci Technol. 2015; 66(7): 1507–1513.
18. Etzkowitz H, Leydesdorff L. The Dynamics of Innovation: From National Systems and ‘Mode2” to a Tri-ple Helix of University-Industry-Goverment Relations. Res Policy, 2000; 29(2):109–123
19. Larivière V, Macaluso B, Mongeon P, Siler K, Sugimoto CR. Towards an academic monopoly of basic research? Submitted to PLoS ONE
20. Gla¨nzel W. National characteristics in international scientific co-authorship relations. Scientometrics. 2001; 51, 69–115
21. Gazni A, Sugimoto CR, Didegah F. Mapping world scientific collaboration: authors, institutions, and countries. J. Am. Soc. Inform. Sci. Technol. 2012; 63:323–335
22. Persson O. Are the highly cited papers more international? Scientometrics. 2010; 83:397–401.
23. Larivière V, Gingras Y, Sugimoto CR, Tsou A. Team size matters: Collaboration and scientific impact since 1900. J Assoc Inf Sci Technol. 2014; 66(7):1323–1332.
24. Hsiehchen D, Espinoza M, Hsieh A. Multinational teams and diseconomies of scale in collaborative research. Sci Adv. 2015; 1(8) e1500211https://doi.org/10.1126/sciadv.1500211PMID:26601251 25. Fortunato S, Bergstrom CT, Bo¨rner K, Evans JA, Helbing D, MilojevićS, et al.. Science of science.
Sci-ence. 2018; 359, eaao0185.https://doi.org/10.1126/science.aao0185PMID:29496846
26. Sugimoto CR, Robinson-Garcı´a N, Murray DR, Yegros-Yegros A, Costas R, Lariviere V. Scientists have most impact when they are free to move. Nature, 2017; 32(550):29–31
27. Organization for Economic Cooperation and Development, OECD. The Global Competition for Talent: Mobility of the Highly Skilled. OECD Publications; 2008
28. European Commission. Lisbon Strategy Evaluation Document (SEC (2010) 114 final). European Commission, Brussels; 2010
29. Chinchilla-Rodrı´guez Z, Miao L, Murray D, Robinson-Garcı´a N, Costas R, Sugimoto CR. A global com-parison of scientific mobility and collaboration according to national scientific capacities. Front Res Metr Anal. 2018; 3:17.https://doi.org/10.3389/frma.2018.00017
30. Wagner CS, Whetsell T, Baas J, Jonkers K. Openness and impact of leading scientific countries. Front Res Metr Anal. 2018; 3:10.https://doi.org/10.3389/frma.2018.00010
31. Tscharntke T, Hochberg ME, Rand TA, Resh VH, Krauss J. Author sequence and credit for contribu-tions in multiauthored publicacontribu-tions. PLoS Biol. 2007; 5(1): e18.https://doi.org/10.1371/journal.pbio. 0050018PMID:17227141
32. Franzoni C, Scellato G, Stephan P. Changing incentives to publish. Science. 2011; 333(6043), 702– 703https://doi.org/10.1126/science.1197286PMID:21817035
33. Wren JD, Kozak KZ, Johnson KR, Deakyne SJ, Schilling LM, Dellavalle RP. The write position. A sur-vey of perceived contributions to papers based on byline position and number of authors. EMBO Reports. 2007; 8(11): 988–991https://doi.org/10.1038/sj.embor.7401095PMID:17972896 34. MarusˇićA, Bosˇnjak L, JerončićA. A systematic review of research on the meaning, ethics and
prac-tices of authorship across scholarly disciplines. PLoS ONE. 2011; 6(9): e23477.https://doi.org/10. 1371/journal.pone.0023477PMID:21931600
35. Davies HD, Langley JM, Speert DP. Rating authors’ contributions to collaborative research: the PIC-NIC survey of university departments of pediatrics. Can Med Assoc J. 1996; 155:877–882
36. Mattsson P, Sundberg CJ, Laget P. Is correspondence reflected in the author position? A bibliometric study of the relation between corresponding author and byline position. Scientometrics. 2011; 87:99– 105.
37. Bhandari M, Guyatt GH, Kulkarni AV, Deveraeaux PJ, Leece P, Bajammal S. et.al.. Perceptions of authors’ contributions are influenced by both byline order and designation of corresponding author. J Clin Epidemiol. 2014; 67:1049–1054https://doi.org/10.1016/j.jclinepi.2014.04.006PMID:24973824 38. Moya-Anego´ n F, Guerrero-Bote VP, Bornmann L, Moed HF. The research guarantors of scientific
papers and the output counting: a promising new approach. Scientometrics. 2013; 97:421–434
39. Manganote EJ, Araujo MS, Schulz PA. Visualization of ranking data: Geographical signatures in inter-national collaboration, leadership and research impact. J Informetr. 2014; 8(3):642–649
40. Bordons M, Gonza´ lez-Algo B, Aparicio J, Moreno L. The influence of R&D intensity of countries on the impact of international collaborative research: evidence from Spain. Scientometrics. 2014; 102:1385– 1400
41. Chinchilla-Rodrı´guez Z, Ocaña-Rosa K, Vargas-Quesada B. How to Combine Research Guarantor and Collaboration Patterns to Measure Scientific Performance of Countries in Scientific Fields: Nanoscience and Nanotechnology as a Case Study. Front Res Metr Anal. 2016; 1:2.https://doi.org/ 10.3389/frma.2016.00002
42. Arencibia-Jorge R, Corera-Alvarez E, Chinchilla-Rodrı´guez Z, Moya-Anego´n F. Scientific output of the emerging Cuban biopharmaceutical industry: a scientometric approach. Scientometrics. 2016; 108 (3):1621–1636
43. Gonza´lez-Alcaide G, Park J, Huamanı´ C, Ramos JM. Dominance and leadership in research activities: Collaboration between countries of differing human development is reflected through authorship order and designation as corresponding authors in scientific publications. PLoS ONE. 2017; 12(8): e0182513.https://doi.org/10.1371/journal.pone.0182513PMID:28792519
44. Moya-Anego´ n F, Guerrero-Bote VP, Lo´pez-Illescas C, Moed H. Statistical relationships between cor-responding authorship, international co-authorship and citation impact of national research systems. J Informetr. 2018; 12, 1251–1262
45. Gonza´lez-Alcaide G, Gorraiz JI. Assessment of Researchers Through Bibliometric Indicators: The Area of Information and Library Science in Spain as a Case Study (2001–2015). Front. Res. Metr. Anal. 2018; 3:15.https://doi.org/10.3389/frma.2018.00015
46. Chinchilla-Rodrı´guez Z, Zacca-Gonza´lez, Vargas-Quesada B, Moya-Anego´n F. (2016). Benchmark-ing scientific performance by decomposBenchmark-ing leadership of Cuban and Latin American institutions in Public Health. Scientometrics, 106(3), 1239–1264.
47. Lyons EE, Colglazier W, Wagner CS, Bo¨rner K, Dooley DM, Mote CD Jr, et al. How Collaborating in International Science Helps America. Science & Diplomacy. 2016; 5(2). Available from:http://www. sciencediplomacy.org/article/2016/how-collaborating-in-international-science-helps-america 48. Wagner CS, Brahmakulam I, Jackson B, Wong A, Yoda T. Science and Technology Collaboration:
Building Capacities in Developing Countries. Santa Monica, CA: RAND; 2001
49. Parliamentary Office of Science and Technology. Scientific capacity in developing countries. Postnote. 2004; 216.http://researchbriefings.files.parliament.uk/documents/POST-PN-216/POSTPN-216.pdf 50. Freeman P, Miller M. Scientific capacity building to improve population health: Knowledge as a global
public good. Report Prepared for the WHO Commission on Health and Macroeconomics. 2001
51. Hassan MHA. Building capacity in the life sciences in the developing world. Cell. 2007; 131(2), 433–436
52. United Nations Economic and Social Council. Science, technology and engineering for innovation and capacity-building in education and research. 2009. E/CN.16/2009/3.http://unctad.org/en/Docs/ ecn162009d3_en.pdf
53. Moravcsik MJ. Mobilizing science and technology for increasing the indigenous capability in develop-ing countries. Bull Sci Technol Soc. 1981; 1(4):355–377.
54. Moravcsik MJ. Applied scientometrics: An assessment methodology for developing countries. Scien-tometrics. 1985; 7(3–6):165–176.
55. Nature Editorial. Global reach. Nature. 2012; 490: 309–310.
56. Vessuri HMC. Ciencia acade´mica en la Venezuela moderna. Caracas: Fondo Editorial Acta Cientı´fica Venezolana; 1984.
57. Alatas SF. Academic dependency in the social sciences: Reflections on India and Malaysia. Am Stud Int. 2000; 38(2): 80–96.
58. Kreimer P. ¿Dependientes o integrados? La ciencia latinoamericana y la nueva divisio´ n internacional del trabajo. No´mada. 2006; 24:190–212.
59. Beigel F, Sabea H. Dependencia acade´mica y profesionalizacio´n en el sur. Perspectivas desde la periferia. Mendoza: EDIUNC; Rio de Janeiro: SEPHIS; 2014
60. Arunachalam S. The global research village: A view from the periphery; 2002.https://idl-bnc-idrc. dspacedirect.org/handle/10625/6007.
61. Donovan C. Introduction: Future pathways for science policy and research assessment: metrics vs. peer review, quality vs. impact. Sci Public Policy. 2007; 34(8):538–542
62. Moya-Anego´ n F, Chinchilla-Rodrı´guez Z, Vargas-Quesada B, Corera-A´ lvarez E, Muñoz-Ferna´ ndez FJ, Gonza´ lez-Molina A, et al. Coverage analysis of Scopus: A journal metric approach. Sciento-metrics. 2007; 73(1):53–78.
63. Mongeon P, Paul-Hus A. The journal coverage of Web of Science and Scopus: a comparative analy-sis. Scientometrics. 2016; 106(1):213–228.
64. Egghe L, Rousseau R. Partial orders and measures for language preferences. J Am Soc Inf Sci. 2000; 51(12):1123–1130.
65. Van Leeuwen T, Moed H, Tijssen R, Visser M, Van Raan A. Language biases in the coverage of the Science Citation Index and its consequences for international comparisons of national research perfor-mance. Scientometrics. 2001; 51(1), 335–346.
66. Klavans R, Boyack KW. Thought leadership: A new indicator for national and institutional comparison. Scientometrics. 2008; 75: 239–250.
67. Klavans R, Boyack KW. Toward an objective, reliable and accurate method for measuring research leadership. Scientometrics. 2010; 82: 539–553.
68. Larivie´re V, Desrochers N, Macaluso B, Mongeon P, Paul-Haus A, Sugimoto CR. Contributorship and division of labor in knowledge production. Soc Stud Sci. 2016; 46 (3):417–435https://doi.org/10.1177/ 0306312716650046PMID:28948891
69. Rennie D. Flanain A Yank A. The contributions of authors. JAMA. 2000; 284:89–91 PMID:10872020 70. Adam T, Ahmad S, Bigdeli M, Ghaffar A, Rottingen JA. Trends in health policy and systems research
over the past decade: still too little capacity in low-income countries. PLoS ONE. 2011; 6: e27263
https://doi.org/10.1371/journal.pone.0027263PMID:22132094
71. Liu XZ. Fang H. Scientific group leader’s authorship preferences: an empirical investigation. Sciento-metrics. 2014; 98:909–925
72. Gauffriau M. A categorization of arguments for counting methods for publication and citation indica-tors. J Informetr. 2017; 11:672–684
73. Van Leeuwen TN. Strength and weakness of national science systems. A bibliometric analysis through cooperation patterns. Scientometrics. 2009; 79(2):389–408.
74. ICMJE. Recommendations for the Conduct, Reporting, Editing, and Publication of Scholarly Work in Medical Journals. 2017http://www.icmje.org/icmje-recommendations.pdf
75. Costas R, Iribarren-Maestro I. Variations in content and format of ISI databases in their different ver-sions: The case of the Science Citation Index in CD-ROM and the Web of Science. Scientometrics. 2007; 72: 167–183
76. Frandsen TF, Nicolaisen J. What is in a name? Credit assignment practices in different disciplines. J Informetr. 2010; 4 (4): 608–617.
77. Fuyuno I, Cyranoski D. Cash for papers: putting a premium on publication. Nature. 2006; 441:792.
https://doi.org/10.1038/441792bPMID:16778850
78. Quan W, Chen B, Shu F. Publish or impoverish: An investigation of the monetary reward system of sci-ence in China (1999–2016). Aslib Proc. 2017; 69 (5):486–502
79. World Bank. World Development Indicators.http://wdi.worldbank.org/tables/
80. Moed HF, De Bruin RE, van Leeuwen TN. New bibliometric tools for the assessment of national research performance: Database description, overview of indicators and first applications. Sciento-metrics. 1995; 33(3):381–422.
81. Schubert A, Braun T. Relative indicators and relational charts for comparative assessment of publica-tion output and citapublica-tion impact. Scientometrics. 1986; 9(5–6): 281–291.
82. Waltman L, van Eck NJ, van Leeuwen TN, Visser MS, van Raan AF. Towards a new crown indicator: Some theoretical considerations. J Informetr. 2011; 5(1):37–47.
83. Andersson AE, Persson O. Networking scientists. Ann Reg Sci. 1993; 27(1):11–21.
84. Zitt M, Bassecoulard E, Okubo Y. Shadows of past in international cooperation: Collaboration profiles of the top five producers of science. Scientometrics. 2000; 47(3):627–657
85. Moed HF. Iran’s scientific dominance and the emergence of South-East Asian Countries in the Arab Gulf Region. Scientometrics. 2016; 108(1):305–314
86. Gok A, Rigby J, Shapira P. The impact of research funding on scientific outputs: evidence from six smaller European countries. J Assoc Inf Sci Technol. 2016; 67(3), 715–730
87. Leydesdorff L, Bornmann L, Wagner CS. The relative influences of government funding and interna-tional collaboration on citation impact. J Assoc Inf Sci Technol. 2018;https://doi.org/10.1002/asi. 24109
88. Narin F, Stevens K, Whitlow ES. Scientific co-operation in Europe and the citation of multi-nationally authored papers. Scientometrics. 1991; 21: 313–324
89. Adams J. Benchmarking international research. Nature. 1998; 396(6712):615–618.https://doi.org/10. 1038/25219PMID:9872303
90. Radosevic S, Yoruk E. Are there global shifts in the world science base? Analyzing the catching up and falling behind of world regions. Scientometrics. 2014; 101(3):1897–1924https://doi.org/10.1007/ s11192-014-1344-1
91. King DA. The scientific impact of nations. Nature. 2004; 430: 311–316https://doi.org/10.1038/ 430311aPMID:15254529
92. Luukkonen T, Tijssen RJW, Persson O, Sivertsen G. The measurement of international scientific col-laboration. Scientometrics. 1993; 28(1):15–36
93. Ukrainski K, Masso J, Kanep H. Cooperation patterns in science within Europe: The standpoint of small countries. Scientometrics. 2014; 99(3):845–863
94. Melin G. Impact of national size on research collaboration: A comparison between European and American universities. Scientometrics. 1999; 46(1):161–170.
95. Karaulova M, Go¨k A, Shackleton O, Shapira P. Science system path-dependencies and their influ-ences: nanotechnology research in Rusia. Scientometrics. 2016; 107(2): 645–670.
96. Lewison G, Cunnigham P. Bibliometric studies for the evaluation of trans-national research. Sciento-metrics. 1991; 21(2):223–244
97. Conte ML, Maat SL, Omary MB. Increased co-first authorships in biomedical and clinical publications: a call for recognition. FASEB J. 2013; 27:3902–3904https://doi.org/10.1096/fj.13-235630PMID:
23839935
98. Moed H.F. (2008). UK Research Assessment Exercises: Informed Judgments on Research Quality or Quantity? Scientometrics. 2008; 74:141–149
99. Brand A, Allen L, Altman M, Hlava M, Scott J. Beyond authorship: attribution, contribution, collabora-tion and credit. Learned Publishig. 2015; 28:151–155
100. Leydesdorff L, Wagner C. Macro-level indicators of the relations between research funding and research output. J Informetr. 2009; 3(4): 353–362.
101. Opthof T, Leydesdorff L. Caveats for the journal and field normalizations in the CWTS (“Leiden”) evalu-ations of research performance. J Informetr. 2010; 4(3): 423–430.
102. Abramo G, D’Angelo CA. A farewell to the MNCS and like size-independent indicators. J Informetr. 2016; 10(2): 646–651
103. Leydesdorff L, Bornmann L. (2011). Percentile ranks and the integrated impact indicator (I3). J Am Soc Inf Sci. 2011; 62(11): 2133–2146