Titre:
Title:
Compact secondary treatment train combining a lab-scale moving
bed biofilm reactor and enhanced flotation processes
Auteurs:
Authors:
Catherine Brosseau, Bettina Émile, Marc-André Labelle, Édith
Laflamme, Peter L. Dold et Yves Comeau
Date: 2016
Référence:
Citation
:
Brosseau, Catherine, Émile, Bettina, Labelle, Marc-André, Laflamme, Édith, Dold, Peter L. et Comeau, Yves (2016). Compact secondary treatment train combining a lab-scale moving bed biofilm reactor and enhanced flotation processes. Water
Research, 106, p. 571-582. doi:10.1016/j.watres.2016.10.019
Document en libre accès dans PolyPublie
Open Access document in PolyPublieURL de PolyPublie:
PolyPublie URL: http://publications.polymtl.ca/2364/
Version: Version finale avant publication / Accepted versionRévisé par les pairs / Refereed Conditions d’utilisation:
Terms of Use: CC BY-NC-ND
Document publié chez l’éditeur commercial
Document issued by the commercial publisher
Titre de la revue:
Journal Title: Water Research
Maison d’édition:
Publisher: Elsevier
URL officiel:
Official URL: http://dx.doi.org/10.1016/j.watres.2016.10.019
Mention légale:
Legal notice: In all cases accepted manuscripts should link to the formal publication via its DOI
Ce fichier a été téléchargé à partir de PolyPublie, le dépôt institutionnel de Polytechnique Montréal
This file has been downloaded from PolyPublie, the institutional repository of Polytechnique Montréal
1
Research paper published in Water Research
Brosseau, C.a,b, Émile, B.a,c, Labelle, M.A.a,d, Laflamme, É.e,f, Dold, P.L.g, Comeau, Y.a* 2016.
Compact secondary treatment train combining a lab-scale moving bed biofilm reactor and enhanced flotation processes.
Water Research. 106: 571-582. doi : 10.1016/j.watres.2016.10.019.
Highlights
A treatment train combining an HR-MBBR with an enhanced flotation process was studied
CSCOD removal efficiency increased with the MBBR HRT (inversely with OLR) up to 88% An MBBR OLR of 6 to 10 kg COD m-3 reactor d-1 resulted in the best X
COD recovery MBBR effluent solids were characterized by a bimodal volume particle size distribution Enhanced flotation with green chemicals allowed to reach 10 ± 3 mg TSS/L in the MBBR
effluent
Authors
aDepartment of Civil, Geological and Mining Engineering Polytechnique Montreal
2900, Edouard-Montpetit Boulevard Montreal, Quebec, Canada H3T 1J4 yves.comeau@polymtl.ca
bKemira Water Solutions Canada Inc. 3405, Marie-Victorin Boulevard
Varennes, Quebec, Canada J3X 1P7 ext.catherine.brosseau@kemira.com SCOD CCOD Synthetic soluble influent HR-MBBR HRT: 6 to 54 min OLR: 4to 34 kg COD m-3 d-1
COD: Chemical oxy gen demand, particulate (X), colloidal (C) and soluble (S); HR-MBBR: High-rate Mov ing bed biof ilm reactor; HRT: Hy draulic retention time; OLR: Organic loading rate
SCOD XCOD HR-MBBR effluent SCOD XCOD Clarified effluent to further treatment XCCODsent to anaerobic digestion 43 to 88% of CSCOD
biotransformed into XCOD
and mineralized 63 to 73% of XCCOD captured XCOD XCOD CCOD CCOD XCOD X COD Green chemicals addition SCOD CCOD XCOD HR-MBBR effluent + chemicals XCOD 35 to 60% of COD (as X and CCOD)
added
Enhanced
flotation C
2 cSAP Canada Inc.
111, Duke Street, Suite 9000
Montreal, Quebec, Canada H3C 2M1 bettina.emile@sap.com
dWSP Canada Inc.
2525, Daniel-Johnson Boulevard, Office 525 Laval, Quebec, Canada H7T 1S9
marc.andre.labelle@wspgroup.com eVeolia Water Technologies Canada Inc. 4105, Sartelon Street
Saint-Laurent, Quebec, Canada H4S 2B3 edith.laflamme@veolia.com
fCegep Saint-Laurent 625, Sainte Croix Avenue
Montreal, Quebec, Canada H4L 3X7 edlaflamme@cegepsl.qc.ca
gEnviroSim Associates Ltd.
175, Longwood Road South, Suite 114A Hamilton, Ontario, Canada L8P 0A1 dold@envirosim.com
*Corresponding author
Abstract
High-rate wastewater processes are receiving a renewed interest to obtain energy
positive/efficient water resource recovery facilities. An innovative treatment train combining a high-rate moving bed biofilm reactor (HR-MBBR) with an enhanced flotation process was studied. The two objectives of this work were 1) to maximize the conversion of soluble organics to particulate matter in an HR-MBBR and 2) to maximize the particulate matter recovery from the HR-MBBR effluent by green chemicals to enhance biogas production by anaerobic digestion. To achieve these objectives, lab-scale MBBRs fed with synthetic soluble wastewater were operated at organic loading rates (OLRs) between 4 and 34 kg COD m-3 reactor d-1 corresponding to hydraulic retention times (HRTs) between 6 and 54 minutes.
Colloidal and soluble chemical oxygen demand (COD) removal efficiency in the HR-MBBR increased with HRT to reach a plateau of 85% at an HRT longer than 27 minutes. Carrier
3 clogging observed at an OLR higher than 16 kg COD m-3 d-1 (HRT 13 minutes) resulted in about 23% loss in colloidal and soluble COD removal efficiency. Thus, the recommended parameters were between 22 and 37 minutes and between 6 to 10 kg COD m-3 d-1 for the HRT and the OLR, respectively, to maximize the conversion of soluble organics to particulate matter. Total suspended solids (TSS) recovery of 58 to 85% and 90 to 97% were achieved by enhanced flotation using green and unbiodegradable chemicals, respectively, corresponding to a TSS
effluent concentration below 14 and 7 mg TSS/L. Among the synthetic polymers tested, a high molecular weight and low charge density cationic polyacrylamide was found to give the best results with less than 2 mg TSS/L in the clarified effluent (97% TSS recovery). Green chemicals, although performing slightly less for solids separation than unbiodegradable chemicals, achieved a mean TSS concentration of 10 ± 3 mg/L in the clarified effluent.
Keywords
Moving bed biofilm reactor; innovative separation process; enhanced flotation; green coagulant; green polymer; high-rate process
Abbreviations
AD: anaerobic digestion AS: activated sludge
BOD: biochemical oxygen demand
C: clarified effluent after separation process CAS: conventional AS
CB: colloidal biodegradable COD CCOD: colloidal COD
COD: chemical oxygen demand CSCOD: colloidal and soluble COD DAF: dissolved air flotation
E: MBBR effluent before separation process EF: enhanced flotation
fCOD: filtered COD
fCV: particulate COD to VSS fraction ffCOD: flocculated-filtered COD fVT: VSS to TSS fraction HR-MBBR: high-rate MBBR HRT: hydraulic retention time MBBR: moving bed biofilm reactor Me: metal
MW: molecular weight NH3: free ammonia NH4+: ammonium ion NO2: nitrite (HNO2 + NO2-)
4 NO3: nitrate (HNO3 + NO3-)
OLR: organic loading rate PAM: polyacrylamide
PSD: particle size distribution R: removal efficiency
SB: soluble biodegradable COD SCOD: soluble COD
SNH4: total ammonia (free ammonia plus ammonium) SNOx: oxidized nitrogen (nitrite plus nitrate)
SPO4: woluble phosphate SR: wpecific removal TKN: total Kjeldahl nitrogen TP: total phosphorus
TSS: total suspended solids VSS: volatile suspended solids
WRRF: water resource recovery facility WWTP: wastewater treatment plant XB: particulate biodegradable COD XCOD: particulate COD
XOHO: heterotrophic biomass XSTO: stored particulate matter
1 Introduction
Wastewater treatment plants (WWTPs) are now renamed water resource recovery facilities (WRRFs) to reflect the new processes requirements to recover not only water quality but also organic matter, nutrients, other compounds and energy. High-rate (HR) wastewater processes are receiving a renewed interest for their potential to obtain energy positive/efficient WRRFs. They are most often associated with the activated sludge (AS) process operated at a high food to microorganism ratio, a short hydraulic retention time (HRT) and a short aeration time (Tilley, 2011; Nogaj et al., 2015).
The advantages of the moving bed biofilm reactor (MBBR) over the conventional activated sludge process (CAS) are to reduce footprint and eliminate sludge recirculation (Ødegaard, 2000). A relatively high sludge age and consequently biomass specialization can be achieved in biofilm reactors even in the absence of sludge recirculation. The MBBR can be used as primary, secondary or tertiary treatment, under aerobic, anoxic and anaerobic conditions, depending on the treatment objectives (Ødegaard, 2000). The MBBR can easily be retrofitted in existing WRRFs due to its compactness when compared to conventional technologies (McQuarrie and Boltz, 2011).
5 Biomass grown in HR processes transforms the rapidly biodegradable chemical oxygen demand (COD) that is soluble (SB) and colloidal (CB) into stored particulate matter (XSTO) and
heterotrophic biomass (XOHO), leaving the particulate fraction (XB) practically unchanged.
XB + CB + SB + SO2 → XSTO + XOHO + XB (1) The MBBR HRT typically ranges from 30 to 90 minutes and is kept low partly to prevent XB hydrolysis, which would complicate its downstream recovery. Hence, under low HRT and high-rate conditions, the influent particulate fraction of COD (XB) can be neglected for design purposes (Ødegaard, 1999; Ødegaard et al., 2000). The capture of the rapidly biodegradable
COD combined with the minimization of XB hydrolysis and its capture allows to maximize biogas production by anaerobic digestion (AD).
Biomass grown under high-rate conditions is known for its poor settleability due the generation of un-flocculated biomass and pin flocs, which is often reported for MBBR effluent solids using the method of wide volume particle size distributions (PSDs) (Ødegaard et al., 2000, 2010; Melin et al., 2005; Åhl et al., 2006; McQuarrie and Boltz, 2011; Karizmeh, 2012). Thus, when the
MBBR is in a secondary treatment configuration, an efficient downstream solids separation process combined with appropriate coagulating agents is required to recover the effluent solids (Ødegaard et al., 2010; Ivanovic and Leiknes, 2012). Dissolved air flotation (DAF) and
conventional settling are among the most frequently used separation processes for MBBR effluents. They are often combined with metallic based coagulants (Ødegaard, 2000; Ødegaard
et al., 2010; Ivanovic and Leiknes, 2012).
Innovative separation processes are needed to reduce energy costs, footprint, unbiodegradable chemicals addition and to promote the use of natural-based or green chemicals, such as tannins
and starches. In this perspective, there is an increasing interest in organic green chemicals and
previous experiments have revealed their high performance in municipal and industrial
wastewater treatment along with their biodegradability potential (Özacar and Şengil, 2003; Omar
et al., 2008; Beltrán-Heredia and Sánchez-Martín, 2009; Beltrán-Heredia et al., 2010;
Sánchez-Martı́n et al., 2010a; Beltrán-Heredia et al., 2011; Fatehah et al., 2013, Lapointe and Barbeau, 2015). More specifically, the potential of capturing the COD in the effluent of a high-rate MBBR (HR-MBBR) with a green coagulant was demonstrated (Schubert et al., 2013).
The enhanced flotation process is an alternative to the conventional DAF process. This process uses low-density beads instead of air as flotation medium and works without the energy
consuming air pressurization system of a conventional DAF. The beads may be recovered from sludge by hydrocyclones, centrifuges or vibratory screens and recycled for multiple utilisations (Eades and Penno, 2005; Jarvis et al., 2009). The high natural organic matter and total
suspended solids (TSS) recovery efficiency of a similar enhanced flotation process treating water from a drinking water treatment plant and sewer overflows was demonstrated by Jarvis et al. (2011) and Stanley and Evans (1977). The efficiency of enhanced flotation for the recovery of
6 The aim of this paper was to determine the efficiency of an innovative secondary treatment process train for achieving high-energy efficiency and low carbon footprint. This process train can be used for designing or retrofitting existing WRRFs. An MBBR operated at high-rate conditions for the biotransformation of colloidal and soluble chemical oxygen demand (CSCOD) into particulate organics is followed by a chemically enhanced solids separation process for maximum recovery of biodegradable organics that can then be converted into biogas by anaerobic digestion.
The two specific objectives of this project were to:
1. determine the optimal MBBR HRT and organic loading rate (OLR) to maximize CSCOD biotransformation, and
2. determine the efficiency of the innovative enhanced flotation process combined with green
chemicals to achieve a strict target TSS concentration of 10 mg/L or less.
2 Methods
2.1 Synthetic feed
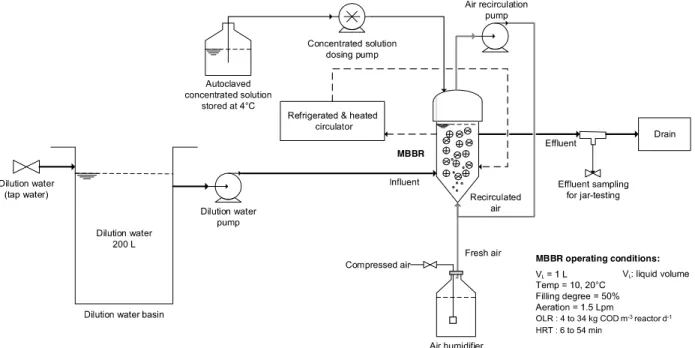
Two 1 L lab-scale MBBRs operated in parallel were fed with a synthetic soluble influent. This was done to ensure constant influent characteristics to understand and describe the underlying phenomena of biotransformation and capture of organic matter throughout the treatment train (Figure 1). A concentrated feed of 10 g COD/L was prepared every four days, autoclaved
(121°C, 2 bar for 15 minutes) and kept at 4°C. The concentrated solution was based on a recipe adapted from OECD (1976) to obtain a typical C/N/P ratio of 100/12/2 for a medium to high strength domestic wastewater (Metcalf and Eddy AECOM, 2014) (Table 1). The synthetic influent provided C, N, P and minerals to favor biofilm growth.
The solution was pumped and diluted with tap water before entering the reactors to obtain a COD concentration of about 160 mg/L and an alkalinity of 150 mg/L as CaCO3, to be
representative of the soluble fraction (without TSS) of a medium strength wastewater (Metcalf and Eddy AECOM, 2014). Tap water was used as dilution water to provide additional minerals (Mg, Ca, etc.) and alkalinity to the influent. The characteristics of the synthetic influent, after dilution of the concentrated solution, are presented in Table 2.
7 Figure 1. Schematic of the experimental setup.
Table 1. Concentrated feed composition and COD concentration used for the synthetic influent
Compounds Chemical formula
COD concentration
(g/L) Sodium acetate
trihydrate CH3COONa.3H2O 3.7
Sodium propionate CH3CH2COONa 1.6
Soy peptone - 5.7
Nutrient broth - 1.2
Dipotassium phosphate K2HPO4 1.1
Ammonium chloride NH4Cl 2.1
8 Table 2. Average characteristics of the lab-scale MBBR synthetic influent after dilution with tap water
Parameters Symbol Units Value
Total COD COD mg/L 168 ± 17
Particulate COD XCOD mg/L 1 ± 6
Colloidal COD CCOD mg/L 29 ± 3
Soluble COD SCOD mg/L 138 ± 8
Total 5-d carbonaceous BOD BOD mg/L 95 ± 5
Biodegradability COD/BOD ratio fCOD_BOD - 2.1 ± n.a.*
Total Kjeldahl nitrogen TKN mg N/L 19 ± 1
Total ammonia (NH3 + NH4+) SNH4 mg N/L 9.9 ± 0.6 Oxidized nitrogen
(nitrite plus nitrate) SNOx mg N/L 0.08 ± 0.06
SNH4/TKN ratio fSNH4_TKN - 0.53 ± 0.04
Total phosphorus TP mg P/L 3.9 ± 0.2
Soluble phosphate SPO4 mg P/L 2.2 ± 0.6
SPO4/TP ratio fSPO4_TP - 0.6 ± 0.2
*n.a.: not available 2.2 Lab-scale MBBRs
The biofilm carriers were AnoxKaldnes™ K5 (Veolia Water Technologies Canada) at a filling degree of 50% and were kept in suspension by aeration. The aeration flow rate was maintained at 1.5 Lpm. To minimize evaporation, the aeration consisted of 0.5 Lpm of fresh pre-humidified air and of 1.0 Lpm of recycled air from the airtight headspace. The temperature was controlled in the double-jacketed MBBRs by a refrigerated and heated circulator (Programmable Circulator 9712, PolyScience, USA).
The MBBRs were inoculated with previously colonized K3 carriers sampled from the full-scale MBBR of Terrebonne/Mascouche WRRF to favor biofilm growth and the development of a microbial ecosystem resembling that of a WRRF. The full-scale MBBR is located downstream of the first aerated lagoon and is followed by three lagoons for sludge storage and phosphorus removal (with a coagulant added just prior to the last lagoon). The K3 carriers were added to the lab-scale MBBRs containing the un-colonized K5 carriers during five days and were removed prior to the experiments.
2.3 Operating conditions
Seven operating conditions were tested under pseudo steady state conditions with MBBR volumetric OLR and HRT varying concomitantly from 4 to 34 kg COD m-3 reactor d-1 and from 6
9 to 54 minutes (Table 3). The MBBR stability was determined by the treatment efficiency and effluent characteristics. Data was rejected when clogging of the carriers was observed. Each operating condition was conducted during 3 to 5 weeks including a growth and stabilisation period of 1 to 2 weeks followed by a characterization period of 2 to 3 weeks. The MBBR liquid volume was corrected to account for the volume taken by the carriers and air bubbles.
Experiments were conducted at 20°C except for two additional experiments at 10°C to evaluate the effect of temperature (Table 3).
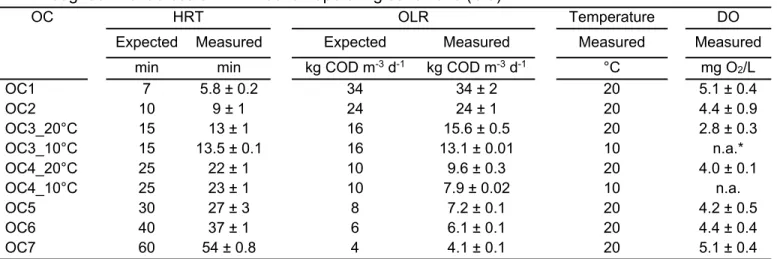
Table 3. Expected and measured HRT, OLR, temperature and dissolved oxygen (DO) throughout the lab-scale MBBR seven operating conditions (OC)
OC HRT OLR Temperature DO
Expected Measured Expected Measured Measured Measured
min min kg COD m-3 d-1 kg COD m-3 d-1 °C mg O2/L
OC1 7 5.8 ± 0.2 34 34 ± 2 20 5.1 ± 0.4 OC2 10 9 ± 1 24 24 ± 1 20 4.4 ± 0.9 OC3_20°C 15 13 ± 1 16 15.6 ± 0.5 20 2.8 ± 0.3 OC3_10°C 15 13.5 ± 0.1 16 13.1 ± 0.01 10 n.a.* OC4_20°C 25 22 ± 1 10 9.6 ± 0.3 20 4.0 ± 0.1 OC4_10°C 25 23 ± 1 10 7.9 ± 0.02 10 n.a. OC5 30 27 ± 3 8 7.2 ± 0.1 20 4.2 ± 0.5 OC6 40 37 ± 1 6 6.1 ± 0.1 20 4.4 ± 0.4 OC7 60 54 ± 0.8 4 4.1 ± 0.1 20 5.1 ± 0.4
*n.a.: not available
CSCOD removal efficiency ( ) was evaluated by comparing CSCOD content (in mg/L) in the MBBR influent and effluent:
% 100% (2)
which can be expressed per unit reactor volume as the volumetric CSCOD specific removal
( ).
The observed yield ( , in g TSS produced/g CSCOD removed) and the XCOD yield
( , in g XCOD produced/g CSCOD removed) were determined using the following equations:
, (3)
10 The theoretical yield for heterotrophic biomass was assumed to be of 0.66 g XCOD produced/g COD consumed (Ekama and Marais, 1984) corresponding to:
0.66 . 0.46 (5)
and, assuming 10% of inorganic matter (fVT = 0.90 g VSS/g TSS):
0.46 . 0.52 (6)
2.4 Jar-testing
2.4.1 Operating conditions
Jar-tests were conducted using a six-paddle stirrer in 2 L beakers B-KER2 (Phipps & Bird, USA) with a valve at 1/3 of their height (42 mm above bottom level and 105 mm below water level) for clarified water sampling. All jar-tests were conducted at room temperature, corresponding to 22 ± 1C.
2.4.2 Lab-scale MBBR effluent samples
Lab-scale MBBR effluent samples were collected over a 2 to 10 hour period depending on the required effluent volume for the jar-test experiments, which varied from 2 to 28 L, and were stored at 4°C if not used immediately for analysis.
First, the TSS recovery efficiency of unbiodegradable chemicals, alum as coagulant and charged/uncharged synthetic polymers, was compared to that of green chemicals. Second, the
influence of the MBBR HRT, and resulting OLR, on the TSS recovery efficiency by green
chemicals was studied. The MBBRs were operated as continuous flow systems and were used to feed the jar-test experiments which were conducted in batches.
Regarding the unbiodegradable chemicals, the efficiency of high molecular weight (MW) cationic or anionic polyacrylamide (PAM) polymers was compared during the enhanced flotation process. Lab-scale enhanced flotation and conventional settling process efficiencies were compared at given chemical dosages using adapted jar-test procedures.
Regarding the green chemicals, a tannin coagulant, Hydrex 3818, and a potato starch polymer, Hydrex 3842, were used. The effect of MBBR HRT and OLR on enhanced flotation efficiency was evaluated using the green chemicals at given dosages. The chemicals tested with their
11 Table 4. Jar-test operating conditions: type and dosage of chemicals used to assess TSS
recovery efficiency of conventional settling and enhanced flotation
Chemical Name Description Dosage range
Unbiodegradable coagulant ALS Aluminum sulphate (alum) 0.0 - 0.2 mmol Me*/L
Green coagulant Hydrex 3818 Tannin-based 0 - 33 mg/L
Synthetic polymer A-100 HMW
A-110 A-130 C-492 N-300 Hydrex 3551 Charged/Uncharged 0 - 1 mg/L
Green polymer Hydrex 3842 Potato starch-based 0 - 20 mg/L *Me: Metal
2.4.3 Jar-test procedures
The enhanced flotation jar-test procedure included three periods:
- period 1. addition of coagulant and mixing at 150 rpm (G of 170 s-1; adapted from graphic of Cornwell and Bishop, 1983) during 2 minutes - coagulation period,
- period 2. addition of polymer and beads and mixing at 300 rpm (390 s-1) during 2 minutes - flocculation & beads-solids adhesion period, and
- period 3. mixing stopped during 2 minutes - quiescent flotation period.
Mixing energy had to be increased during the flocculation & beads-solids adhesion period to allow the low-density medium to be thoroughly homogenized in the sample. The enhanced flotation medium consisted of low density (d = 24 kg/m3; median diameter = 40 µm) expanded thermoplastic microspheres and was dosed at 9 mg/L.
The conventional settling jar-test procedure included three periods:
- period 1. addition of coagulant and mixing at 160 rpm (180 s-1) during 2 minutes - coagulation period,
- period 2. addition of polymer and mixing at 45 rpm (35 s-1) during 15 minutes - flocculation period, and
- period 3. mixing stopped during 15 minutes - quiescent settling period. 2.5 Analytical methods
The characterization of the MBBR influent and effluent was done 2 to 5 times per week. Chemical oxygen demand (COD), total suspended solids (TSS) and volatile suspended solids (VSS) were measured according to APHA et al. (2012). Glass microfiber 1.2 µm filters
(Whatman® 934-AH™, GE Healthcare Life Sciences, GBR) and 0.45 µm cellulose membrane filters (MF-Millipore™, EMD Millipore, USA) were used for TSS and COD, respectively.
12 Flocculated-filtered COD (ffCOD) was measured according to Mamais et al. (1993). All nitrogen and phosphorus species were measured according to APHA et al. (2012) using a flow injection analysis instrument (Quickchem® 8500, Lachat Instruments, USA). Alkalinity (SAlk) was
measured with an automated titrator (DL28 Titrator, Mettler Toledo, USA). Dissolved oxygen (DO) concentration was measured with a portable DO-meter (HQ40d, Hach Company, USA) and a LDO® probe (Hach Company, USA).
The following definitions were used for COD size fractionation:
soluble COD: SCOD (or flocculated-filtered COD, ffCOD): < 0.04 µm colloidal COD: CCOD: 0.04 to 0.45 µm, and
particulate COD: XCOD: > 0.45 µm.
Particle size distribution was measured using a Mastersizer 3000 (Malvern Instruments Ltd., U.K.). Particles were considered non spherical and their distribution was expressed in volume equivalent. Visual observations were made using an Axioskop 40 (Carl Zeiss, DEU) microscope and a binocular (Portable Luminaire model 52343, Underwriters Laboratories, USA).
2.6 Statistical analysis
Student’s t-test analyses were conducted on the MBBR efficiency and sludge production sets of data. T-TEST function in EXCEL was used with bilateral and heteroscedastic distributions and the least significant difference was set at p < 0.05.
3 Results and discussion 3.1 MBBR results
3.1.1 Biotransformation of CSCOD into XCOD
The determination of the MBBR optimal operating condition(s) for maximizing the production of biodegradable sludge was based on three criteria:
- maximization of the specific removal efficiency of CSCOD, - maximization of the observed yield and
- non-clogging of the carriers.
A summary of the lab-scale MBBRs performance and effluent characteristics for the seven operating conditions is presented in Table 5. Effluent nitrate concentration remained around 0.1 mg N/L thus showing no significant nitrification occurring in the MBBRs as expected at such high rate conditions (results not shown).
13 Table 5. Summary of the lab-scale MBBR effluent average characteristics and performance for the seven operating conditions (OC) at 20°C and 50% v/v K5 carriers
Parameters Symbol Units OC1 OC2 OC3 OC4 OC5 OC6 OC7
HRT - min 5.8 ± 0.2 9 ± 1 13 ± 1 22 ± 1 27 ± 3 37 ± 1 53.7 ± 0.8
OLR - kg COD m-3 d-1 34 ± 2 24 ± 1 15.6 ± 0.5 9.6 ± 0.3 7.2 ± 0.1 6.1 ± 0.1 4.1 ± 0.1
Flow - mL/min 151 ± 6 99 ± 9 66 ± 6 40 ± 2 32 ± 4 23 ± 1 16.2 ± 0.3
Total COD COD mg/L 129 ± 7 136 ± 15 119 ± 11 118 ± 10 113 ± 22 116 ± 12 83 ± 17
Particulate COD XCOD mg/L 31 ± 9 36 ± 5 43 ± 11 63 ± 12 86 ± 23 88 ± 7 62 ± 15
Colloidal COD CCOD mg/L 12 ± 1.3 10 ± n.a.* 12 ± 2 20 ± 3 n.a. 4 ± n.a. 6 ± 1.2
Soluble COD SCOD mg/L 84 ± 6 83 ± n.a. 67 ± 6 35 ± 5 n.a. 43 ± n.a. 13.8 ± 0.7
TSS XTSS mg/L 27 ± 4 29 ± 2 37 ± 5 47 ± 12 59 ± 13 61 ± 12 48 ± 13
VSS XVSS mg/L 23 ± 3 26 ± 3 34 ± 4 41 ± 11 59 ± 14 53 ± 11 40 ± 10
Alkalinity SAlk mg CaCO3/L n.a. n.a. 141 ± 9 141.9 ± 0.5 138 ± n.a. 151 ± 3 147 ± n.a.
pH - - n.a. n.a. 7.6 ± 0.3 7.8 ± 0.1 7.7 ± n.a. 7.7 ± 0.2 7.6 ± n.a.
Volume PSD median
Dv50 µm 376 ± 26 n.a. 182 ± 1 n.a. n.a. 117 ± 6 215 ± 3
HRT - min 5.8 ± 0.2 9 ± 1 13 ± 1 22 ± 1 27 ± 3 37 ± 1 53.7 ± 0.8
OLR - kg COD m-3 d-1 34 ± 2 24 ± 1 15.6 ± 0.5 9.6 ± 0.3 7.2 ± 0.1 6.1 ± 0.1 4.1 ± 0.1
TSS production - g/d 5.7 ± 0.8 4.1 ± 0.6 3.5 ± 0.3 2.6 ± 0.3 2.4 ± 0.6 2.1 ± 0.4 1.4 ± 0.2
VSS production - g/d 5.0 ± 0.5 3.7 ± 0.6 3.1 ± 0.3 2.2 ± 0.3 2.5 ± 0.4 1.8 ± 0.4 1.0 ± 0.2
XCOD/VSS ratio fCV = fXCOD_VSS g XCOD/g VSS 1.46 ± 0.16 1.39 ± 0.10 1.24 ± 0.16 1.43 ± 0.09 1.56 ± 0.09 1.60 ± 0.13 1.54 ± 0.17
VSS/TSS ratio fVT = fVSS_TSS g VSS/g TSS 0.87 ± 0.06 0.89 ± 0.03 0.89 ± 0.05 0.86 ± 0.03 0.91 ± 0.03 0.88 ± 0.05 0.81 ± 0.18 CSCOD removal efficiency RCSCOD % 43 ± 1 45 ± 2 56 ± 3 66 ± 3 83 ± 2 87 ± 2 88 ± 2 CSCOD specific removal rate SRCSCOD kg CSCOD m-3 d-1 15.0 ± 0.4 11 ± 1 8.9 ± 0.3 6.3 ± 0.3 6.0 ± 0.1 5.2 ± 0.2 3.6 ± 0.1 TSS observed yield Yobs,TSS g TSS/ g CSCOD,removed 0.42 ± 0.07 0.42 ± 0.04 0.42 ± 0.02 0.41 ± 0.04 0.40 ± 0.05 0.39 ± 0.04 0.31 ± 0.07 VSS observed yield Yobs,VSS g VSS/ g CSCOD,removed 0.37 ± 0.06 0.38 ± 0.05 0.37 ± 0.03 0.35 ± 0.04 0.39 ± 0.04 0.34 ± 0.02 0.28 ± 0.06 XCOD observed yield Yobs,XCOD g XCOD/ g CSCOD,removed 0.48 ± 0.05 0.49 ± 0.05 0.50 ± 0.05 0.54 ± 0.07 0.58 ± 0.08 0.54 ± 0.02 0.42 ± 0.08 *n.a.: not available
14
CSCOD removal efficiency and specific removal rate are shown in Figure 2. CSCOD removal efficiency increased with HRT (or inversely for OLR) as expected. For an HRT longer than 27 minutes (below an OLR of 7 kg COD m-3 d-1), the efficiency reached a plateau at 85% (Figure 2A & B). A similar tendency between OLR and total COD removal efficiency was obtained by Aygun
et al. (2008) although their efficiencies were systematically higher due to higher available
surface area for biofilm growth, influent total COD concentration and HRT in their experiments. Moreover, their COD removal efficiencies were calculated by measuring the difference in COD concentration in MBBR influent and in settler clarified effluent, located downstream of the MBBR (Aygun et al., 2008).
Figure 2. Lab-scale MBBR CSCOD removal efficiency (A, B) and specific removal rate (C, D) as a function of HRT (A, C) and OLR (B, D) at 20°C and 50% v/v K5 carriers. The errors bars indicate the standard deviation and are not shown if smaller than symbol size.
A maximum specific removal rate of 15 kg CSCOD,removed m-3 d-1 was reached at the highest OLR applied of 34 kg COD m-3 d-1 (Figure 2D). The linear increase of specific removal rate with OLR was also observed by previous lab- and pilot-scale experiments with HR-MBBRs (Ødegaard et al., 2000; Helness et al., 2005). The slope of 0.35 obtained indicated that around 65%
(difference between an ideal slope of 100%) of the colloidal and soluble COD in the influent was not consumed even at the highest HRT tested (54 minutes) (Ødegaard et al., 2000). An
asymptotic relationship between the mass of attached biomass as dry solids and OLR was observed by Orantes and González-Martı́nez (2003). At OLRs over 4.8 kg COD m-3 d-1, they observedno supplementary biomass attached. Hence, at high loading rates the COD
biodegradation does not depend on OLR, but is limited by the short HRT used (Ødegaard et al., 2000; Orantes and González-Martı́nez, 2003; Helness et al., 2005).
SRCSCOD = 0.35*OLR + 2.9 R² = 0.98 0 5 10 15 20 0 10 20 30 40 OLRCOD (kg COD m-3 d-1) 0 5 10 15 20 0 10 20 30 40 50 60 S p ec if ic r em o va l o f CS CO D (kg C SCO D, re mo v ed m -3d -1) HRT (min) 100% D C 0 20 40 60 80 100 0 10 20 30 40 0 20 40 60 80 100 0 10 20 30 40 50 60 CS CO D r em ov al eff ic ie nc y (%) A B
15 The observed yields (Yobs)expressed as the production of TSS and of XCOD over the substrate consumption are shown in Figure 3 for the seven operating conditions along with the theoretical yield values. Yobs,TSS increased with OLR and inversely with HRT to reach a constant value of 0.42 g TSS/g CSCOD,removed (or 0.37 g VSS/g CSCOD,removed; Table 5) from 16 to 34 kg COD m-3 d-1. A maximum Yobs,XCOD of 0.58 g XCOD/g CSCOD,removed was determined at an HRT of 27 minutes and an OLR of 7 kg COD m-3 d-1 close to the theoretical value of 0.66 g X
COD/g CODremoved (Figure 3C & D).
Figure 3. Lab-scale MBBR observed yields expressed in TSS (A, B) and in XCOD production (C, D) as a function of HRT (A, C) and OLR (B, D) at 20°C and 50% v/v K5 carriers. The theoretical yields (Y) are shown at the top of each panel. The errors bars indicate the standard deviation and are not shown if smaller than symbol size. Student’s t-test parameters: bilateral distribution; heteroscedastic t-test; least significant difference: p < 0.05; significantly different results are identified with different letters on each panel.
Based on these results, the calculated Yobs are consistent with other experiments as Orantes and González-Martı́nez (2003) found a maximum Yobs of 0.40 g TSS/g CODremoved at 2.8 kg COD m-3 d-1. By calculating the ratio of the mass of TSS contained in the extracted sludge from a settler located after an MBBR to the COD removal between MBBR influent and settler clarified effluent, Aygun et al. (2008) obtained sludge productions ranging from 0.12 to 0.56 g TSS/g
CODremoved for an OLR from 1.5 to 24 kg COD m-3 d-1. At similar OLR, sludge productions
reported by Aygun et al. (2008) were in the same range than the Yobs presented in Figure 3B except for their highest OLR condition at 24 kg COD m-3 d-1 for which Aygun et al. (2008) found 0.56 g TSS/g CODremoved compared to this study at 0.42 g TSS/g CSCOD,removed.
0.0 0.1 0.2 0.3 0.4 0.5 0.6 0.7 0 10 20 30 40 OLRCOD (kg COD m-3 d-1) 0.0 0.1 0.2 0.3 0.4 0.5 0.6 0.7 0 10 20 30 40 50 60 Yob s ,X C OD (g X COD / g CS CO D ,remove d ) HRT (min)
Theoretical Y: 0.66 g XCOD/g COD Theoretical Y: 0.66 g XCOD/g COD
C D 0.0 0.1 0.2 0.3 0.4 0.5 0.6 0.7 0 10 20 30 40 0.0 0.1 0.2 0.3 0.4 0.5 0.6 0.7 0 10 20 30 40 50 60 Yobs,T SS (g T SS / g C SCO D ,remo ved )
Theoretical Y: 0.52 g TSS/g COD Theoretical Y: 0.52 g TSS/g COD B A a a a a a a b b b b b b b a a b a b b c b c c c a a b b b c bc a a c
16 3.1.2 MBBR effluent
The VSS to TSS ratio (fVT) in the effluent was between 0.81 to 0.91 g VSS/g TSS for all
operating conditions, indicating the predominant volatile fraction due to detached biofilm (Table 5). The particulate COD to VSS ratio (fCV) in the effluent varied between 1.24 to 1.60 g XCOD/g VSS. The effluent alkalinity and pH varied between 138 and 151 mg CaCO3/L and between 7.6 and 7.8, respectively.
The DO concentration in the bioreactors was at its lowest for an HRT of 13 minutes and an OLR of 16 kg COD m-3 d-1 and may have indicated a maximum biofilm activity at this operating
condition as the DO concentration is related to the biofilm growth and activity (Schubert et al.,
2013) (Table 3). However, this is incoherent with the Yobs results as a maximum Yobs was found for another operating condition at an HRT of 27 minutes and an OLR of 7 kgCOD m-3 d-1 (Figure 3C & D).
It was found that stability was easier to reach for operating conditions with high HRT and low OLR (> 13 minutes and < 16 kg COD m-3 d-1). At high OLR stability was hard to maintain and was associated with clogging issues.
3.1.3 MBBR effluent solids
MBBR effluent PSD as a function of HRT is presented in Figure 4A. Results showed bimodal volume PSD from around 5 to 1000 µm with a higher fraction of larger particles. In comparison, the PSD of AS measured by a similar laser diffraction particle size analyzer (MastersizerS, Malvern Instruments Ltd., GBR) revealed a wide and bimodal distribution ranging from around 0.2 to 200 µm (Govoreanu et al., 2004). No clear shift in distribution was observed in PSD with varying HRT (and thus with varying OLR) as confirmed by the volume particle size median Dv50
(Figure 4B & Table 5).
Previous experiments have shown that particles agglomeration is occurring by increasing HRT between 0.75 to 4 hours (Melin et al., 2005; Åhl et al., 2006; Ødegaard et al., 2010; Karizmeh, 2012). It was later demonstrated that a shift towards smaller particles could occur by
independently decreasing HRT and OLR (Karizmeh et al. 2014). In the present experiment, HRT
was kept low and a contact time lower than 37 minutes did not seem to be enough to allow agglomeration. The shift towards larger particles seemed to begin between 37 and 54 minute HRT. However, agglomeration cannot be confirmed in the absence of intermediate operating conditions.
17 Figure 4. Lab-scale MBBR effluent A) volume differential PSD and B) volume PSD median Dv50 at 20°C and 50% v/v K5 carriers. The errors bars in B) indicate the standard deviation and are not shown if smaller than symbol size.
Stability was difficult to reach for an HRT < 13 minutes (OLR > 16 kg CODm-3 d-1) and these operating conditions were associated with carrier clogging problems. It is plausible that effluent PSD would have been difficult to analyze accurately at these unstable operating conditions. For further PSD analyses it is suggested to first separate components smaller and greater than 1.2 µm to properly study their behaviour. It is also recommended to analyze MBBR effluent PSD for a wider range of HRTs, i.e. between 6 minutes and 4 hours to possibly find the minimum contact time for agglomeration and to compare with previous experiments.
The predominant COD fractions in the MBBR effluent were particulate (> 0.45 µm) and soluble (< 0.04 µm) COD, whereas the colloidal COD fraction (0.04-0.45 µm) was relatively small (Figure 5). This is in accordance with the PSD results showing that 99.9% of the particle volume distribution was above 5 µm. The removal efficiency of total COD, CCOD and SCOD varied
respectively from 19 to 51%, 32 to 86% and 39 to 90%.
The solids settleability using static settling (no chemicals added during jar-tests) was greatly fluctuating and ranged from 35 to 78% (treated effluent TSS concentration from 10 to 23 mg/L) at 37 minute HRT (results not shown). Thus, chemicals addition for coagulation and flocculation appeared necessary to ensure sufficient TSS recovery and reduce the impact of HR-MBBR effluent poor settleability (Ødegaard et al., 2000).
0 2 4 6 8 10 12 14 16 18 1 10 100 1000 Differen tial vo lu me (% ) Size classes (µm) HRT = 6 min HRT = 13 min HRT = 37 min HRT = 54 min A 0 100 200 300 400 500 0 10 20 30 40 50 60 Dv 50 (µ m) HRT (min) B
18 Figure 5. Lab-scale MBBR influent and effluent mean COD fractionation as a function of HRT at 20°C and 50% v/v K5 carriers.
3.1.4 Carrier clogging
High OLR and low HRT conditions (> 16 kg COD m-3 d-1 and < 13 minutes) were associated with carrier clogging issues. Clogging caused a significant decrease in CSCOD removal efficiency of 23% (Table 6). This result is in agreement with the effect of biofilm thickness on substrate diffusion: thinner biofilms facilitate the diffusion of substrate (Ødegaard, 2006). Carrier clogging did not significantly affect the observed yields.
Microscopic observations of the biofilm accumulated on clogged carriers revealed the predominance of filamentous bacteria and rotifers. In addition, monitored parameters in the effluent showed high variations at that time, perhaps due to the instability of the reactors. Airflow rate was maintained constant throughout the different operating conditions and was possibly not sufficient to provide enough biofilm detachment at low HRT. For further lab-scale MBBR
experiments at high-rate conditions, it is suggested to control the biofilm thickness by increasing the shear force applied on the biofilm by increasing the airflow rate.
X X X X X X C C C C C S S S S S S S 0 20 40 60 80 100 120 140 160 180 Influent HRT HRT HRT HRT HRT HRT To tal C OD (mg/L) HRT (min) S C X COD COD COD Influent Effluent
6 min 9 min 13 min
22 min
37 min
54 min
19 Table 6. Effect of carrier clogging on the performance of the lab-scale MBBR at 20°C and 50% v/v K5 carriers using Student’s t-test
Parameters Symbol Units Unclogged Clogged p-value
Value n* Value n HRT - min 5.8 ± 0.2 9 6.6 ± 0.9 8 0.03 OLR - kg COD m-3 d-1 34 ± 2 9 30.6 ± 0.6 8 0.001 TSS production - g/d 5.7 ± 0.8 8 4.8 ± 1.1 7 0.10 VSS production - g/d 5.0 ± 0.5 8 4.3 ± 1.0 7 0.14 CSCOD removal efficiency RCSCOD % 43 ± 1 4 33 ± 5 7 0.002 CSCOD specific removal rate
SRCSCOD kg CSCOD m-3 d-1 15.0 ± 0.4 4 10 ± 2 7 6E-5
TSS observed yield Yobs,TSS g TSS/g CODCS,removed 0.42 ± 0.07 6 0.48 ± 0.08 7 0.13 VSS observed yield Yobs,VSS g VSS/g
CODCS,removed
0.37 ± 0.06 6 0.43 ± 0.06 7 0.11 XCOD observed yield Yobs,XCOD g XCOD/g
CODCS,removed
0.48 ± 0.05 4 0.59 ± 0.13 7 0.06
*n: number of values
Student’s t-test parameters: bilateral distribution, heteroscedastic t-test, least significant difference: p < 0.05. A bold p-value indicates a significant difference.
20 3.1.5 Temperature effect
Two operating conditions were repeated at 10 and 20°C to study the effect of temperature on the MBBR performance (Table 7).
The temperature coefficient Θ was evaluated by comparing the mean CSCOD specific removal rates at 10 and 20°C and using the van’t Hoff-Arrhenius law (Rusten et al., 1995):
(7)
in this case,
(8)
The temperature coefficients obtained, 1.08 and 1.04 are within the typical range for organic matter removal systems of 1.00 to 1.08 (1.04 for AS) (Metcalf and Eddy Inc., 1991; Kadlec and Reddy, 2001).
The temperature decrease of 10C was found to cause a significant reduction of 15 to 41% of
21
Table 7. Effect of lab-scale MBBR temperature on their performance at 50% v/v K5 carriers using Student’s t-test
Parameters Symbol Units Temperature p-value Temperature p-value
10°C 20°C 10°C 20°C
Value n* Value n Value n Value n
HRT min 13.5 ± 0.1 5 13.3 ± 1.2 9 0.62 23.4 ± 1.2 5 21.6 ± 1.0 7 0.03
OLR kg COD m-3 d-1 13.11 ± 0.01 5 15.6 ± 0.5 9 5E-7 7.85 ± 0.02 5 9.6 ± 0.3 7 1E-5
TSS production - g/d 3.2 ± 0.2 3 3.5 ± 0.3 9 0.09 2.3 ± 0.4 5 2.6 ± 0.3 6 0.24 VSS production - g/d 2.8 ± 0.2 3 3.1 ± 0.3 7 0.08 2.0 ± 0.4 5 2.2 ± 0.3 6 0.29 CSCOD removal efficiency
RCSCOD % 33 ± 2 5 56 ± 3 6 5E-8 56 ± 1 5 66 ± 3 7 2E-5
CSCOD specific
removal rate
SRCSCOD kg CSCOD m-3 d-1 4.3 ± 0.3 5 8.9 ± 0.3 6 1E-9 4.4 ± 0.1 5 6.3 ± 0.3 7 4E-7
TSS observed yield Yobs,TSS g TSS/ g CODCS,removed 0.70 ± 0.04 3 0.42 ± 0.02 7 0.005 0.49 ± 0.03 4 0.41 ± 0.04 6 0.01 VSS observed yield Yobs,VSS g VSS/ g CODCS,removed 0.61 ± 0.03 3 0.37 ± 0.03 5 0.0004 0.41 ± 0.02 4 0.35 ± 0.04 6 0.02 XCOD observed yield Yobs,XCOD g XCOD/ g CODCS,removed 0.80 ± 0.07 3 0.50 ± 0.05 7 0.01 0.53 ± 0.03 4 0.54 ± 0.07 6 0.82 Temperature coefficient of SRCSCOD ΘSRCSCOD - 1.08 - 1.04 - *n: number of values
Student’s t-test parameters: bilateral distribution, heteroscedastic t-test, least significant difference: p < 0.05. A bold p-value indicates a significant difference
22 3.2 Physico-chemical capture
3.2.1 Unbiodegradable chemicals
When treating the lab-scale MBBR effluent with enhanced flotation, dosages used for alum and PAM polymer were respectively 0.2 mmol Al/L and 1 mg polymer/L.
At 0.2 mmol Al/L and 1 mg polymer/L, the efficiency of several high MW anionic, non-ionic and cationic polymers were compared (Figure 6). All polymers allowed good TSS recoveries, ranging from 90 to 97%, with less than 7 mg TSS/L in the clarified effluent. When using a non-ionic polymer, TSS recovery efficiency was reduced by 7%. Charged polymers resulted in similar efficiencies, i.e. 96-97%. A cationic polymer gave a more constant clarified effluent quality: less than 17% variation in TSS final concentrations compared to 26 to 39% variations for other charged polymers.
Figure 6. Effect of synthetic polymers ionic strength on TSS recovery efficiency and
concentration after enhanced flotation. MBBR: 37 minute HRT, 20°C and 50% v/v K5 carriers. Mean TSS concentration in MBBR effluent: 64 ± 10 mg/L. The errors bars indicate the standard deviation.
These results are in agreement with the ones presented by Stanley and Evans (1977), when treating domestic wastewater with a similar batch flotation process using low-density beads, as they observed higher TSS recoveries for cationic than anionic polymers.
The high efficiency of cationic polymers to treat MBBR effluent with settling or DAF and to reduce coagulant dosage demand and consequently sludge production was demonstrated in previous experiments (Melin et al., 2002; Melin et al., 2004; Ødegaard et al., 2010). It was
recommended to use high cationic strength and low to medium MW PAM or polyDADMAC polymers in addition of a metal coagulant (Melin et al., 2002; Ødegaard et al., 2010). In one of these experiments, a multivariate analysis model was compared to experimental data to study
80 85 90 95 100 0 2 4 6 8 10 -40 -30 -20 -10 0 10 20 TS S re cov er y (% ) TSS a ft er flotation (m g /L) Ionic strength (%mol) TSS in clarified effluent TSS recovery efficiency Target: 10 mg TSS/L Anionic Cationic
23 the effect of chemical dosage, polymer charge density and MW on TSS recovery efficiency (Melin et al., 2002). It appeared that TSS recovery was mainly influenced by effluent characteristics and chemical dosage and less affected by the polymer nature in the work of Melin et al. (2002).
Using alum and a cationic polymer at 0.2 mmol Al/L and 1 mg polymer/L, conventional settling and enhanced flotation achieved similar efficiencies and effluent quality, 96% TSS recovery (3 mg TSS/L) and 97% (2 mg TSS/L), respectively. Alkalinity consumption was higher at a given alum dosage for enhanced flotation than settling (9% and a final alkalinity of 138 mg CaCO3/L versus 4% and a final alkalinity of 149 mg CaCO3/L).
3.2.2 Green chemicals
Dosages used for green coagulant, Hydrex 3818, and polymer, Hydrex 3842, were respectively 33 mg tannin/L and 20 mg Hydrex 3842/L. Alkalinity consumption was below 5% (final alkalinity above 129 mg CaCO3/L).
When green chemicals were added during the enhanced flotation process, flocs and bonds
between solids and beads appeared to be more fragile than with the unbiodegradable chemicals. Thus, the enhanced flotation jar-test procedure was modified to allow a complete dispersion of coagulant during the 2 minute coagulation period at 300 rpm and of beads and half of the polymer during 15 seconds before the flocculation period at 300 rpm. The mixing speed was lowered to 50 rpm during the 2 minute flocculation period to allow sufficient bonding. The remaining of the polymer was added at the beginning of the flocculation period at 50 rpm. The duration of the flotation period was set at 2 minutes, but it was found that 95% of the total TSS recovery efficiency was reached after only 30 seconds of flotation (results not shown).
The effect of HRT on enhanced flotation efficiency in terms of TSS concentration and COD fractionation is presented in Figures 7 & 8. The mean TSS concentrations measured in MBBR effluent throughout the seven operating conditions increased with HRT (Figure 7A & Table 5). The mean TSS concentrations measured in MBBR effluent on the days of enhanced flotation experiments are also shown in Figure 7.
24 Figure 7. Effect of MBBR HRT on TSS concentration A) in MBBR effluent and B) in clarified effluent after enhanced flotation with green chemicals. Mean TSS concentrations in MBBR effluent on enhanced flotation experiment days (EF days) are shown in A). MBBR: 20°C and 50% v/v K5 carriers. The errors bars in A) indicate the standard deviation and are not shown if smaller than symbol size.
Throughout the seven operating conditions, green chemicals achieved a mean TSS concentration of 10 ± 3 mg/L in the clarified effluent (Figure 7B). However, the target TSS concentration of 10 mg/L was met for half of the operating conditions. TSS recovery efficiency did not seem to be related to TSS concentration before flotation, as also observed by Melin et al.
(2004) for a DAF separation process. No tendency was observed between OLR (or, inversely, HRT) and TSS recovery efficiency. The negative effect of high OLR on MBBR effluent solids settleability is caused by an increase of small sized unsettleable particles with increasing OLR. The effect is reduced by chemicals addition, which facilitates the agglomeration of these particles during flocculation (Ødegaard et al., 2000).
The evolution of COD fractionation throughout the treatment train, beginning by MBBR influent and effluent, COD contribution of green chemicals and COD remaining in the clarified effluent is presented in Figure 8A. The enhanced flotation process mainly captured XCOD fraction (from 68 to 87%) and CCOD fraction (from 37 to 56%) when comparing the MBBR effluent after chemicals addition and the clarified effluent.
0 10 20 30 40 50 60 70 80 0 10 20 30 40 50 60 TS S be for e fl o ta ti o n (mg/ L) 0 20 40 60 80 100 0 5 10 15 20 0 10 20 30 40 50 60 T S S reco very (% ) TSS af ter fl o tat io n (m g/ L) HRT (min) TSS concentration TSS recovery efficiency TSS conc. on EF days Target: 10 mg TSS/L B A
25 Figure 8. Effect of enhanced flotation combined with green chemicals on A) MBBR effluent COD
fractionation and B) PSD (HRT = 6 minutes). MBBR: 20°C and 50% v/v K5 carriers. Legend: E: MBBR effluent before enhanced flotation; Chem: COD addition due to green
chemicals; C: clarified effluent.
The increase of CCOD fraction between MBBR effluent (before chemicals addition) and clarified effluent may be due to the chemicals added and remaining in the clarified effluent. However, in previous experiments using a similar tannin-based chemical, no or very few residual tannin concentrations were measured after treatment (Özacar and Şengil, 2003; Sánchez-Martı́n et al., 2010b). It is therefore recommended for further tests to measure the residual tannin and starch in the clarified effluent to verify if the increase in CCOD fraction can be attributed to the addition of these green chemicals. In accordance with the present experimentation, Melin et al. (2002) demonstrated that DAF combined with an iron coagulant and a polyDADMAC polymer can capture mainly particles larger than 11 µm and that COD fraction < 0.1 µm remains almost unaltered throughout the process and dominates in the clarified effluent.
Volume PSD of MBBR effluent at 6 minute HRT indicated a major decline in particles larger than 200 µm after enhanced flotation process (Figure 8B). However, the effect on smaller sized particles could not be determined with these PSD results as higher volume was associated to larger size particles.
A summary of the jar-test performance for the seven MBBR operating conditions is presented in Table 8.
26 Table 8. Summary of jar-test performance in terms of TSS concentration and TSS recovery efficiency after enhanced flotation with unbiodegradable or green chemicals. MBBR: 20°C and 50% v/v K5 carriers
Parameters Symbol Units OC1 OC2 OC3 OC4 OC5 OC6 OC7
HRT - min 5.8 ± 0.2 9 ± 1 13 ± 1 22 ± 1 27 ± 3 37 ± 1 53.7 ± 0.8
OLR - kg COD m-3 d-1 34 ± 2 24 ± 1 15.6 ± 0.5 9.6 ± 0.3 7.2 ± 0.1 6.1 ± 0.1 4.1 ± 0.1
TSS effluent XTSS_E mg/L 27 ± 4 29 ± 2 37 ± 5 47 ± 12 59 ± 13 61 ± 12 48 ± 13
Unbiodegradable chemicals (alum + charged/uncharged PAM polymers)
TSS after flotation XTSS_C mg/L n.a.* n.a. n.a. n.a. n.a. 3 ± 2 n.a.
TSS recovery efficiency
RTSS % n.a. n.a. n.a. n.a. n.a. 95 ± 3 n.a.
Green chemicals (Hydrex 3818 + Hydrex 3842)
TSS after flotation XTSS_C mg/L 12 ± 3 8 ± n.a. 6 ± 2 13.7 ± 0.3 12 ± n.a. 9.73 ± 0.05 10.2 ± 0.5 TSS recovery
efficiency
RTSS % 58 ± 10 78 ± n.a. 85 ± 3 66 ± 5 73 ± n.a. 79 ± 1 75 ± 7
*n.a.: not available
27
4 Conclusions
The objectives of this experiment were 1) to optimize MBBR HRT and OLR to maximize biodegradable sludge production and 2) to determine the potential of an innovative enhanced flotation separation process combined with natural-based green chemicals. A target TSS
concentration of 10 mg/L was set in the separation process clarified effluent. An MBBR with a synthetic soluble feed was operated at seven operating conditions with OLR and HRT varied simultaneously from 4 to 34 kg COD m-3 reactor d-1 and from 6 to 54 minutes, respectively. The MBBR effluent was used afterwards for jar-test experiments and PSD analyses. The following conclusions were drawn:
CSCOD removal efficiency increased with HRT (and inversely with OLR) up to 27 minutes (OLR of 7 kg COD m-3 d-1), from which efficiency was maintained constant at 85%. Efficiency was significantly reduced by clogging issues occurring at high OLR and low HRT conditions (> 16 kg COD m-3 d-1 and < 13 minutes) and by a 10ºC temperature decrease;
An MBBR HRT of 22 to 37 minutes (OLR between 6 and 10 kg COD m-3 d-1) for a temperature of 20ºC was found best to maximize the biotransformation of CSCOD into XCOD without MBBR clogging;
Bimodal PSDs were observed in the MBBR effluent without evidence of agglomeration taking place for HRTs < 37 minutes;
The innovative enhanced flotation process combined with alum and charged or uncharged polymers allowed to reach a target TSS concentration of 10 mg/L in the MBBR clarified effluent. When green chemicals were used, bonds between solids and
beads appeared to be more fragile, although they could reach a mean TSS concentration of 10 ± 3 mg/L in the MBBR clarified effluent.
An MBBR followed by an enhanced flotation process is a promising treatment combination that can result in a compact and sustainable process train for wastewater treatment and resource recovery. Further work using real wastewater containing solids with industrial size pilot units would allow to better consider mass transfer and media clogging phenomena and obtain more accurate design criteria to evaluate the sludge production of green chemicals and energy
consumption of the proposed treatment train. Acknowledgements
The authors thank the Terrebonne/Mascouche WRRF staff for their assistance with sampling. The authors thank Veolia Water Technologies Canada Inc. and Kemira Water Solutions Canada Inc. for supplying chemicals, and the city of Repentigny and Denis Bouchard for technical support. The authors thank the Natural Sciences and Engineering Research Council of Canada (NSERC; Grant no. RDCP J 435326-12), the Fonds de recherche du Québec - Nature &
technologies (FRQ-NT), Veolia Water Technologies Canada Inc., the City of Repentigny and EnviroSim Associates Ltd. for their financial support.
28 References
Åhl, R.M., Leiknes, T. & Ødegaard, H., 2006. Tracking particle size distributions in a moving bed biofilm membrane reactor for treatment of municipal wastewater. Water Science and
Technology 53(7), 33-42.
APHA, AWWA & WEF, 2012. Standard Methods for the Examination of Water and Wastewater (22nd ed.). American Public Health Association, American Water Works Association & Water Environment Federation: Washington, D.C.
Aygun, A., Nas, B. & Berktay, A., 2008. Influence of high organic loading rates on COD removal and sludge production in moving bed biofilm reactor. Environmental Engineering Science 25(9), 1311-1316.
Beltrán-Heredia, J. & Sánchez-Martín, J., 2009. Municipal wastewater treatment by modified tannin flocculant agent. Desalination 249(1), 353-358.
Beltrán-Heredia, J., Sánchez-Martín, J. & Gómez-Muñoz, M.C., 2010. New coagulant agents from tannin extracts: Preliminary optimisation studies. Chemical Engineering Journal 162(3), 1019-1025.
Beltrán-Heredia, J., Sánchez-Martín, J. & Dávila-Acedo, M.A., 2011. Optimization of the synthesis of a new coagulant from a tannin extract. Journal of Hazardous Materials 186(2-3), 1704-1712.
Cornwell, D.A. & Bishop, M.M., 1983. Determining velocity gradients in laboratory and full-scale systems. Journal of the American Water Works Association 75(9), 470-475.
Eades, A. & Penno, J., 2005. Patent No: US 6,890,431 B1. Buoyant media flotation. Ekama, G.A. & Marais, G.v.R., 1984. Biological nitrogen removal. In: Theory, design and
operation of nutrient removal activated sludge processes. Water Research Commission: Pretoria, South Africa.
Fatehah, M.O., Sohrab H., & Teng, T.T., 2013. Comparative study on natural and commercial coagulants: Treatment of semiconductor wastewater in sludge production and removal of heavy metals. International Journal of Science and Modern Engineering 1(7), 1-8.
Govoreanu, R., Saveyn, H., Van der Meeren, P. & Vanrolleghem, P.A., 2004. Simultaneous determination of activated sludge floc size distribution by different techniques. Water Science and Technology 50(12), 39-46.
Helness, H., Melin, E., Ulgenes, Y., Järvinen, P., Rasmussen, V. & Ødegaard, H., 2005. High-rate wastewater treatment combining a moving bed biofilm reactor and enhanced particle separation. Water Science and Technology 52(10-11), 117-127.
Ivanovic, I. & Leiknes, T.O., 2012. Particle separation in moving bed biofilm reactor: Applications and opportunities. Separation Science and Technology 47(5), 647-653.
Jarvis, P., Buckingham, P., Holden, B. & Jefferson, B., 2009. Low energy ballasted flotation. Water Research 43(14), 3427-3434.
Jarvis, P., Martin, J., Winspear, T. & Jefferson, B., 2011. Ballasted flotation with glass
microspheres for removal of natural organic matter. Separation Science and Technology 46(16), 2489-2495.
29 Kadlec, R.H., & Reddy, K.R., 2001. Temperature effects in treatment wetlands. Water
Environment Research, 73(5), 543-557.
Karizmeh, M.S., 2012. Investigation of biologically-produced solids in moving bed bioreactor (MBBR) treatment systems. M.A.Sc. thesis, University of Ottawa, Canada.
Karizmeh, M.S., Delatolla, R. & Narbaitz, R.M., 2014. Investigation of settleability of biologically produced solids and biofilm morphology in moving bed bioreactors (MBBRs). Bioprocess and Biosystems Engineering 37(9), 1839-1848.
Lapointe, M. & Barbeau, B., 2015. Evaluation of activated starch as an alternative to
polyacrylamide polymers for drinking water flocculation. Journal of Water Supply: Research and Technology 64(3), 333-343.
Mamais, D., Jenkins, D. & Pitt, P., 1993. A rapid physical-chemical method for the determination of readily biodegradable soluble COD in municipal wastewater. Water Research 27(1), 195-197.
McQuarrie, J.P. & Boltz, J.P., 2011. Moving bed biofilm reactor technology: Process applications, design, and performance. Water Environment Research 83(6), 560-575. Melin, E., Helness, H. & Ødegaard, H., 2002. Dissolved air flotation of bioreactor effluent using
low dosages of polymer and iron. In: Hahn, H.H., Hoffmann, E. & Ødegaard, H. (eds.), Chemical water and wastewater treatment VII (pp. 261-272). IWA Publishing: London, U.K. Melin, E., Helness, H., Kenakkala, T. & Ødegaard, H., 2004. High-rate wastewater treatment
based on moving bed biofilm reactor, polymer coagulation and flotation. In: Hahn, H.H., Hoffmann, E. & Ødegaard, H. (eds.), Chemical water and wastewater treatment VIII (pp. 39-48). IWA Publishing: London, U.K.
Melin, E., Leiknes, T., Helness, H., Rasmussen, V. & Ødegaard, H., 2005. Effect of organic loading rate on a wastewater treatment process combining moving bed biofilm and membrane reactors. Water Science and Technology 51(6-7), 421-430.
Metcalf and Eddy Inc., 1991. Wastewater Engineering: Treatment, Disposal, and Reuse (4th ed). Tchobanoglous, G. & Burton F.L. (eds.). McGraw-Hill: New York.
Metcalf and Eddy AECOM, 2014. Wastewater Engineering: Treatment and Resource Recovery (5th ed.). McGraw-Hill: New York.
Nogaj, T., Randall, A., Jimenez, J., Takacs, I., Bott, C., Miller, M., Murthy, S. & Wett, B., 2015. Modeling of organic substrate transformation in the high-rate activated sludge process. Water Science and Technology 71(7), 971-979.
Ødegaard, H., 1999. The moving bed biofilm reactor. In: Igarashi, T., Watanabe, Y., Asano, T. & Tambo, N. (eds.), Water environmental engineering and reuse of water (pp. 250-305). Hokkaido Press (in Japanese).
Ødegaard, H., 2000. Advanced compact wastewater treatment based on coagulation and moving bed biofilm processes. Water Science and Technology 42(12), 33-48.
Ødegaard, H., Gisvold, B., Helness, H., Sjøvold, F. & Zuliang, L., 2000. High rate
biological/chemical treatment based on the moving bed biofilm process combined with coagulation. In: Hahn, H.H., Hoffmann, E. & Ødegaard, H. (eds.), Chemical water and wastewater treatment VI (pp. 245-255). Springer: Berlin, D.E.
Ødegaard, H., 2006. Innovations in wastewater treatment: the moving bed biofilm process. Water Science and Technology 53(9), 17-33.
30 Ødegaard, H., Cimbritz, M., Christensson, M. & Dahl, C.P., 2010. Separation of biomass from
moving bed biofilm reactors (MBBRs). WEF/IWA Biofilm reactor technology conference (pp. 212-233). Water Environment Federation: Portland, OR, U.S.
OECD, 1976. Proposed Method for the Determination of the Biodegradability of Surfactants used in Synthetic Detergents. Organisation for Economic Co-operation and Development: Paris, France.
Omar, F.M., Rahman, N.N.N.A. & Ahmad, A., 2008. COD reduction in semiconductor wastewater by natural and commercialized coagulants using response surface methodology. Water, Air and Soil Pollution 195(1-4), 345-352.
Orantes, J.C. & González-Martı́nez, S., 2003. A new low-cost biofilm carrier for the treatment of municipal wastewater in a moving bed reactor. Water Science and Technology 48(11-12), 243-250.
Özacar, M. & Şengil, İ.A., 2003. Evaluation of tannin biopolymer as a coagulant aid for coagulation of colloidal particles. Colloids and Surfaces A: Physicochemical and Engineering Aspects 229(1-3), 85-96.
Rusten, B., Hem, L.J. & Ødegaard, H., 1995. Nitrification of municipal wastewater in moving-bed biofilm reactors. Water Environment Research 67(1), 75-86.
Sánchez-Martı́n, J., Beltrán-Heredia, J. & Solera-Hernández, C., 2010a. Surface water and wastewater treatment using a new tannin-based coagulant. Pilot plant trials. Journal of Environmental Management 91(10), 2051-2058.
Sánchez-Martı́n, J., González-Velasco, M. & Beltrán-Heredia, J., 2010b. Surface water
treatment with tannin-based coagulants from Quebracho (Schinopsis balansae). Chemical
Engineering Journal 165(3), 851-858.
Schubert, R.L., Boulestreau, M., Christensson, M. & Lesjean, B., 2013. Novel wastewater process scheme for maximum COD extraction: High load MBBR followed by microsieve filtration. IWA 9th International conference on biofilm reactors. International Water Association: Paris, France.
Stanley, N.F. & Evans, P.R., 1977. Flocculation-Flotation Aids for Treatment of Combined Sewer Overflows. U.S. Environmental Protection Agency. EPA-600/2-77-140.
Tilley, D.F., 2011. Aerobic Wastewater Treatment Processes: History and Development. IWA Publishing: London, U.K.