Évaluation de la recharge des eaux souterraines à différentes échelles par une approche couplant des modèles hydrologique et hydrogéologique
Le cas du bassin versant non-jaugé de la rivière Caribou
Geneviève Labrecque
Mémoire présentée à l’Université du Québec à Chicoutimi comme exigence partielle de la maîtrise en sciences appliquées (M.Sc.)
Québec, Canada
RÉSUMÉ
L’eau souterraine est une ressource vers laquelle les gens se tournent de plus en plus pour différentes raisons, incluant sa facilité d’exploitation et sa qualité. Il est pourtant nécessaire de bien la quantifier en évaluant son taux de renouvellement pour en assurer une exploitation durable. L’objectif principal de cette étude est ainsi d’évaluer la recharge de l’aquifère de Saint-Honoré, localisé dans la région du Saguenay-Lac-Saint-Jean au Québec, Canada, par une approche cherchant à prendre en considération toutes les composantes du cycle de l’eau. Ainsi, deux méthodes ont été utilisées conjointement dans cette étude : (1) une analyse des fluctuations du niveau de la nappe et (2) une modélisation hydrologique du bassin versant.
L’analyse des fluctuations du niveau de la nappe est une méthode répandue, mais critiquée pour son échelle spatiale de validité (1-100 m2 selon Delin, Healy, Lorenz et Nimmo
(2007)) qui est plutôt restreinte, alors que certains cas d’étude nécessitent l’évaluation de la recharge à des échelles plus vastes. Une méthode optimisée, codée et automatisée de l’analyse des fluctuations du niveau de la nappe (OCA-WTF), prenant en compte un emmagasinement spécifique variable, a ainsi été développée dans le cadre de cette étude. Celle-ci a été appliquée aux données de six puits d’observation répartis sur l’aquifère de Saint-Honoré, résultant en une recharge moyenne de 350 mm/an. Cette méthode a été comparée à d’autres, soit des bilans hydriques, des séparations d’hydrogrammes, une analyse isotopique et une méthode analytique d’estimation basée sur les simplifications de Dupuit-Forchheimer. Ces comparaisons ont permis de constater que les résultats obtenus avec la méthode OCA-WTF sur le bassin versant de la rivière Caribou (120 km2) sont
représentatifs de l’aquifère et comparables à des méthodes d’estimation à plus grande échelle spatiale.
De plus, la comparaison avec l’analyse isotopique a mis en évidence le délai entre les périodes d’infiltration et de recharge qui peut parfois s’avérer très long (i.e. plus d’un an). Ce délai fait en sorte que mettre en relation des données de précipitation et de niveau de nappe phréatique ayant la même échelle temporelle dans les calculs de recharge n’est pas toujours approprié.
Le modèle physique distribué WaSiM (Schulla, 2015) a été retenu pour évaluer la recharge par la modélisation hydrologique du bassin versant de la rivière Caribou (120 km2)
sur lequel l’aquifère de Saint-Honoré est localisé. Cependant, étant donné que ce bassin versant n’est pas jaugé, il a fallu trouver une solution pour reconstituer les débits à l’exutoire avant de pouvoir mettre en place le modèle hydrologique. Une approche de transfert de débit a été retenue, nécessitant une étude de similarité du bassin versant à l’étude appuyée sur une base de données de 106 bassins versants Québécois. Celle-ci a permis d’identifier quatre bassins versants similaires pour lesquels les débits ont été transférés et ajustés à la rivière Caribou. La calibration du modèle WaSiM devra être complétée afin d’obtenir des résultats de recharge à comparer à ceux obtenus avec la méthode OCA-WTF.
TABLE DES MATIÈRES
RÉSUMÉ ... 2
TABLE DES MATIÈRES ... iii
LISTE DES TABLEAUX ... 5
LISTE DES FIGURES ... vi
REMERCIEMENTS ... 8
CHAPITRE 1 INTRODUCTION ... 1
1.1 MISE EN CONTEXTE ... 1
1.2 PRÉSENTATION DU TERRITOIRE D’ÉTUDE... 2
CHAPITRE 2 ARTICLE SCIENTIFIQUE AN IMPROVED AUTOMATED WATER TABLE FLUCTUATION METHOD FOR ASSESSING AQUIFER RECHARGE: APPLICATION TO CANADIAN AQUIFERS AND COMPARISON WITH OTHER METHODS ... 6
2.1 ABSTRACT ... 7
2.2 INTRODUCTION ... 8
2.3 METHODOLOGY ... 12
2.3.1 CODING FOR AUTOMATED CALCULATION ... 12
2.3.2 COMPARISON OF OCA-WTF AGAINST OTHER METHODS FOR THE ASSESSMENT OF GROUNDWATER RECHARGE ... 16
2.4 FRAMEWORK OF APPLICATION ... 19
2.4.1 CARIBOU RIVER CATCHMENT ... 19
2.4.2 LA MALBAIE RIVER CATCHMENT ... 22
2.5 RESULTS ... 24
2.5.1 RESULTS OBTAINED WITH THE OPTIMIZED CODIFIED AUTOMATED-WTF (OCA-WTF) METHOD IN THE CARIBOU RIVER CATCHMENT ... 24
2.5.2 COMPARISON BETWEEN RESULTS OBTAINED BY OCA-WTF AND OTHER METHODS ... 27
2.6 DISCUSSION ... 35
2.7 CONCLUSION ... 37
2.9 REFERENCES ... 39
CHAPITRE 3 MODÉLISATION HYDROLOGIQUE ... 44
3.1 REVUE DE LITTERATURE ... 44
3.2 MÉTHODOLOGIE ... 47
3.2.1 MODÉLISATION ... 47
3.2.2 TRANSFERT DE DÉBIT ... 48
3.2.3 CALIBRATION DU MODÈLE ... 52
3.2.4 DONNÉES DE DÉBIT ADDITIONNELLES ... 53
3.3 RÉSULTATS PRÉLIMINAIRES ... 55
3.4 TRAVAUX FUTURS ... 57
CONCLUSION ... 58
LISTE DES TABLEAUX
TABLEAU 1.1 - CARACTERISTIQUES CLIMATOLOGIQUES, PHYSIOGRAPHIQUES ET
HYDROGRAPHIQUES DU BASSIN VERSANT DE LA RIVIERE CARIBOU ... 5 TABLE 2.1 - SPECIFIC YIELD VALUES FOR DIFFERENT SOIL TYPES (ADAPTED FROM
JOHNSON, 1967) ... 15 TABLE 2.2 - GROUNDWATER RECHARGE VALUES OBTAINED USING THE PROPOSED
OPTIMIZED CODIFIED AUTOMATED WTF (OCA-WTF) METHOD FOR THE SIX
OBSERVATION WELLS LOCATED IN THE CARIBOU RIVER CATCHMENT ... 26 TABLE 2.3 - GROUNDWATER RECHARGE VALUES CALCULATED USING TWO DIFFERENT
METHODS AND THEIR INFILTRATION PERIODS ... 29 TABLE 2.4 - MEAN GROUNDWATER RECHARGE VALUES FOR LA MALBAIE ... 32 TABLE 2.5 - COMPARISON OF THE RESULTS OBTAINED USING ALL THE METHODS FOR
THE CARIBOU AND LA MALBAIE RIVER CATCHMENTS ... 35 TABLEAU 3.1 – DONNEES REQUISES POUR LA MODELISATION HYDROLOGIQUE AVEC
WASIM ... 47 TABLEAU 3.2 – METHODES DE CALCUL SELECTIONNEES DANS WASIM ... 48 TABLEAU 3.3 – DESCRIPTEURS ET PONDERATIONS POUR LE CALCUL DE L’INDICE DE
SIMILARITE ... 50 TABLEAU 3.4 – DEBITS JAUGES A L’EXUTOIRE DE LA RIVIERE CARIBOU ... 52 TABLEAU 3.5 – BASSINS VERSANTS SIMILAIRES ... 54
LISTE DES FIGURES
FIGURE 1.1 – OCCUPATION DU TERRITOIRE, BASSIN VERSANT DE LA RIVIERE CARIBOU .. 3 FIGURE 1.2 – DEPOTS DE SURFACE, BASSIN VERSANT DE LA RIVIERE CARIBOU ... 4 FIG. 2.1 - DIAGRAM OF THE GROUNDWATER RECHARGE CALCULATION METHODOLOGY
IMPLEMENTED IN THE PROPOSED AUTOMATED APPROACH ... 14 FIG. 2.2 - CARIBOU RIVER CATCHMENT SOIL TYPES, LOCATION OF THE SIX OBSERVATION
WELLS AND WATER TABLE ELEVATION CONTOURS ... 21 FIG. 2.3 - OBSERVATION WELLS, STRATIGRAPHY AND MEAN WATER TABLE LEVELS (NOT
TO SCALE) ON THE CARIBOU RIVER CATCHMENT ... 22 FIG. 2.4 - LA MALBAIE RIVER CATCHMENT, SOIL TYPES AND LOCATION OF THE
OBSERVATION WELL ... 23 FIG. 2.5 - LA MALBAIE OBSERVATION WELL STRATIGRAPHY AND MEAN WATER TABLE
LEVEL ... 24 FIG. 2.6 - OCA-WTF ANALYSIS FOR SIX OBSERVATION WELLS IN THE CARIBOU RIVER
CATCHMENT ... 25 FIG. 2.7 - CORRELATION BETWEEN THE VADOSE ZONE THICKNESS AND THE
CALCULATED VALUE OF RECHARGE ... 27 FIG. 2.8 - OCA-WTF ANALYSIS FOR LA-2 OBSERVATION WELL (21ST JUNE TO 16 OCTOBER
2016) ... 28 FIG. 2.9 - QUADRATIC REGRESSION OF THE SQUARED SATURATED SOIL HEIGHT AGAINST
THE DISTANCE FROM AQUIFER’S UPSTREAM IMPERMEABLE BOUNDARY ... 31 FIG. 2.10 - OCA-WTF ANALYSIS FOR LA MALBAIE OBSERVATION WELL AND ANNUAL
RECHARGE RESULTS ... 32 FIGURE 3.1 – BASSINS VERSANTS JAUGES, DONNEURS POTENTIELS POUR LE
TRANSFERT DE DEBIT ... 49 FIGURE 3.2 – DONNEES DE DEBIT ADDITIONNELLES ... 53
FIGURE 3.3 – BASSINS VERSANTS JAUGES RETENUS POUR LEUR SIMILARITE AVEC LE BASSIN VERSANT DE LA RIVIERE CARIBOU ... 55 FIGURE 3.4 – PROCEDURE POUR LES TRAVAUX FUTURS... 56
REMERCIEMENTS
D’abord et avant tout, je tiens à remercier mes directeurs de recherche, Marie-Amélie Boucher et Romain Chesnaux pour toute l’aide qu’ils m’ont apportée. Je vous suis également très reconnaissante de m’avoir donné des opportunités incroyables comme l’école d’été à Dresden sur la gestion de la recharge des aquifères et l’EGU 2017 à Vienne. Je ne vous dirai jamais assez merci pour votre patience qui a probablement été mise à rude épreuve dans la dernière année de ma maîtrise.
Le plus gros remerciement va à l’humain le plus important de ma vie, Simon. Merci pour toute l’énergie que tu as mis à m’encourager et me supporter vers la réussite de ce projet qui grugeait tellement de temps. Merci pour tous les moments où tu as enduré mes sautes d’humeur de démotivation et pour tous les chocolats chauds d’encouragement que tu m’as fait (ils sont si bons!), mais surtout, merci d’avoir gardé une attitude positive même si le reste de notre vie était un peu en suspens.
Je remercie bien évidemment ma famille pour les encouragements et le support que vous m’avez témoigné pendant toute la réalisation de ce projet, tout particulièrement ma sœur Éloïse qui a commencé sa maîtrise un peu après la mienne. Les longues discussions téléphoniques sur l’avancement de nos projets respectifs remettaient les choses en perspective et me faisaient réaliser que je n’étais pas toute seule dans le bateau. Je pense aussi que vouloir terminer avant toi m’aura donné l’énergie qui manquait pour finir ma maîtrise !
Un merci spécial à Catherine qui m’a donné un si bel exemple de persévérance et qui n’a pas cessé de m’encourager. Merci aussi pour tous les conseils que tu m’as donnés et d’avoir partagé ton expérience avec moi lorsque j’en avais besoin.
Merci aussi à tous ceux qui ont contribué de près ou de loin à la réalisation de mon projet d’un point de vue technique. Merci à David Noël pour ton expertise de terrain, à Baptiste Crescent et Yasmine Kabré pour votre coup de pouce très apprécié ainsi qu’à M. Bouchard et à la Mine Niobec, particulièrement Marie-Line Tremblay, de m’avoir permis d’instrumenter vos puits d’observation. Merci aussi à Bleu et Boréal sans qui le projet n’aurait pas eu lieu.
Je remercie aussi mes amis et les autres personnes de mon entourage pour toutes les fois où vous m’avez posé la question : « Pis, as-tu terminé ta maîtrise là ? ». Même si je n’avais pas envie d’entendre cette question parce que la réponse était : « Non. », ça me motivait à continuer pour pouvoir vous dire « Oui ! ». Merci particulièrement à Jessica et Marie-Pascale de vous être intéressées à mon projet et de m’avoir donné des trucs de concentration pour pouvoir le finir. En parler avec vous me donnait un regain de motivation. Finalement, je veux remercier Julie Lafleur d’avoir accepté de m’engager à temps partiel pour me donner du temps pour travailler sur mon mémoire.
CHAPITRE 1 INTRODUCTION
1.1 MISE EN CONTEXTE
Dans un contexte où les principaux acteurs sur le plan de l’utilisation de l’eau (villes, industries, agriculteurs, etc.) se tournent de plus en plus vers l’eau souterraine, il est nécessaire de bien caractériser cette ressource en quantifiant la recharge des aquifères. Cette recharge, définie comme étant la quantité d’eau qui atteint la nappe phréatique par infiltration (Freeze & Cherry, 1979), peut être évaluée avec différentes approches, mais il est généralement recommandé d’utiliser plusieurs méthodes à la fois afin d’augmenter la validité des résultats obtenus, considérant les incertitudes reliées à chacune de ces méthodes (Scanlon, Healy, & Cook, 2002).
Un producteur de bleuets sauvages de la région du Saguenay-Lac-Saint-Jean, au Québec, Canada, souhaite irriguer une de ses bleuetières à partir de la ressource en eau souterraine. Sa bleuetière est localisée sur l’aquifère de Saint-Honoré dont l’eau souterraine est actuellement exploitée à des fins de production d’eau potable par la ville de Saint-Honoré et par la Mine Niobec. Puisque le système d’irrigation représente un investissement important pour le producteur de bleuets, il est approprié d’évaluer d’abord la recharge de l’aquifère de Saint-Honoré afin d’en assurer une gestion et une exploitation durables.
Une approche multiméthodes est préconisée afin d’évaluer la recharge de l’aquifère en considérant les composantes surfaciques du cycle de l’eau (hydrologie) autant que celles souterraines (hydrogéologie). Ainsi, une méthode basée sur
l’analyse des fluctuations du niveau de la nappe est utilisée et un modèle hydrologique est mis en place. Le but principal de l’étude est d’évaluer la recharge pour l’aquifère de Saint-Honoré. Chacune des deux méthodes utilisées pour y parvenir comporte des objectifs intermédiaires qui seront détaillés dans les chapitres suivants.
1.2 PRÉSENTATION DU TERRITOIRE D’ÉTUDE
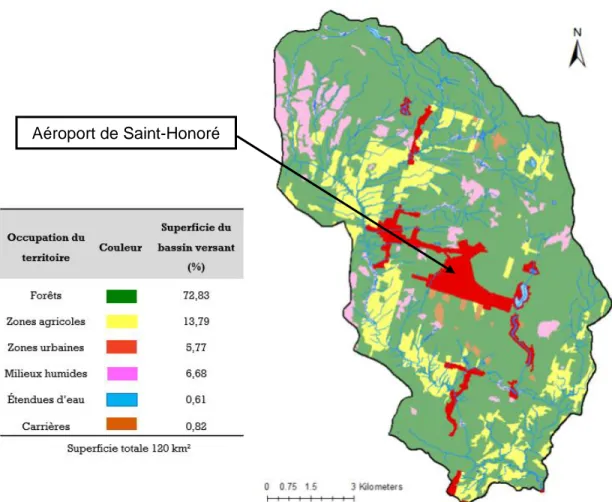
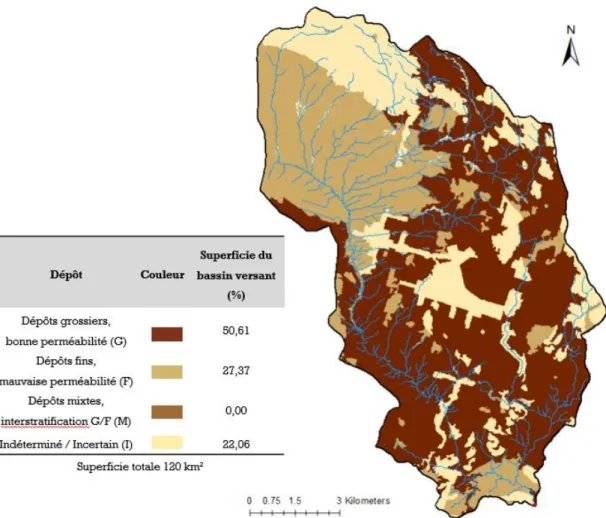
L’aquifère de Saint-Honoré est localisé sur le bassin versant de la rivière Caribou, au nord de la rivière Saguenay qui en est l’exutoire. Le bassin versant, d’une superficie de 120 km², est principalement recouvert de forêt et le sol est majoritairement composé d’un dépôt deltaïque de sable fin à moyen présentant des traces de silt. Ce dépôt repose soit sur une mince couche d’argile ou de till ou directement sur le socle cristallin précambrien (Tremblay, 2005). Les figures 1.1 et 1.2 présentent respectivement l’occupation du territoire et la perméabilité des dépôts de surface du bassin versant. Elles ont été produites à partir des données de la carte écoforestière du Québec (Ministère des Forêts de la Faune et des Parcs, 2015), elle-même réalisée à partir de photographies aériennes.
Figure 1.1 – Occupation du territoire, bassin versant de la rivière Caribou (Modifié de : Ministère des Forêts de la Faune et des Parcs, 2015)
Figure 1.2 – Dépôts de surface, bassin versant de la rivière Caribou (Modifié de : Ministère des Forêts de la Faune et des Parcs, 2015)
L’aquifère de Saint-Honoré ayant fait l’objet de recherches en eau par le passé, autant par la municipalité de Saint-Honoré (LaboratoiresSL, 2000) que par la mine Niobec (Qualitas, 2010), plusieurs puits d’observation y sont présents, et des données de caractérisation des propriétés hydrauliques de l’aquifère sont disponibles. Dans le cadre de cette étude, six de ces puits d’observation ont pu être équipés de capteurs de pression afin d’enregistrer les fluctuations du niveau de la nappe. Ces six puits, ont été sélectionnés en fonction des critères suivants :
▪ hors de la zone d’influence des puits de pompage de la municipalité et de la mine Niobec ;
▪ bonne répartition spatiale sur l’aquifère ;
▪ en bon état (pas de vandalisme, pas de particules dans le puits pouvant l’obstruer, etc.).
Chacun des six puits d’observation instrumentés a également fait l’objet d’un essai de perméabilité à charge variable afin d’obtenir des données relatives à la conductivité hydraulique de l’aquifère.
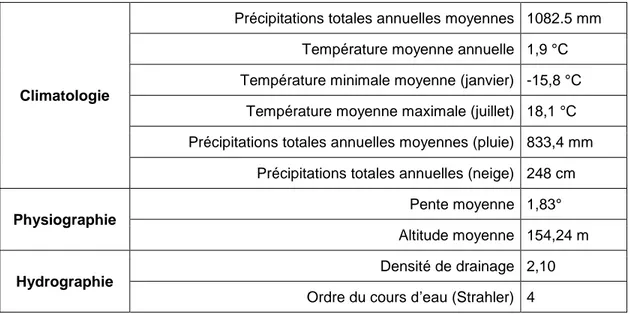
Le relief du bassin versant de la rivière Caribou est relativement plat et plusieurs ruisseaux composent son réseau hydrographique qui est caractérisé par une bonne densité de drainage. Le tableau 1.1 présente les caractéristiques climatologiques, physiographiques et hydrographiques principales du bassin versant.
Tableau 1.1 - Caractéristiques climatologiques, physiographiques et hydrographiques du bassin versant de la rivière Caribou
Climatologie
Précipitations totales annuelles moyennes 1082.5 mm Température moyenne annuelle 1,9 °C Température minimale moyenne (janvier) -15,8 °C
Température moyenne maximale (juillet) 18,1 °C Précipitations totales annuelles moyennes (pluie) 833,4 mm
Précipitations totales annuelles (neige) 248 cm
Physiographie
Pente moyenne 1,83° Altitude moyenne 154,24 m
Hydrographie
Densité de drainage 2,10 Ordre du cours d’eau (Strahler) 4
CHAPITRE 2 ARTICLE SCIENTIFIQUE
AN IMPROVED AUTOMATED WATER TABLE FLUCTUATION METHOD FOR ASSESSING AQUIFER RECHARGE: APPLICATION TO CANADIAN AQUIFERS AND COMPARISON
WITH OTHER METHODS
L’article scientifique présenté dans ce chapitre a été soumis à la revue internationale à comité de lecture Hydrogeology Journal le 20-10-2018 et accepté moyennant révisions le 11-01-2019. Il traite d’une méthode d’évaluation de la recharge des aquifères développée dans le cadre de cette recherche. Il s’agit de la méthode optimisée, codée et automatisée d’analyse des fluctuations du niveau de la nappe (OCA-WTF).
Geneviève Labrecquea*, Romain Chesnauxa; Marie-Amélie Boucherb.
a. Université du Québec à Chicoutimi, Département des Sciences appliquées b. Université de Sherbrooke, Faculté de Génie, Département de génie civil et de
génie du bâtiment.
Keywords
Groundwater recharge; Groundwater monitoring; Stable isotopes; Analytical solution; Water table fluctuation method
2.1 ABSTRACT
The Water Table Fluctuation (WTF) method is widely used to assess groundwater recharge but it is also criticized for certain limitations, namely that it is limited to calculating local recharge because most aquifers are relatively heterogeneous. This study proposes an optimized approach founded on the basic WTF method, to which were added several enhancements, named the "optimized, codified and automated water table fluctuation" method (OCA-WTF), which considers a variable specific yield value. This OCA-WTF method was applied to observation wells located in two aquifers in Eastern Canada for which groundwater recharge had previously been evaluated using several methods. A comparison of OCA-WTF against an isotopic method highlighted that the delay between infiltration and recharge periods can be very long, such that the results are not comparable for the same observation period and that linking water table fluctuations to precipitation records for the groundwater recharge calculation is not always appropriate. Comparisons were conducted between OCA-WTF and other methods, appropriate for regional assessments: (1) two water budget approaches (2) hydrograph separation and (3) an analytical regional solution based on Dupuit-Forchheimer assumptions. These showed that applying the OCA-WTF method to several observation wells and then calculating an average value can yield results that are comparable to those obtained on the scale of catchment areas. The study concludes that the OCA-WTF method can be used for the assessment of groundwater recharge at large, regional scales if the aquifer is monitored by an appropriate network of observation wells.
2.2 INTRODUCTION
Reliable estimations of groundwater renewal rates are important to ensure perennial management of the resource. The renewal rate, otherwise known as groundwater recharge, is the quantity of water reaching the water table of an unconfined aquifer through infiltration (e.g. Freeze and Cherry, 1979). Methods aiming to determine recharge based on measuring water table fluctuations (WTF) are among the simplest and most widespread. The basic WTF method, described in detail by Healy and Cook (2002), is highly intuitive since it relies on the assumption that any increase of the water table level is due to recharge events, when precipitation infiltrates through the vadose zone of the unconfined aquifer. Schematically, the recharge following an infiltration event corresponds to the increase of the water table level multiplied by the specific yield. This soil property is described as the ratio of the volume of water a saturated soil can yield by gravity to the total volume of this soil (Johnson, 1967). The basic WTF method considers the specific yield as a constant variable because it is assumed to be uniform throughout the entire aquifer. This constitutes a weakness of the WTF method, since we know that specific yield varies with depth from ground surface (Childs, 1960) and according to different physical characteristics of the soil such as grain size and porosity. Using the basic, traditional WTF method on an event basis requires the user’s judgement and may therefore introduce a bias.
Several different variants of the basic WTF method have been developed and implemented. The original method (Meinzer, 1923) assesses groundwater recharge on an event basis and requires prior analysis of the water table (WT) data in order to determine which WT level rises result from a recharge event and which do not. Recharge is then calculated for time periods of different lengths, each representing a
recharge event. Crosbie et al. (2005) improved on the WTF method by relating the recharge to time series of precipitation records rather than to individual events. With this improvement, it was no longer required to identify whether a WT level rise was related to a recharge event or not. Crosbie et al. (2005) also developed a methodology able to account for variable specific yield values based on the Van Genuchten (1982) parameters and also able to filter the WT level rises caused by the Lisse effect (Weeks, 2002). The Lisse effect occurs when intense rain seals the top layer of soil and entraps air, causing a pressure rise in the unsaturated zone. This effect is observed in shallow aquifers with an unsaturated zone thickness from 1-1.3 m. Later, Cuthbert (2010) proposed an extended analytical solution of the Boussinesq equation to be used with the basic WTF method. This improved the evaluation of the groundwater drainage component. Moon et al. (2004) developed a statistical version of the WTF method, clustering piezographs (graphic representations of the piezometric level as a function of time) and relating them to precipitation records.
Despite all these enhancements, the basic WTF method remains imprecise, in part because WT level fluctuations do not always correlate with precipitation, because of the time lag during which water travels through the unsaturated zone before reaching the WT. In addition, the variable specific yield proposed by Crosbie et al. (2005) requires prior knowledge of the soil moisture retention curve. This data is not always easily available, and it can be difficult or expensive to acquire data through extensive field investigations and laboratory experiments. Thus, the aforementioned improvements to the basic method proposed by Crosbie et al. (2005) and Cuthbert (2010) are not always suitable.
Despite its known limitations described above, the WTF method has been used in numerous studies to estimate the recharge of very different types of aquifers under different climatic conditions. For example, Misstear et al. (2008) applied it on piezographs from a sand and gravel aquifer in Ireland, in an oceanic climate. Sibanda et al. (2009) and Jassas and Merkel (2014) used the WTF method to assess groundwater recharge of aquifers under semi-arid climates in Zimbabwe and Northern Iraq, respectively. In contrast, Quiroz-Londono et al. (2012) as well as Varni et al. (2013) applied the WTF method in the humid subtropical climate of the Argentina plains, which is characterized by abundant precipitation during summer months and relatively abundant precipitation during the rest of the year. Saghravani et al. (2015) assessed groundwater recharge for a tropical rainforest catchment in Malaysia, a region that experiences abundant precipitation all year long. Ala-aho et al. (2015) and Chemingui et al. (2015) used the WTF method on catchments located in Finland and Eastern Canada respectively, in boreal environments that experience winter conditions during a long period each year and in which the recharge of aquifers is not only controlled by direct precipitation during the summer months but also by snowmelt in the Spring. All these studies used the WTF method combined with other methods to obtain a more accurate series of groundwater recharge estimates. It is common practice to apply several methods on the same territory to gain a better understanding of the groundwater dynamics and reach a higher confidence level in the assessment of recharge.
Despite its widespread use and simplicity, some authors criticize the WTF method because, in most cases, the results are best interpreted in terms of local estimates of the recharge, whereas many applications require a more general estimation at the basin or aquifer scale. Indeed, the WTF method is often considered
for the assessment of groundwater recharge for an area varying between 1 m² and 100 m² around an observation well (Delin et al., 2007).
The main objective of this study was to optimize the existing WTF method for estimation of groundwater recharge by first combining the basic method with several selected, appropriate, previously published enhancements to improve its reliability and accuracy but especially to enlarge its scale of application (from local to aquifer), and secondly, by codifying this optimized method into an automated, digitized program that automatically calculates groundwater recharge estimates at the scale of the aquifer when the required data values are entered. This optimized method for estimating groundwater recharge we called the OCA-WTF for “Optimized, Codified, Automated Water Table Fluctuation”. Another objective was to develop an optimized tool easily used by practitioners to conduct an economical and rapid estimation of recharge at the aquifer scale. Finally, the study compared the results of this OCA-WTF method against other regional methods based on two case studies.
The objectives of this study are (1) to develop an improved, automated approach to the WTF method (which we named OCA-WTF) that does not require detailed information on soil hydraulic properties and can be easily applied; (2) to illustrate, by comparison with other methods, that the OCA-WTF method can be used to estimate recharge on a large scale when a network of observation wells is available to provide data over an entire aquifer; (3) to illustrate results using two examples of aquifers located in Eastern Canada in a boreal climate, and comparing them against results obtained using other methods.
2.3 METHODOLOGY
2.3.1 CODING FOR AUTOMATED CALCULATION
Similar to the approaches proposed by Crosbie et al. (2005) and Cuthbert (2010), the simplified automated approach developed in this study is independent of the user’s judgement. Recharge is computed following Eqn (2.1) (Healy and Cook, 2002):
𝑅𝑒 = 𝑆𝑦× ∆𝐻 ∆𝑡⁄ (2.1)
where ∆𝐻 is the water table rise (mm) over the chosen time step ∆𝑡 (day), 𝑆𝑦 is the
specific yield and 𝑅𝑒 is the recharge over the chosen time step (mm/day). There are different approaches for calculating the water table rise; two of them are combined in the OCA-WTF method proposed in this study. The first is the RISE algorithm (Rutledge, 1998), which is known for being easily applied but also for underestimating the recharge because it does not consider the continuous drainage of the aquifer. Indeed, even if the groundwater level increases during a given period, the aquifer is also continuously draining over that same period. In the absence of a recharge event, the water table level would continue to fall. The quantity of water reaching the water table is therefore greater than what is observed in the well. The RISE algorithm considers the water level rise for one day as the difference between that day’s water table level and that of the previous day. The second approach for calculating the water table rise integrated into the proposed OCA-WTF is the graphic method developed by Delin et al. (2007). It consists in manually extrapolating each recession period to account for the continuous drainage of the aquifer, and calculating the recharge on an
event basis, considering the rise in water for this event as the difference between the maximum level observed and the extrapolated level for the same day.
The RISE algorithm by Rutledge (1998) and the graphical method by Delin et al. (2007) are combined and integrated into the basic WTF method to create the proposed OCA-WTF method developed in this study. The enhanced method extrapolates the recession periods and calculates the water level rise for each day as shown in Eqn (2.2) and Eqn (2.3):
∆𝐻 = 𝐻𝑛𝑜𝑡(𝑡) − 𝐻𝑛𝑜𝑡(𝑡 − 1) (2.2)
𝐻𝑛𝑜𝑡(𝑡) = 𝐻(𝑡) + (𝐻𝑚𝑖𝑛,𝑖− 𝐻𝑒𝑥𝑡(𝑡)) (2.3)
where 𝐻(𝑡) is the observed water table level (m) in the well at time 𝑡 (day), 𝐻𝑚𝑖𝑛,𝑖 is
the level of the local minimum (m) for the recession period 𝑖 preceding the WT rise and 𝐻𝑒𝑥𝑡(𝑡) is the extrapolated level (m) for the same time 𝑡 (day). 𝐻𝑛𝑜𝑡(𝑡) and
𝐻𝑛𝑜𝑡(𝑡 − 1) are notional water table levels (m) which represent the levels that would
be observed in the observation well at time 𝑡 and 𝑡 − 1, respectively, if there were no constant drainage of the aquifer. The recharge over a period of one year is then simply calculated as the sum of each day’s recharge, following Eqn (2.1).
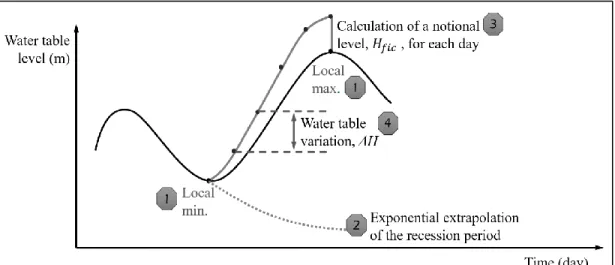
The OCA-WTF method developed in this study was codified and automated by implementation in MatLab R2015b. The automated calculation goes through five steps shown in Fig. 2.1: (1) identification of the local minimums and maximums of the piezograph; (2) logarithmic extrapolation of the recession periods from each minimum to the next maximum; (3) calculation of the notional levels, 𝐻𝑛𝑜𝑡 over the period
covered by the extrapolation; (4) calculation of the increase in level compared with the previous day; (5) computation of groundwater recharge values for each time step with Eqn (2.1).
Fig. 2.1 - Diagram of the groundwater recharge calculation methodology implemented in the proposed automated approach
Before applying these five steps, the observed water table level time series data are smoothed using a simple moving average to remove noise that could lead to an overestimation of groundwater recharge. The OCA-WTF approach is not powered to determine whether the observed fluctuations are in fact caused by noise or by real recharge events; it thus calculates recharge for all fluctuations, leading to a systematic overestimation of recharge. The noise in data can be generated by: (1) the Lisse effect (Weeks, 2002); (2) improper calibration or malfunction of the pressure sensors; (3) preferential flow paths; (4) the presence of a nearby pumping well. In that last case, the WTF method should not be applied on the observation well in question.
Finally, resolving Eqn (2.1) requires that specific yield values of the soil layers be determined. When using the WTF method it should be noted that specific yield proportionally affects our estimation of groundwater recharge; it is therefore important
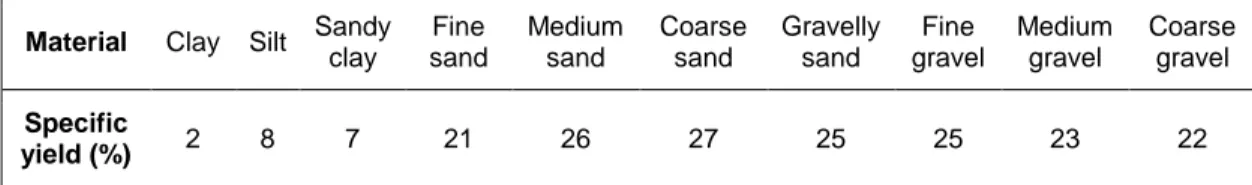
to evaluate specific yield as accurately as possible. When data is not available from field investigations or laboratory experiments, the specific yield can be estimated from the soil types identified in the drilling reports available for each observation well where the WTF method is to be applied. This way, no additional field investigations are required. Moreover, since the water table fluctuates over time, its location may change from one material to another, depending on the stratigraphy. For this reason, the proposed OCA-WTF approach accounts for the existence of variable specific yield values within a single aquifer by allowing for multiple values for specific yield in its calculation. First, the specific yield value of each material is identified qualitatively according to Table 2.1 (Johnson, 1967) that compiles the results of several studies for different aquifer materials and using different field and laboratory experiments.
Table 2.1 - Specific yield values for different soil types (adapted from Johnson, 1967)
Material Clay Silt Sandy clay Fine sand Medium sand Coarse sand Gravelly sand Fine gravel Medium gravel Coarse gravel Specific yield (%) 2 8 7 21 26 27 25 25 23 22
Once a specific yield value has been attributed to each layer of soil observed in the observation well stratigraphy, the soil in which the water table is located is identified for each time step and its specific yield value is used for the recharge computation. The specific yield used in Eqn (2.1) varies with depth and changes as often as the water table fluctuates within different materials. This enhancement of the basic WTF method eliminates the assumption inherent to the basic WTF method that the specific yield is constant and has a fixed value for each observation well or for the entire aquifer. Indeed, authors calculating recharge using the basic WTF method (e.g.
Jassas and Merkel, 2014; Misstear et al., 2008; Sibanda et al., 2009) had considered a single averaged value for the specific yields of the different soil types encountered in the stratigraphy of an aquifer, a practice which represents a limitation to accuracy. The inclusion of multiple specific yield values as a function of stratigraphy by the proposed automated OCA-WTF approach constitutes an improvement in the calculation of recharge.
2.3.2 COMPARISON OF OCA-WTF AGAINST OTHER METHODS FOR THE ASSESSMENT OF GROUNDWATER RECHARGE
Groundwater recharge rates obtained using OCA-WTF were compared to results obtained using 4 other existing methods for calculating recharge: the isotopic dating of groundwater (Chesnaux and Stumpp, 2018), an analytical regional estimate using the Dupuit-Forchheimer assumption (Chesnaux, 2013), water budgets and hydrograph separation (Huet et al., 2016). They are described hereafter.
Isotopic method
A study conducted by Chesnaux and Stumpp (2018) aimed at assessing groundwater recharge from stable isotopes of pore water contained in soil samples from a site located on the Caribou River catchment located in Eastern Canada in a nordic humid climate. These samples were collected along the unsaturated zone at intervals of 10 cm from ground surface to the water table. The isotope ratios of pore water extracted from the samples make it possible to identify whether the water comes from snowmelt or from precipitation. On one hand, the infiltration periods can be linked to pore water contained in the vadose zone of the aquifer as a function of depth. On
the other hand, groundwater recharge is calculated from the determined volumetric water content profile in the vadose zone from the soil samples. Combining the results of both these analyses, i.e., pore water volumetric content results with pore water isotope results, makes it possible to determine not only recharge, but also the period to which recharge corresponds (months, seasons), and ultimately to correlate recharge with the type of infiltration (precipitation vs. snowmelt). This method does not consider possible horizontal flows in the unsaturated zone, but rather, it considers that water infiltrates and flows only vertically until it reaches the water table. Consequently, the isotopic method may overestimate the groundwater recharge. The results of this method can also be affected by local site effects, as described in Chesnaux and Stumpp (2018): topographical effects such as runoff accumulation or local effects of heterogeneity of the vadose zone.
Regional calculation based on Dupuit-Forchheimer assumptions
The Dupuit-Forchheimer model (Dupuit, 1863; Forchheimer, 1886) simplifies groundwater flows to a single dimension according to certain assumptions. The aquifer must overlie an impervious substratum that is assumed to be fully horizontal. The aquifer must also be bound by the upstream no-flow boundary and the downstream constant head boundary. In this conceptual idealized model, the vertical component of velocity is considered negligible compared to the horizontal component. Also, this aquifer is considered homogeneous and isotropic; steady-state conditions are assumed for the flow. An analytical approach developed by Chesnaux (2013) proposes to estimate groundwater recharge on a large scale based on the Dupuit-Forchheimer model. This approach requires prior knowledge of the hydraulic conductivity of the entire aquifer, which is considered to be homogeneous. It also
assumes water table levels to be static along the main horizontal flow direction to determine the water table profile. Plotting the squared value of saturated thickness of the aquifer observed (or projected) along the flow line as a function of the distance from the upstream aquifer boundary then makes it possible to calculate groundwater recharge based on a constant parameter (representing the ratio of recharge to hydraulic conductivity) obtained from the equation established following a quadratic regression. Groundwater recharge is then calculated when the hydraulic conductivity is known. This method provides an estimate of the mean annual groundwater recharge on a large scale, since it considers a regional flowline through the aquifer.
Water budget and hydrograph separation methods
Water budget methods and hydrograph separation can also be used to estimate groundwater recharge. For instance, Huet et al. (2016) compared four different approaches for assessing groundwater recharge. They assessed groundwater recharge at a larger scale over four different catchments in a nordic humid climate, also located in Eastern Canada. Two of the methods they used were water budgets (WB). WB1 relies on vertical inflows calculated using the GR4J (Perrin et al., 2003) conceptual hydrological model and WB2 is based on vertical inflows calculated using the HYDROTEL (Fortin et al., 2001) physics-based hydrological model. Both WB methods involve an empirical equation developed by Hydro-Québec (Bisson and Roberge, 1983) combined with the Budyko (1974) relation for the calculation of evapotranspiration, along with hydrograph separation for surface runoff calculations. The third method studied by these authors was also a water budget, but spatially distributed on a 250 m x 250 m grid with surface runoff calculated using the USA Soil Conservation Service Curve Number (SCS-CN) method adapted to the climatic
conditions of the study territory (Monfet, 1979). The fourth approach was the baseflow separation method (Eckhardt, 2005) which assumes that baseflow discharge equals groundwater recharge based on the assumption that baseflow corresponds to groundwater discharge into rivers. These four methods assess groundwater recharge at the catchment scale.
2.4 FRAMEWORK OF APPLICATION
For the purposes of this study, the optimized, codified, automated WTF (OCA-WTF) method developed in this study was applied to two different sites chosen for purposes of comparison against the methods detailed above. These two sites are the Caribou River catchment and the La Malbaie River catchment, both located in Eastern Canada.
2.4.1 CARIBOU RIVER CATCHMENT
The first territory under study is the Caribou River catchment which contains the Saint-Honoré aquifer. The study of Chesnaux and Stumpp (2018) assessed groundwater recharge using the isotopic method at two locations on this aquifer, which consists of a deltaic deposit composed mainly of fine to medium sand and is exploited for drinking water production (Boumaiza, 2008; Tremblay, 2005). An evaluation of groundwater recharge in this aquifer is crucial to ensure a sustainable management of the resource by its different users. The OCA-WTF method developed in this study was applied to assess groundwater recharge for the entire aquifer based on local estimates at six locations of existing observation wells. These observation wells were equipped with pressure sensors for a period varying between 394 days (minimum
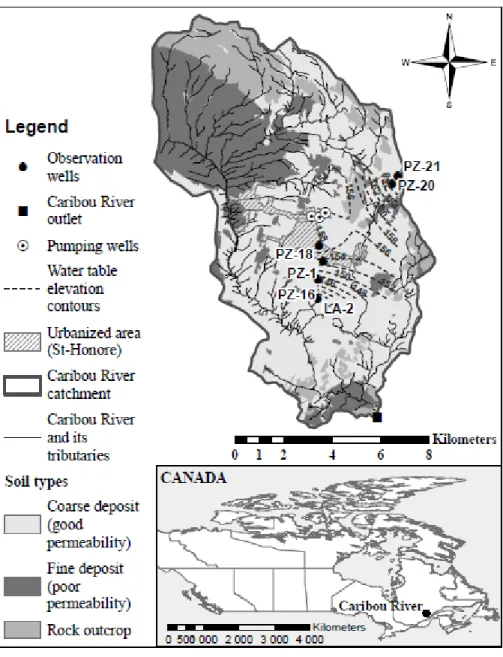
observation period length) and 535 days (maximum observation period length) to observe the WT fluctuations. Fig. 2.2 shows the Caribou River catchment and the location of the observation wells. According to the water table elevation contour plots (dashed lines on Fig. 2.2) obtained from the mean water table observed in the six observation wells, the direction of groundwater flow was determined to be mainly from north to south, but there is a plateau from which a portion of groundwater flows in a south-west direction. However, the behavior of the subsurface flows in the northwestern part of the aquifer cannot be determined with certainty since there are no observation wells in that area to testify.
Fig. 2.2 - Caribou River catchment soil types, location of the six observation wells and water table elevation contours
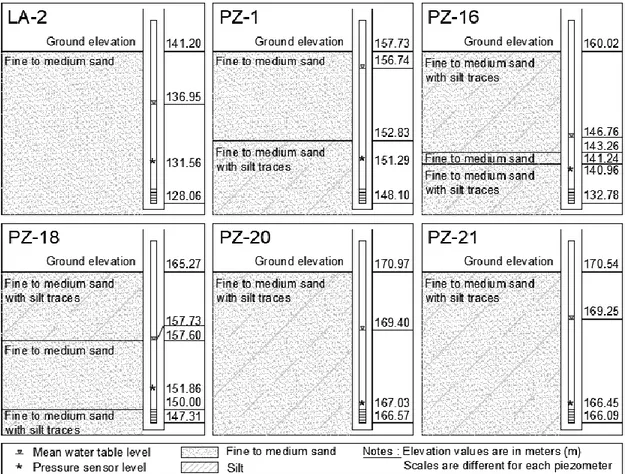
The soil material varies slightly from one observation well to another. Fig. 2.3 shows the stratigraphy of each well; the most frequently observed soil material in this aquifer is fine to medium sand with traces of silt. Figure 2.3 also shows the mean water table elevation from which the unsaturated zone thickness has been calculated for each observation well. Note that the water table elevations in the six wells are not
affected by the pumping wells and that these elevations are representative of regional natural flow conditions.
Fig. 2.3 - Observation wells, stratigraphy and mean water table levels (not to scale) on the Caribou River catchment
2.4.2 LA MALBAIE RIVER CATCHMENT
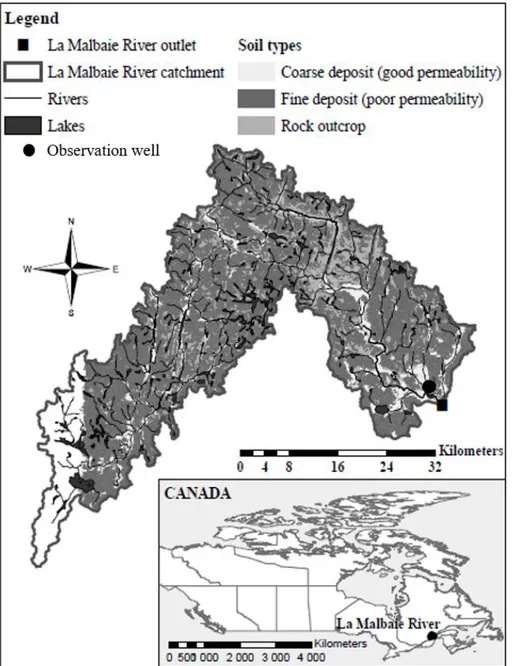
The second territory under study is the La Malbaie River catchment, also located in Eastern Canada. There is one observation well on this catchment that monitors the water table for an unconfined granular aquifer, shown on Fig. 2.4, and it is part of Quebec’s Provincial Government WT monitoring network covering the entire province. The water table level observations are freely accessible, which facilitates the
application of the OCA-WTF method for comparing the results obtained with those of Huet et al. (2016).
Fig. 2.4 - La Malbaie River catchment, soil types and location of the observation well
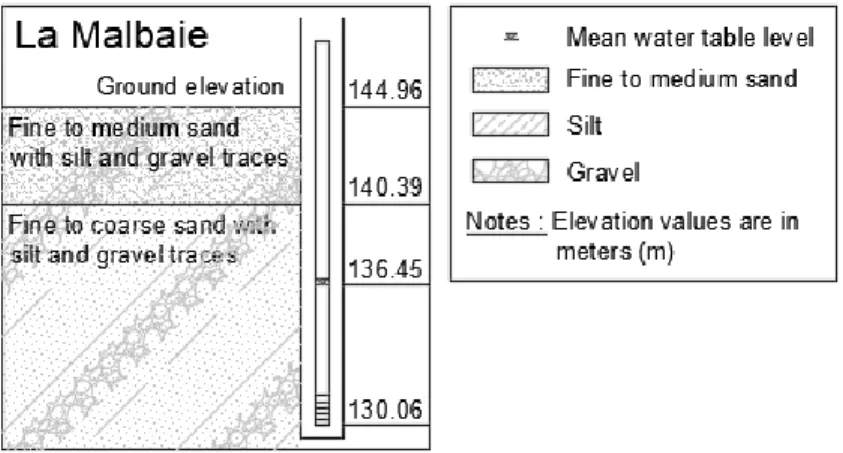
The observation well is located in a deltaic deposit composed of fine to coarse sand with gravel and silt traces, as noted in the stratigraphy of the observation well shown in Fig. 2.5, along with the mean water table level.
Fig. 2.5 - La Malbaie observation well stratigraphy and mean water table level
2.5 RESULTS
2.5.1 RESULTS OBTAINED WITH THE OPTIMIZED CODIFIED AUTOMATED-WTF (OCA-WTF) METHOD IN THE CARIBOU RIVER CATCHMENT
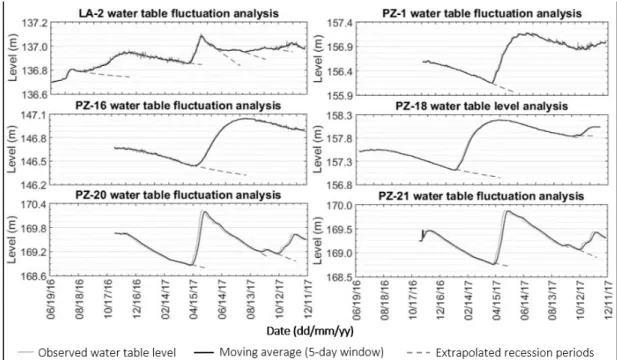
The piezographs of the six observation wells on the Caribou River catchment, shown in Fig. 2.6, made it possible to locally assess groundwater recharge. Fig. 2.6 also shows the WT recession period extrapolations. It should be noted that the observation periods vary from one observation well to another and that they all end on December 8, 2017. The 2017 recharge values calculated exclude 23 missing days of WT observations. Regarding the moving average used to smooth the piezographs and filter noise in the data, a sensitivity analysis has shown that a 5-day window was the most appropriate. Indeed, the recharge results changed considerably by reducing the time frame but were not changed significantly by increasing it.
Fig. 2.6 - OCA-WTF analysis for six observation wells in the Caribou River catchment
The OCA-WTF analysis for the six wells combined yields a mean groundwater recharge value of 0.95 mm/day for the Caribou river catchment, with a standard deviation of 0.38 mm/day (see Table 2). This high variability between individual well data was expected, given the fact that the WTF method provides very local estimates of groundwater recharge, i.e., specific to each well.
Table 2.2 - Groundwater recharge values obtained using the proposed Optimized Codified Automated WTF (OCA-WTF) method for the six observation wells located in the Caribou River catchment
Observation well ID Length of observation period (days) Mean vadose zone thickness (m) 2017 Recharge (mm) Mean daily recharge (mm/day) LA-2 535 4.25 177 0.45 PZ-1 394 0.99 455 1.22 PZ-16 401 13.25 189 0.51 PZ-18 401 7.54 357 0.95 PZ-20 401 1.57 521 1.33 PZ-21 401 1.29 402 1.23 Mean 350 0.95 Standard deviation 140 0.38
The mean daily recharge values roughly correlate with the vadose zone thicknesses (R2=0.52), as shown in Fig. 2.7. The lesser the thickness of the vadose
zone, the greater the recharge. This is explained by (1) the variation of the hydraulic conductivity with depth that makes the soil surface increasingly impervious with increasing vadose zone thickness, preventing water from infiltrating; and (2) the horizontal flows occur more probably in thicker vadose zones and prevent some of the infiltrated water from reaching the water table.
Fig. 2.7 - Correlation between the vadose zone thickness and the calculated value of recharge
2.5.2 COMPARISON BETWEEN RESULTS OBTAINED BY OCA-WTF AND OTHER METHODS
Isotopic Method
The isotopic study conducted by Chesnaux and Stumpp (2018) on the Caribou River catchment used samples collected from a borehole (named Site C2 in their study) drilled at a distance approximately 5 meters from an observation well (LA-2, see Fig. 2.2) in which data were recorded for this current OCA-WTF study (both studies were being conducted over slightly different time periods that overlapped). In their study, Chesnaux and Stumpp (2018) established that the infiltration rate at their C2 borehole is of 0.89 cm/day in summer/early autumn and of 0.82 cm/day in spring during the snowmelt period. This allowed them to associate a period of 140 days of infiltration history (1st June to 16th October, 2016) to the 239 mm groundwater recharge
value they calculated from pore water content in soil samples collected on 16th
October, 2016. The OCA-WTF analysis was conducted on the LA-2 observation well for approximately the same period, shown in Fig. 2.8 (June 21st to 16 October, 2018);
observation period calculated from the infiltration rate started 20 days before our study (1st June) because the observation well LA-2 used for our study was equipped with a
pressure sensor only on 21st June. The mean daily recharge values obtained by
means of the isotopic and the OCA-WTF analysis for this period are, respectively, 1.73 mm/day for site C2 and 0.26 mm/day for LA-2 observation well.
Fig. 2.8 - OCA-WTF analysis for LA-2 observation well (21st June to 16 October 2016)
Since water that infiltrates at this location has 4.25 meters of unsaturated zone to travel before reaching the water table surface, the water table observations collected at LA-2 from 21st June to 16 October 2016 correspond to an infiltration period
that occurred from 478 days (infiltration rate of 0.89 cm/day) to 518 days (infiltration rate of 0.82 cm/day) before this date. The groundwater recharge calculated using the OCA-WTF method in this study was generated by an infiltration period that occurred more than a year before the one calculated using the isotopic analysis (Chesnaux and Stumpp, 2018). It is therefore not surprising that groundwater recharge values are not
the same. Table 3 summarizes the different infiltration periods analyzed using the two groundwater recharge assessment methods and the corresponding results.
Table 2.3 - Groundwater recharge values calculated using two different methods and their infiltration periods
Method
Groundwater recharge value (mm)
Dates of data used with the 2
methods
Period of infiltration that led to this groundwater recharge value OCA-WTF 58 Water table observation period Infiltration rate Approximative period 21st June to 16 October 2016 0.82 cm/day 21st January to 18 May 2015 0.89 cm/day 1 st March to 26 June 2015 Isotopic analysis (Chesnaux and Stumpp, 2018) 239 Soil sampling date 1st June to 16 October 2016 16 October 2016
Since the infiltration period corresponding to the observed water table level from 21st June to 16 October 2016 was deduced from the infiltration rate calculated using
the water isotope profile of the LA-2 site, it is impossible to identify the exact dates of this infiltration period. Indeed, the infiltration rate depends on the season, as found by Chesnaux and Stumpp (2018), but this exact infiltration season remains unknown. Despite this uncertainty, the infiltration period corresponding to the water table levels observed from 21st June to October 2016 at LA-2 is more likely the one calculated with
a 0.82 cm/d infiltration rate. Indeed, this infiltration rate indicates that the groundwater recharge calculated for this observation period with the OCA-WTF method would have been generated by infiltrations from 21st January to 18 May 2015, a period which
corresponds to the winter and early spring seasons. The low groundwater recharge calculated (58 mm) could very likely correspond to winter conditions and the beginning of the spring melt in April and May of 2015. As observed in Fig. 2.8, the water table is rising during all this period, as is expected for the spring melt. In order to know exactly which period of infiltration yielded the groundwater recharge obtained using the OCA-WTF method, the isotopic profile of the unsaturated zone would be needed for a longer period preceding 21st June 2016. This analysis highlights that the OCA-WTF approach
does not always make it possible to correlate single precipitation events with a corresponding water table fluctuation value. The OCA-WTF method makes it possible to determine the quantity of water reaching the water table, but not to trace back the precise origin of the infiltration. In order to do that, one would have to conduct isotopic tracing of pore water located above the water table. However, we can still roughly expect that the shallower the water table, the younger the precipitation event associated with an observed rise of the water table.
Regional assessment method based on the Dupuit-Forchheimer assumptions
The approach for assessing the mean regional groundwater recharge based on the Dupuit-Forchheimer assumptions developed by Chesnaux (2013) was applied to the Caribou River catchment for comparison against the results of the OCA-WTF method and a good agreement was observed. The mean water table levels observed in the six observation wells equipped with pressure sensors were used as the water table profile of this aquifer, considered constant over time when using the Dupuit-Forchheimer model. The quadratic regression of the squared saturated soil height against the distance from the upstream boundary of this aquifer (see Fig.2.9) yielded a mean recharge value of 307 mm/year.
Fig. 2.9 - Quadratic regression of the squared saturated soil height against the distance from aquifer’s upstream impermeable boundary
The mean value of the local results obtained using the OCA-WTF method (0.95 mm/day) is comparable to the one obtained using a regional approach (0.84 mm/day) with a difference of 12%. However, even if this regional approach is a useful tool for drawing a rough picture of the regional recharge, because it assumes mean steady-state conditions, it does not consider the variation of regional recharge over time. The similar recharge values obtained using the OCA-WTF and regional methods confirm that for this case study, it is possible to estimate groundwater recharge at the aquifer scale by applying the OCA-WTF method on several observation wells spatially dispersed over the aquifer.
Water budget and hydrograph separation methods
The piezograph for the La Malbaie observation well is shown in Fig. 2.10 for a period of 7 years (2010-2017) with daily time steps, along with the recession period extrapolations and groundwater recharge values obtained for each year using the proposed OCA-WTF approach. The average groundwater recharge for this
observation well is evaluated to 208 mm/year based on the 7-year observation period with a standard deviation of 85 mm/year due to inter-annual variability.
Fig. 2.10 - OCA-WTF analysis for La Malbaie observation well and annual recharge results
The mean annual groundwater recharge value obtained using the OCA-WTF method for the La Malbaie observation well generally agrees with the values obtained by Huet et al. (2016) using water budget methods and hydrograph separation (see Table 4).
Table 2.4 - Mean groundwater recharge values for La Malbaie
Groundwater recharge results from Huet et al. (2016) (mm/y) Groundwater recharge OCA-WTF
(mm/y) WB1 WB2 Spatial water budget
with SCS-CN Baseflow (total year) Baseflow (June-Feb) 237 180 208 368 220 208
Difference with the OCA-WTF result (%)
-
The mean groundwater recharge values from Huet et al. (2016) can be compared to the mean annual result obtained with the WTF method. Excluding the hydrograph separation method based on total year data (Table 4), which was suspected to overestimate groundwater recharge by Huet et al. (2016), the OCA-WTF method yields a local result with a difference lesser than 15% compared to regional assessments.
The spatial water budget with surface runoff calculations using the modified SCS-CN approach (Huet, et al., 2016) yields the exact same groundwater recharge value as the one obtained using the proposed OCA-WTF approach. Huet et al. (2016) used data from 1989 to 1992, so the 208 mm groundwater recharge is a mean annual value over this period. For the OCA-WTF computation, data from 2010 to 2017 were used in this study. Groundwater recharge values were expected to differ between the two methods being compared in this section, because different infiltration periods are considered. Furthermore, the spatial water budget of Huet et al. (2016) indicates the quantity of water that infiltrates annually. This water is not expected to reach the saturated zone in its entirety, because of preferential flow paths created by heterogeneities of the aquifer and horizontal flow. It is therefore even more evident that those two methods only rarely lead to identical results. The fact that we obtained identical results in this comparison is probably incidental and cannot be explained by the attributes of the different methods. Still, these results show that for the two catchments under study, results from the OCA-WTF method are comparable with regional estimation results. These comparable results depend in part on the nature of the soil over the study territory; these might differ for aquifers or basins having very different characteristics (for instance presenting a prevalence of fractured rock, or a
high degree of heterogeneity). In the La Malbaie River catchment, groundwater recharge occurs mostly through the small unconfined granular aquifer in which the observation well is located (see Fig. 2.4), and the rest of the catchment surface is covered with rock outcrops or impervious materials. Groundwater recharge in these semi-confined and confined aquifers can thus be considered as negligible.
Comparison of all the methods
Water table levels do not vary in the same way each year; the same is true for groundwater recharge, which presents an inter-annual variability due to climatic variations (Tremblay, 2009). To compare all the different methods used in this study to assess groundwater recharge, the mean daily values are presented in Table 5. The lower standard deviation observed for the results of the La Malbaie River catchment (0.21) are indicative of a better agreement between the four methods in this study territory than in the Caribou River catchment. It should be noted, however, that data records were much longer in the La Malbaie River catchment than in the Caribou River catchment. Indeed, the observation wells on the Saint-Honoré aquifer (Caribou River catchment) monitored the water table for only 535 days in the best of cases, whereas the observation well on the La Malbaie River catchment recorded seven years of data. The mean value obtained at La Malbaie River may be more representative of the behavior of the catchment.
Table 2.5 - Comparison of the results obtained using all the methods for the Caribou and La Malbaie River catchments
Caribou River catchment La Malbaie River catchment
Method Mean daily
recharge (mm/day) Method
Mean daily recharge (mm/day)
WTF 0.96 WTF 0.57
Isotopes 1.73 Water budgets (3) 0.57
Dupuit-Forchheimer 0.84
Baseflow (total year) 1.00 Baseflow (June-Feb) 0.81
Mean 1.18 Mean 0.74
Standard
deviation 0.48 Standard deviation 0.21
2.6 DISCUSSION
The optimized, codified and automated water table fluctuation approach proposed in this study (OCA-WTF) yielded results that are comparable to other methods for the two catchments under study, while requiring less data than previous versions of the WTF method proposed by Crosbie et al. (2005) and by Cuthbert (2010). Although the fact that the method is automated makes it independent of the user, it still requires a sensitivity analysis to evaluate the appropriate moving average window to eliminate the noise in the WT level data. For the two catchments of this study, a 5-day window was deemed the most appropriate, but it could vary for other sites.
Quiroz-Londono et al. (2012) showed that there is no clear correlation between precipitation events and the water table level over a same time frame. This is likely due to the travel time of water in the unsaturated zone, which depends greatly not only on soil type, but also on the unsaturated zone thickness that controls hydraulic
properties. Indeed, hydraulic conductivity is a function of the capillary pressure partly controlled by the thickness of the unsaturated zone.
The heterogeneity of the aquifer also impact the time required for water to infiltrate until it reaches the water table. The groundwater recharge calculated from the WT level rises observed in an observation well for one day does not necessarily correspond to that day’s precipitation. This is also observed in the results obtained for the LA-2 well. Therefore, it can be said that the WTF method makes it possible to assess the groundwater recharge generated by water that actually reaches the water table, but during an unknown infiltration period. As highlighted in the comparison against the results from Chesnaux and Stumpp (2018) for the LA-2 well, unsaturated zone pore water isotopic profiles can be used to complement one another in linking infiltration periods to the groundwater recharge obtained using the OCA-WTF method.
According to many authors (e.g. Delin et al., 2007; Jie et al., 2011), the WTF method assesses groundwater recharge values only on a very local scale, over an area covering 1 to 100 m². This is because the hydraulic properties of aquifers are known to be highly variable from a spatial standpoint. Thus, the WTF method provides local estimates of groundwater recharge, as shown with the results obtained on the Caribou River catchment. If a sufficient number of those estimated values can be collated and combined to cover the entire study territory, then averaged, the mean value thus obtained may be considered to be representative of the whole territory. Since the water table level varies more or less slowly depending on the soil’s hydraulic properties, the location of the observation wells is important to obtain a representative value of groundwater recharge. Lee et al., (2005) drew the same conclusion from their
study, in which they assessed groundwater recharge when applying the WTF method to six observation wells located over a 0.256 km² area.
2.7 CONCLUSION
The optimized, codified and automated water table fluctuation approach proposed in this study (OCA-WTF) (objective 1) was applied to six observation wells located in the Caribou River catchment and to one observation well located in the La Malbaie River catchment for purposes of comparison against other previous studies that assessed groundwater recharge at larger scales in the same catchments. Comparison against the isotopic method highlighted the fact that the delay between infiltration and recharge periods can be very long (more than a year), hence the fact that these two methods are not comparable for the same period. This comparison also showed that because of the long delay between infiltration and recharge, linking the water table fluctuations to precipitation records to evaluate groundwater recharge is not always appropriate (objective 3). Comparison against different water budget approaches, baseflow separation methods from hydrographs and regional analytical estimation based on Dupuit-Forchheimer assumptions, have shown that the mean result of groundwater recharge obtained using the OCA-WTF method applied to multiple observation wells over a study territory can be representative of a catchment area (objective 2). This comparison also showed that in certain cases (e.g., in small and homogeneous aquifers), such as the La Malbaie observation well, a single point of information can also be representative of an entire catchment. The OCA-WTF method can thus be used at scales greater than the 1-100 m2 area that had previously been
evaluated by Delin et al. (2007), if the aquifer is well covered by piezometers or when the aquifer is homogeneous.
It is common practice to rely on several methods to define a range of groundwater recharge values over a study territory (Scanlon et al., 2002). The present study showed by comparison that different methods should not be expected to produce identical results. The available methods do not take into account the same groundwater components (i.e. water that infiltrates or water that reaches the water table level) or the same periods, as was seen with the isotopic and OCA-WTF methods or the water budgets and OCA-WTF methods, for example. Hence, using those methods jointly to define a range of groundwater recharge values could lead to an inadequate definition of the recharge range values.
Further work could include evaluating the minimum number of observation wells that are necessary to assess groundwater recharge at large scales with the OCA-WTF method. Considering the high uncertainties in groundwater recharge assessment, it could be interesting to compare more methods to the OCA-WTF, including catchment modeling that would account for interactions with surface water.
2.8 ACKNOWLEDGEMENTS
The authors would like to thank Mr. David Noël for his much-appreciated technical guidance during fieldwork. The authors also wish to thank the Foundation of Université du Quebec à Chicoutimi (UQAC) for a research grant awarded to Profs Marie-Amélie Boucher and Romain Chesnaux, which made this work possible. Some of the data used in this study were available thanks to Quebec’s Provincial Government. Finally, without the collaboration of Niobec Mine (Ms. Marie-Line Tremblay), Mr. Christian Bouchard (Saint-Honoré resident) and the Saint-Honoré airport (Mr. Dany Gauthier),
gathering the WT observations from the 6 observation wells on the Caribou River catchment would not have been possible. The authors are grateful to those collaborators and wish to thank them.
2.9 REFERENCES
Ala-aho P, Rossi PM, Kløve B (2015) Estimation of temporal and spatial variations in groundwater recharge in unconfined sand aquifers using Scots pine inventories. Hydrology and Earth System Sciences 19: 1961-1976 DOI 10.5194/hess-19-1961-2015
Bisson J, Roberge F (1983) Prévision des apports naturels: Expérience d'Hydro-Québec, workshop on flow predictions. Institute of Electrical and Electronics Engineers (IEEE), Toronto.
Boumaiza L (2008) Caractérisation hydrogéologique des hydrofaciès dans le paléodelta de la rivière Valin au Saguenay (Hydrogeological characterization of hydrofacies in the Valin River Paleodelta in Saguenay). M. Sc., Université du Québec à Chicoutimi
Budyko MI (1974) Climate and Life, Volume 18 Academic Press
Chemingui A, Sulis M, Paniconi C (2015) An assessment of recharge estimates from stream and well data and from a coupled surface-water/groundwater model for the des Anglais catchment, Quebec (Canada). Hydrogeology Journal 23: 1731-1743 DOI 10.1007/s10040-015-1299-1
Chesnaux R (2013) Regional recharge assessment in the crystalline bedrock aquifer of the Kenogami Uplands, Canada. Hydrological Sciences Journal-Journal Des Sciences Hydrologiques 58: 421-436 DOI 10.1080/02626667.2012.754100
Chesnaux R, Stumpp C (2018) Advantages and challenges of using soil water isotopes to assess groundwater recharge dominated by snowmelt at a field study located in Canada. Hydrological Sciences Journal 63: 679-695 DOI 10.1080/02626667.2018.1442577
Childs EC (1960) The nonsteady state of the water table in drained land. Journal of Geophysical Research 65: 780-782 DOI 10.1029/JZ065i002p00780
Crosbie RS, Binning P, Kalma JD (2005) A time series approach to inferring groundwater recharge using the water table fluctuation method. Water Resources Research 41: 9 DOI 10.1029/2004wr003077
Cuthbert MO (2010) An improved time series approach for estimating groundwater recharge from groundwater level fluctuations. Water Resources Research 46 DOI 10.1029/2009wr008572
Delin GN, Healy RW, Lorenz DL, Nimmo JR (2007) Comparison of local- to regional-scale estimates of ground-water recharge in Minnesota, USA. Journal of Hydrology 334: 231-249 DOI 10.1016/j.jhydrol.2006.10.010
Dupuit J (1863) Études théoriques et pratiques sur le mouvement des eaux dans les canaux découverts et à travers les terrains perméables : avec des considérations relatives au régime des grandes eaux, au débouché à leur donner, et à la marche des alluvions dans les rivières à fond mobile (2e édition revue et considérablement augmentée) Dunod, Paris
Eckhardt K (2005) How to construct recursive digital filters for baseflow separation. Hydrological Processes 19: 507-515 DOI doi:10.1002/hyp.5675
Forchheimer P (1886) Über die Ergiebichkeit von Brunnen-Anlagen und Sickerschlitzen (Fertility of well systems and seepage slots) Zeitschrift des Architectenund Ingenieurs Vereins zu Hannover 32: 539-564
Fortin JP, Turcotte R, Massicotte S, Moussa R, Fitzback J, Villeneuve JP (2001) Distributed watershed model compatible with remote sensing and GIS data. I: Description of model. Journal of Hydrologic Engineering 6: 91-99 DOI 10.1061/(asce)1084-0699(2001)6:2(91)
Freeze Ra, Cherry JA (1979) Groundwater Prentice-Hall, Inc., Englewood Cliffs, United States of America
Genuchten MTV (1982) A comparison of numerical solutions of the one-dimensional unsaturated-saturated flow and mass transport equations. Advances in Water Resources 5: 47-56
Healy RW, Cook PG (2002) Using groundwater levels to estimate recharge. Hydrogeology Journal 10: 91-109 DOI 10.1007/s10040-001-0178-0
Huet M, Chesnaux R, Boucher M-A, Poirier C (2016) Comparing various approaches for assessing groundwater recharge at a regional scale in the Canadian Shield. Hydrological Sciences Journal 61 DOI 10.1080/02626667.2015.1106544 Jassas H, Merkel B (2014) Estimating Groundwater Recharge in the Semiarid
Al-Khazir Gomal Basin, North Iraq. Water 6: 2467-2481 DOI 10.3390/w6082467 Jie Z, van Heyden J, Bendel D, Barthel R (2011) Combination of soil-water balance
models and water-table fluctuation methods for evaluation and improvement of groundwater recharge calculations. Hydrogeology Journal 19: 1487-1502 DOI 10.1007/s10040-011-0772-8
Johnson AI (1967) Specific yield - compilation of specific yields of various materials Lee J-Y, Yi M-J, Hwang D (2005) Dependency of hydrologic responses and recharge
estimates on water-level monitoring within a small catchment. Geosciences journal 9: 277-287
Meinzer OE (1923) The occurrence of ground water in the United States with a discussion of principles Geological survey water-supply, Washington, pp. 373.