American Dairy Science Association, 2004.
Prediction of Daily Milk, Fat, and Protein Production
by a Random Regression Test-Day Model
P. Mayeres,1J. Stoll,2J. Bormann,1,2R. Reents,3and N. Gengler1,4
1Animal Science Unit, Gembloux Agricultural University,
B-5030 Gembloux, Belgium
2Luxembourgian Herdbook Federation (FHL),
L-9085 Ettelbruck, Luxembourg
3United Datasystems for Animal Production (VIT),
D-27283 Verden, Germany
4National Fund for Scientific Research,
B-1000 Brussels, Belgium
ABSTRACT
Test-day genetic evaluation models have many ad-vantages compared with those based on 305-d lacta-tions; however, the possible use of test-day model (TDM) results for herd management purposes has not been emphasized. The aim of this paper was to study the ability of a TDM to predict production for the next test day and for the entire lactation. Predictions of fu-ture production and detection of outliers are important factors for herd management (e.g., detection of health and management problems and compliance with quota). Because it is not possible to predict the herd-test-day (HTD) effect per se, the fixed HTD effect was split into 3 new effects: a fixed herd-test month-period effect, a fixed herd-year effect, and a random HTD ef-fect. These new effects allow the prediction of future production for improvement of herd management. Pre-dicted test-day yields were compared with observed yields, and the mean prediction error computed across herds was found to be close to zero. Predictions of perfor-mance records at the herd level were even more precise. Discarding herds enrolled in milk recording for<1 yr and animals with very few tests in the evaluation file improved correlations between predicted and observed yields at the next test day (correlation of 0.864 for milk in first-lactation cows as compared with a correlation of 0.821 with no records eliminated). Correlations with the observed 305-d production ranged from 0.575 to 1 for predictions based on 0 to 10 test-day records, respec-tively. Similar results were found for second and third lactation records for milk and milk components. These findings demonstrate the predictive ability of a TDM.
Received October 10, 2003. Accepted December 21, 2003.
Corresponding author: P. Mayeres; e-mail: mayeres.p@fsagx. ac.be.
(Key words: management, random regression, test-day yield)
Abbreviation key: BV = breeding value, HTD = herd
test day, HTY = herd test year, HTMp = herd test month period, HTDr = random HTD, PE = prediction error, PEV = PE variance, TDM = test-day model.
INTRODUCTION
Considerable effort has been applied to modeling in-dividual test-day records for genetic evaluation of dairy cattle as a replacement for the traditional 305-d lacta-tion yield. Some advantages of test-day models (TDM) include the ability to account for environmental effects occurring on the day of milk recording and the fact that they allow for variation of these effects along the lactation trajectory. In contrast to TDM, 305-d lactation models consider these effects to be constant across DIM. Milk, fat, and protein data on each test day in each herd provide all of the necessary information to determine specific effects at that date (e.g., age, pregnancy, stage of lactation factors) and to evaluate management effi-ciency on that date by accounting for a herd-test-day (HTD) effect in the model.
The benefits of TDM in genetic evaluations have been extensively investigated, whereas their usefulness for herd management purposes, though described (Meyer et al., 1989; Everett et al., 1994), has not been explored. Essentially, 2 characteristics are useful. First, TDM allow the evaluation of herd responses to management changes by adjusting records with herd-specific correc-tion factors (e.g., age, stage of lactacorrec-tion) so that any change in production is the result of feed or manage-ment modifications (e.g., change of diet nutrient con-tent). Second, TDM could allow the prediction of future yields or the extension of incomplete lactation records. Forecasting future daily yields enables a direct compar-ison between the actual and the expected performance of a cow on each test day specifically for each farm.
Such algorithms could be easily incorporated into re-cording systems. In a similar fashion, on-farm comput-ers using direct automatic milk recordcomput-ers could run such algorithms too, enabling a continuous, rapid alert-ing system for suspicious production records at the cur-rent time of recording. This could be an important deci-sion aid in the management of herds and could help to detect health problems, estrus, or nutritional imbalance affecting individual cows rapidly. Cows with suspicious production records might be looked after or treated im-mediately after milking, meeting their individual needs more precisely, thus saving on medical treatment costs and expenses caused by lost milk increasing productiv-ity in the long term.
On the herd level, daily herd production exceeding an expected value range might be an indicator for mal-functioning of milking equipment or for the existence of general health problems or a temporary global man-agement error in the milking herd. Also, projecting re-cords to the end of the milk quota year enables farmers to choose the accurate lactation length desired for the farm, to make culling and heifer replacement decisions, or to make other changes in management to match the end-of-year production. One important issue for predic-tion is the need to model time and seasonal trends by contemporary groups. Recently, Mayeres et al. (2002) showed an alternative way to achieve this. However, that study used variance components predicted on a different data set from Luxembourgian Holstein cattle with a different TDM. Also, in that study, the predictive power of the model was not tested. Therefore, the objec-tive of this paper was first to estimate the variance components for the new model and then to apply those parameters to study its ability to predict future test-day yields. Future test-test-day yields were initially esti-mated for the next test day and then accumulated into longer production periods (along the entire lactation).
MATERIALS AND METHODS Data
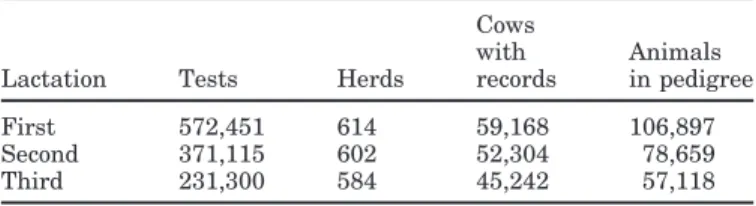
Test-day records collected in dairy herds that were members of FHL (Fe´de´ration des Herdbooks Luxem-bourgeois, Luxembourg) were supplied by VIT (Verei-nigte Informationssysteme Tierhaltung, Verden, Ger-many), which does maintenance, processing, and evalu-ation of test-day data collected in FHL herds along with German records. Files included milk, fat, and protein test-day records spanning the period from January 1990 through June 2000. Only test-day records between 4 and 330 DIM from the first 3 lactations were retained. Data structure is shown in Table 1.
To allow validation of the prediction procedure, a subset of the data prior to April 1999 was used for the
Table 1. Data structure for first, second, and third parities.
Cows
with Animals Lactation Tests Herds records in pedigree First 572,451 614 59,168 106,897 Second 371,115 602 52,304 78,659 Third 231,300 584 45,242 57,118
estimation of the solutions, which were then used to predict the remaining data.
Precorrection
Given the small size of the Luxembourgian dairy cat-tle population, milk, fat, and protein test-day yields were precorrected for age, season, and stage of lactation effects, with common lactation curves obtained from the VIT TDM used for genetic evaluations at the time of this study, a TDM with constant genetic and environ-mental effects (Reents et al., 1995, 1998):
yc= y− fˆc [1]
where ycis the corrected test-day yield, y is the mea-sured test-day yield, fˆcis the appropriated stage of lac-tation correction factor obtained for environmental classes defined by age at calving, season of calving, preceding calving interval, breed, region, and year of calving using a modified version of the polynomial re-gression approach of Ali and Schaeffer (1987).
Definition of Contemporary Groups
The contemporary group definition in TDM is often problematic, can be rather arbitrary, and frequently represents a compromise between bias and available information (Van Bebber et al., 1997). The use of fixed effects in contemporary group definitions has the ad-vantage that expected breeding value (BV) is not a function of fixed effects (Van Vleck, 1987). If random effects are used, a nonrandom utilization of sires could lead to bias in BV estimation. However, the use of fixed effects may cause problems through the occurrence of small classes, as would be the case with small herds or with seasonal calving patterns. In TDM, fixed HTD effects have been widely used since the early days of test-day modeling (Ptak and Schaeffer, 1993). This ef-fect theoretically allows unbiased comparison of ani-mals, but, for some countries, especially those with small herd size, the inclusion of an HTD effect as a contemporary group definition is not an optimal choice (Swalve, 1995). Finland uses a combination of fixed and random effects (Lidauer et al., 2000); however, other
countries use a fixed herd-year-season effect (IN-TERBULL, 2000).
Another problem with the HTD effect to meet the desired management purposes is that it is not directly useful for prediction. In fact, an HTD effect cannot be directly incorporated into algorithms used for pre-dicting future production records: it does not model any known trend and consequently is unable to predict fu-ture herd levels, as management conditions might un-expectedly have large fluctuations between 2 consecu-tive d of milk recording. To solve this problem, Mayeres et al. (2002) proposed a simple remodeling by replacing the HTD fixed effect with 3 herd-test-related effects: a fixed herd-test month-period (HTMp) effect, a fixed year (HTY) effect, and a constant random herd-test-day (HTDr) effect. The choice of these 3 effects was based on the observation of a seasonal pattern and trend in the HTD fixed effect. The sum of HTMp and HTY represents the expected production of the herd at a given test day. Even if these effects are confounded, their sum is not. The first advantage is that considering 2 fixed herd effects avoids the occurrence of small HTD classes by regrouping test-day records over certain months and years. The HTMp and HTY effects take into account the herd level and its potential seasonal trend; the HTDr effect optimally considers the particu-lar effect of the herd at test date, which is not assigned to HTMp and HTY effects. By considering HTDr as random, the solutions for the HTDr effect are regressed toward zero for the HTD classes. Second, the 2 new fixed effects (HTMp and HTY) allow the prediction of future tests without additional estimation, whereas the expected value of the random HTDr effect is assumed to have a mean of zero. Although the classical model is supposed to be unbiased, Mayeres et al. (2002) showed that the expected bias in the estimated BV caused by the new definition of contemporary groups was ex-tremely small and that nearly no re-ranking occurred. Differences between fixed HTD effects in the old model and the sum of herd test effects (HTY + HTMp + HTDr) in the new model in general were small and mostly caused by the small size of some HTD classes, where the merit of the fixed estimates of HTD is questionable. In conclusion, Mayeres et al. (2002) showed that this alternative modeling of a fixed HTD effect into 3 compo-nents to increase their usefulness for dairy herd man-agement can be done at low computing costs and gives promising results.
Model
The following single-trait, single-lactation random regression model was applied to precorrected test-day data:
yc= Um + Tt + Xb + Q(Wh + Za + p) + e [2] where m is the vector of the fixed HTMp effect; t is the vector for the HTY effect; b is the vector of the HTDr effect; h is the vector of common herd-period of calving environmental random regression coefficients; a is the vector of genetic random regression coefficients; p is the vector of permanent environmental random regression coefficients; e is the vector of residual effects; U, T, X,
W, and Z are the corresponding incidence matrices; and Q is the covariate matrix for second-order Legendre
polynomials. The common herd-period of calving envi-ronmental effect was introduced (Gengler and Wiggans, 2001) as preliminary research showed that it improved consistency of heritabilities and genetic correlations across lactation as parts of the formerly genetic (co)vari-ances were considered environmental. The common herd-period of calving effect was defined as 5 periods of calving each covering 2 yr (<April 1992, April 1992– March 1994, April 1994–March 1996, April 1996– March 1998, >March 1998). As a trait, single-lactation model was used, 3 traits in 3 single-lactations were analyzed. As explained in Mayeres et al. (2002), the HTY and HTMp effects were defined with 24 HTMp classes (defined as months in 2 time periods: January 1990 to December 1994 and January 1995 to 1999, with no regrouping of months) and 10 HTY classes (one-year classes; 1998 was grouped with 1999).
Variance Components
For variance components estimation, herds were ran-domly selected over the whole period of data to obtain approximately 100,000 test-day records. Variance com-ponents were estimated separately for milk, fat, and protein test-day data for each lactation, using expecta-tion maximizaexpecta-tion-REML as described by Gengler et al. (1999).
Computation of Predictions
Model[2] was solved for the data subset prior to April 1999, and the following linear equation used to compute predicted records:
yˆ = Umˆ + Ttˆ + Q(Whˆ + Zaˆ + pˆ ) + fˆc. [3] The HTDr effect did not appear in Eq. [3], as it models the herd specificity at a given test date, which is obvi-ously not predictable. Estimates of all other effects re-sulted directly from the solutions of Models [1] and [2]. In particular, mˆ and tˆ are the solutions from Model [2], corresponding respectively to the month of test for the last period (1995 to April 1999) and to the ongoing year
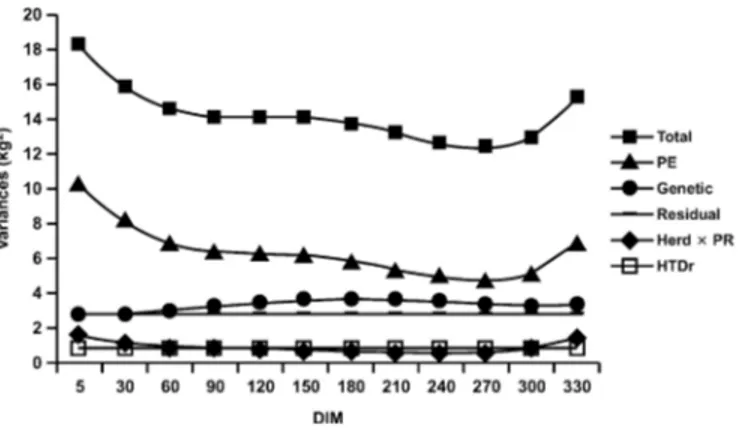
Figure 1. Variance components by DIM for first-lactation milk
yield. PE = Prediction error; HTDr = random herd-test-day effect; PR= period.
class (1998 to April 1999) for the herd whose test yield is predicted.
Validation of Prediction
This method theoretically allows the prediction of test-day yield for all possible DIM; but because only monthly milk recordings were available, predictions were restricted to the specific herd-test dates. Predic-tions were computed for test dates after April 1999, which allowed testing of predictions on a different data set than the one used for obtaining solutions.
The prediction accuracy was analyzed for all milk recordings during April 1999. The main causes of devi-ant records were studied by grouping predictions ac-cording to different criteria (e.g., number of realized tests). Prediction errors (PE = predicted yield − ob-served yield) and PE variances (PEV) were calculated to evaluate the goodness of prediction. All test-day yields were estimated for the lactations included pre-viously, and those estimates were used to calculate 305-d yiel305-ds by the test-interval metho305-d (Wiggans, 1985); lactation totals are calculated using linear interpola-tion between estimated test-day yields.
RESULTS Variance Components Estimation
Expectation maximization-REML estimates of (co)-variance components were obtained for milk, fat, and protein in the first 3 lactations. The variances of first-lactation milk by DIM are shown in Figure 1; other traits and lactations showed nearly the same shapes. Total variance was higher at the beginning and the end of the lactation. The importance of variances was in decreasing order: permanent environment, additive
ge-Table 2. Heritabilities (diagonal), genetic correlations (above
diago-nal), and phenotypic correlations (below diagonal) for milk among first lactation. DIM DIM 5 50 150 305 330 5 0.15 0.96 0.78 0.57 0.51 50 0.72 0.20 0.93 0.70 0.61 150 0.47 0.63 0.26 0.84 0.75 305 0.30 0.36 0.46 0.25 0.99 330 0.28 0.39 0.39 0.72 0.22
netic, residual, herd-period of calving and HTDr; the last two showed the same magnitude on average. A flat curve was obtained for the genetic variances, slightly increasing toward midlactation. The pooled heritability of first-lactation milk was around 0.36. The curve for permanent environment shows higher variances at ex-treme DIM, with a better fit at the middle of the lacta-tion, where the majority of the data occur. The model used assumed constant residual variances across DIM. The magnitude of variance associated with HTDr ef-fects remained rather low. Compared with residual variances, their ratio (residual divided by HTDr) was in a range of 3 to 5 for all possible trait by lactation combinations. This means that the sum of herd-test effects (HTY + HTMp + HTDr) is regressed toward HTY + HTMp according to these variance ratios. Table 2 has phenotypic and genetic correlations across DIM for first-lactation milk for DIM of 5, 50, 150, 305, and 330.
Herd Effects Definition and Prediction
To show the distribution of the number of observa-tions in contemporary effects, Table 3 presents not only the mean and the standard deviations but also the value of fifth percentile. This value is for HTD or HTDr classes equal to 1 or near 1. This fact illustrates the potential problem in the BV estimation when these classes are used as fixed effects. The use of HTMp and HTY classes
Table 3. Distribution parameters (mean, standard deviation, and
lower 5%) of the number of observations in contemporary group effects (HTD = herd test day, HTDr = random HTD, HTMp = herd test month period, and HTY = herd test year).
Effect Lactation Mean SD Lower 5% HTD/HTDr First 9.7 6.2 2 Second 7.1 4.5 1 Third 5.1 3.3 1 HTMp First 45.0 27.5 9 Second 29.6 18.7 6 Third 18.7 13.8 3 HTY First 129.8 101.7 21 Second 94.1 75.9 13 Third 67.0 56.1 7
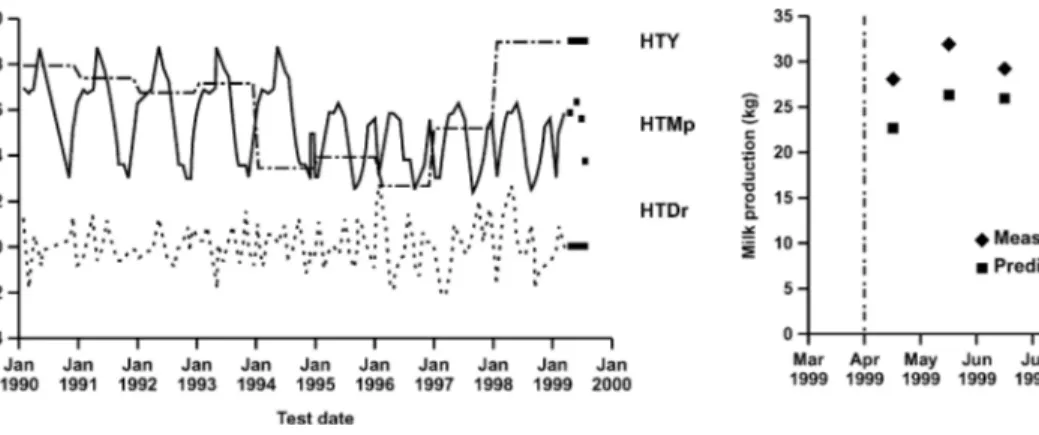
Figure 2. Herd-test-year (HTY), herd-test-month-period (HTMp),
and random HTD (HTDr) effects across time for a particular herd and prediction of these effects (䊏).
to define the fixed effects avoids the problem of small classes. Additionally, considering an HTD effect as a random effect means that for small classes, solutions are regressed toward the population mean, which is set to 0, and large herd-test-date classes are allowed to substantially deviate from that mean.
To illustrate the new herd-test effect definition and its prediction, Figure 2 depicts the solutions of HTY, HTMp, and HTDr effects for a given herd. The periodic nature of HTMp and HTY effects is clearly visible. For the HTY effect, an annual separation is noticed for this herd, except for the last 2 yr (1998 and 1999), where HTY effects remained constant. For this particular herd, important changes in herd management condi-tions probably occurred around 1994, showing undesir-able consequences in the herd production level: the HTY effect noticeably dropped in 1995, staying at a relatively low level for the next 4 yr and not recovering until 1998. To identify the cause of this discontinuity, some reference data on management would be required. For the HTMp effect, 2 periods could be distinguished: 1990 to 1994 and 1995 to 1999. The annual discontinuity, however, occurred in the same direction with a 1-yr delay as compared with the behavior of the HTY effect and did not recover toward the end of the period. Also for the HTMp, a seasonal, cyclic pattern can be detected in Figure 2, with production peaking in spring and drop-ping thereafter. The magnitude of variation within year is smaller for the second period (1995–1999). A possible explanation might be that management changes oc-curred in this herd, such as improved winter feeding practices.
Remodeling HTD as HTY, HTMp, and HTDr allows prediction of the herd level for any day of production or for any future test date by simply summing HTY and HTMp solutions for the appropriate categories of test month and test year. It is assumed that HTDr
Figure 3. Comparison between measured production (◆) and its
prediction (䊏 ) for test dates after March 1999 for a particular cow (vertical line = time limit of data used for prediction).
equals zero. Figure 2 has the prediction of the 4 tests after April 1999.
All terms of Eq. [3] may now be predicted, and predic-tions may be computed, for any cow, as presented in the previous section. Figure 3 gives an example of predicted and actual yields compared for an individual cow. For this particular animal, no test-day records were avail-able prior to April 1999, so that solutions were only based on herd effects, common factors used for precor-recting data, and the additive genetic effects being equal to the parents’ mean. With this in mind, consider-able fit still was achieved for this animal, and correla-tions between estimated and observed records were found to be 0.87. In this particular situation and be-cause our model was single lactation, permanent envi-ronmental effect was set to zero, but, in a multi-lacta-tion setting and if one tries to predict later than first lactations, this will no longer be the case.
Prediction of Future Test-Day Yields
Test-day yields were predicted for the next date of milk recording in the manner outlined in the previous section and compared with actual milk, fat, and protein yields. Because only data from a monthly milk re-cording scheme were available and, therefore, no daily records, predictions were restricted to the days of testing.
The number of predicted daily yields were 5166, 3455, and 2432 in first-, second-, and third-lactation cows, respectively. Table 4 has a comparison of predictions with the measured April yields.
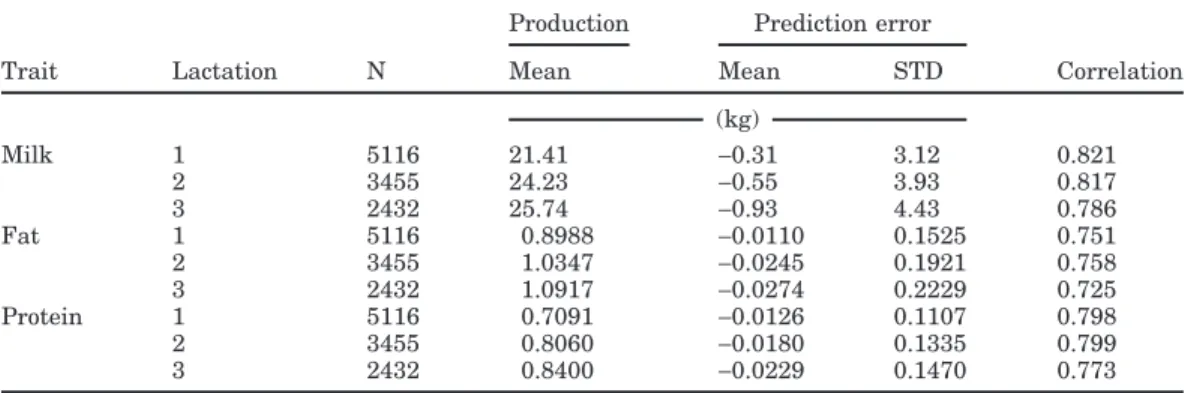
The absolute mean prediction error is close to 0, but negative in sign. This shows that, overall, the applied model is inclined to underestimate yields. Also, a some-what large range of PE standard deviations was found. By analyzing predictions and fit of data according to
Table 4. Prediction for all April 1999 test-day yields from data prior to April 1999.
Production Prediction error
Trait Lactation N Mean Mean STD Correlation (kg) Milk 1 5116 21.41 −0.31 3.12 0.821 2 3455 24.23 −0.55 3.93 0.817 3 2432 25.74 −0.93 4.43 0.786 Fat 1 5116 0.8988 −0.0110 0.1525 0.751 2 3455 1.0347 −0.0245 0.1921 0.758 3 2432 1.0917 −0.0274 0.2229 0.725 Protein 1 5116 0.7091 −0.0126 0.1107 0.798 2 3455 0.8060 −0.0180 0.1335 0.799 3 2432 0.8400 −0.0229 0.1470 0.773
different criteria, 2 main causes of deviations could be identified. First, by grouping the predictions according to the number of realized tests per herd, evidence was found that predictions are erroneous for herds tested less than a year, as HTMp effects could not be estimated correctly. Second, it may also be expected that pre-dicting yields for animals with only very few realized tests is less accurate. This assumption was supported by evaluating goodness of fit according to different cate-gories for number of tests measured per animal before April 1999. Figure 4 shows prediction accuracy for first-, second-, and third-lactation protein records.
For animals with zero or one test, correlations were found to be low, as expected. However, the last category of animals (animals with no yield records) underlines the advantage of developing a TDM as a prediction tool. Such a TDM allows predictions for animals with information coming only from herd, population, and genealogy. This advantage might be exploited
when-Figure 4. Correlation between real and predicted values for
pro-tein in first (◆), second (▲), and third (䊏) lactation by number of tests realized on the animal before April 1999.
ever heifer replacement decisions need to be made. Farmers might not only choose heifers based on ex-pected BV of their parents, but on exex-pected first-lacta-tion yield, thereby taking into account other effects that affect future production of the milking cow (e.g., age at first calving effects). Table 5 contains PE means, standard deviations, and correlations between pre-dicted and measured records for animals with no test before April 1999.
Given the amount of available information, the corre-lations were reasonably high. Discarding herds with<1 yr of milk recording and animals with only few records, mean PE were found to be even closer to zero with lower variance. For example, for first-lactation milk, mean PE was found to be−0.10 kg with a standard deviation of 2.71 kg and a correlation of 0.864 between predicted and actual records instead of −0.31, 3.12, and 0.821, respectively. Some deviations are still important, which can be attributed to a certain amount of unexpected yield at the animal level (e.g., health disorders or estrus on test date) or at the herd level (e.g., occasionally, great influence of herd test date not accounted for by HTY or HTMp effects). To study the relationship be-tween individual deviations and herd deviations, mean
Table 5. Prediction error mean and standard deviation and
correla-tion between prediccorrela-tion and measured produccorrela-tion for animals without tests before April 1999.
Prediction error
Trait Lactation Mean SD Correlation (kg) Milk 1 0.85 0.54 0.64 2 2.04 0.82 0.671 3 1.47 0.80 0.572 Fat 1 0.0081 0.2337 0.569 2 0.0533 0.2810 0.651 3 0.0449 0.3327 0.598 Protein 1 0.0293 0.1423 0.641 2 0.0620 0.1853 0.678 3 0.0511 0.2106 0.584
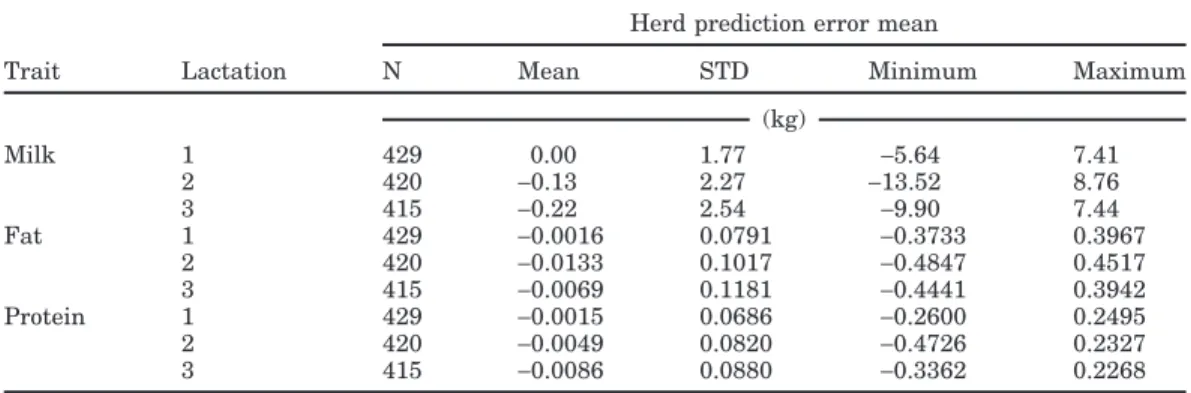
Table 6. Characteristics of herd mean prediction error.
Herd prediction error mean
Trait Lactation N Mean STD Minimum Maximum (kg) Milk 1 429 0.00 1.77 −5.64 7.41 2 420 −0.13 2.27 −13.52 8.76 3 415 −0.22 2.54 −9.90 7.44 Fat 1 429 −0.0016 0.0791 −0.3733 0.3967 2 420 −0.0133 0.1017 −0.4847 0.4517 3 415 −0.0069 0.1181 −0.4441 0.3942 Protein 1 429 −0.0015 0.0686 −0.2600 0.2495 2 420 −0.0049 0.0820 −0.4726 0.2327 3 415 −0.0086 0.0880 −0.3362 0.2268
PE were computed for each herd. Results are shown in Table 6.
Mean PE calculated within herds were again very close to zero on average, meaning that within-herd com-pensations occurred. In general, underestimation of part of the records was compensated by over-evaluating other records. Looking at extremely deviant estimates, it was found that the problems sometimes occurred at the herd level, as deviations were noticed for each tested animal in that herd, which might be an indicator of changes in management, affecting the entire herd (e.g., changing feeding system).
Lactation Prediction
For herd test dates occurring after April 1999, predic-tions were computed for the remainder of the lactation of each cow that calved before April 1999 and for cows with lactations only begun after April 1999. The test interval method was applied separately for combining predicted and actual records into 305-d lactation val-ues. This approach was far from optimal, but it was a simple strategy to give initial indication of the long-term predictive ability of the model. Table 7 summa-rizes results from 305-d predictions for all traits and lactations relative to the number of realized tests per animal.
Similar to the study of the goodness of fit when esti-mating test-day yield, at the lactation level, only rela-tively low correlations between predicted and observed lactations and high PE were found for animals without tests. Correlations steadily improved with increasing information, becoming close to 1 when data were avail-able from 10 milk recordings. However, the mean PE is still negative in sign, showing again the general fea-ture of this model to underestimate yields. Compared with traditional methods such as multiple-trait predic-tion (Schaeffer and Jamrozik, 1996), results in our study based on a single-trait, single-lactation TDM are very promising. However, to judge the real advantage
of this method, a direct comparison with multiple-trait prediction or best prediction methodology (VanRaden, 1997) should be performed on the same data set.
DISCUSSION
The objective of this study was to show that with a simple remodeling of a TDM, some new tools could be easily developed for management use. In addition to the usual information generated by genetic evaluation models, this model allows the direct prediction of milk and milk component production. The results presented in this study showed the power of a modified TDM to predict directly with reasonable accuracy. Our research identified some problems, and some improvements are needed. Alternative ways to model time and seasonal trends in a given herd could be necessary. As a matter of fact, time trends tended to be underestimated in the last years, showing negative PE. Therefore, the use of linear regressions in the definition of the HTY effect at least would allow these generally observed underesti-mations to be avoided. A closer look at the definition of periods for the HTMp effect would also be important. The possible use of methods based on Kalman filter theory (Van Bebber et al, 1999) would allow a herd-specific period definition of the HTMp effect. Predic-tions in later lactaPredic-tions would benefit from a simultane-ous multiple-trait, multiple-lactation modeling ap-proach.
Even with the best model possible, many predictions will still differ from the observed production. However, this will be one of the benefits of a model used for predictions. Identifying suspect production records by direct comparison with their expectations and identi-fying the problem at the animal or herd level will be the next step. Consequently, the validation of such a forecasting tool will require direct comparison with the happenings in the field. Reliable field recording is essen-tial, as reference data on individual animal health or on herd management will be required to link the observed
Table 7. 305-d prediction analysis (in kg) by number of tests realized on the animal before April 1999 (PE = prediction error = predicted yield − observed yield). Milk Fat Protein PE PE PE Test Animals Yield Mean SD Correlation Yield Mean SD Correlation Yield Mean SD Correlation First lactation 0 425 6274.5 − 68.8 1203.0 0.575 253.84 1.260 49.320 0.569 207.20 − 2.397 38.748 0.599 1 490 6247.3 − 16.5 905.4 0.772 253.95 − 2.455 37.600 0.760 206.23 − 1.445 31.147 0.784 2 523 6204.4 26.2 720.1 0.842 251.36 − 2.140 30.464 0.823 206.21 − 1.018 24.881 0.824 3 664 6449.9 − 127.2 735.6 0.875 261.93 − 3.914 30.609 0.854 213.87 − 5.663 25.591 0.853 4 550 6444.0 − 46.6 530.9 0.925 266.81 − 0.296 21.772 0.921 214.83 − 1.525 19.148 0.904 5 596 6483.1 − 90.8 366.9 0.963 270.29 − 1.933 15.675 0.958 215.82 − 2.368 13.337 0.953 6 597 6496.0 − 83.8 318.4 0.970 272.11 − 2.607 13.550 0.968 219.25 − 2.389 11.099 0.967 7 561 6487.5 − 46.9 206.3 0.985 272.00 − 1.324 8.806 0.985 219.34 − 1.559 7.693 0.981 8 229 6224.2 − 8.7 158.7 0.992 263.63 − 0.092 7.007 0.991 212.87 − 0.482 5.975 0.990 9 177 6248.9 − 7.6 75.9 0.998 264.24 − 0.689 4.376 0.997 211.45 − 0.407 2.783 0.998 10 109 6353.1 − 3.0 40.8 1.000 262.41 − 0.061 2.369 0.999 213.93 − 0.063 1.531 0.999 Second lactation 0 353 7053.6 − 344.1 1354.5 0.654 290.01 − 9.007 54.607 0.665 236.36 − 9.416 43.277 0.664 1 337 7079.0 − 126.3 1240.6 0.763 294.56 − 7.734 52.879 0.753 236.35 − 3.284 39.744 0.758 2 400 7338.3 50.0 858.4 0.878 303.74 − 0.824 37.251 0.852 246.37 − 0.986 29.014 0.848 3 475 7176.4 − 111.4 812.9 0.900 299.09 − 3.122 34.830 0.873 240.84 − 4.317 27.294 0.881 4 374 7211.1 − 131.2 631.4 0.925 298.51 − 2.879 26.816 0.910 242.05 − 3.469 21.886 0.906 5 376 7074.1 − 174.5 480.2 0.956 299.68 − 4.163 21.144 0.949 240.03 − 5.117 16.808 0.949 6 322 7043.9 − 92.9 317.0 0.981 302.25 − 3.485 15.237 0.976 241.31 − 3.200 11.374 0.979 7 280 6759.7 − 47.0 244.5 0.990 291.82 − 2.800 11.416 0.987 234.06 − 1.732 8.517 0.988 8 234 6923.7 0.4 167.6 0.994 295.28 − 0.872 8.010 0.992 240.68 − 0.144 5.783 0.994 9 133 7148.7 − 15.4 90.5 0.998 305.21 − 1.352 5.430 0.997 246.32 − 0.491 3.314 0.998 10 60 7268.3 − 11.8 44.2 1.000 307.29 − 0.882 3.196 0.999 250.15 − 0.500 1.723 1.000 Third lactation 0 302 7392.2 − 255.4 1500.0 0.639 304.29 − 6.881 61.069 0.631 245.13 − 8.144 49.452 0.624 1 312 7310.2 − 85.1 1124.8 0.781 299.74 − 6.586 47.911 0.796 240.93 − 1.346 37.215 0.768 2 232 7557.9 − 9.3 891.8 0.870 312.45 0.603 43.499 0.818 248.30 − 2.059 30.866 0.843 3 313 7634.3 − 88.5 873.1 0.886 315.86 − 2.623 38.930 0.867 251.39 − 4.762 30.115 0.866 4 244 7753.8 − 227.4 750.5 0.899 321.50 − 5.393 32.269 0.888 257.92 − 7.764 25.399 0.879 5 229 7683.8 − 190.3 545.0 0.946 325.31 − 4.947 23.924 0.942 257.24 − 5.835 19.069 0.934 6 186 7689.3 − 60.3 385.5 0.974 325.20 − 0.925 18.373 0.966 257.78 − 2.175 13.437 0.969 7 201 7135.3 − 26.5 299.3 0.984 307.46 − 1.797 12.823 0.983 243.08 − 1.609 10.238 0.982 8 174 7267.8 − 31.6 181.9 0.993 314.44 − 1.651 8.067 0.993 248.42 − 1.449 6.247 0.992 9 106 7604.4 − 28.7 101.3 0.998 320.33 − 1.676 5.911 0.997 256.68 − 0.966 3.469 0.998 10 58 7611.9 − 18.8 41.7 1.000 328.69 − 1.331 3.481 0.999 262.08 − 0.623 1.548 1.000
deviations either to modeling problems or to herd or cow problems. The global objective will be to detect problems for a single animal, for groups of animals, or for the entire herd immediately after milking. Also, rerunning the model shortly after milk recording will supply solutions for HTDr effects. These solutions allow detection of herd problems at the last milk test. If its value is significantly different from zero, all animals must have deviated in the same way, and this informa-tion may be passed on to the farmer for management de-cisions.
The peculiarity of this model is the consideration of herd individual effects, which increases computational demands. An interesting approach is to apply this kind of model on a sublevel of population-wide BV estima-tion. This submodel could import information from pop-ulation-wide BV estimation to facilitate computations (e.g., precorrection of data for environmental effects, additive genetic effects) and could be launched at short intervals with monthly, weekly, or even daily updates, as required for management purposes.
ACKNOWLEDGMENTS
Nicolas Gengler, who is Research Associate of the National Fund for Scientific Research (Brussels, Bel-gium), acknowledges its financial support and the facili-tation of compufacili-tations through Grant 2.4.507.02 F (2). The authors gratefully acknowledge the financial sup-port of the Luxembourgian Herdbook Federation, a breeders cooperative, and manuscript reviews by Alain Gillon (Gembloux Agricultural University, Belgium) and George Wiggans (Animal Improvement Programs Laboratory, ARS, USDA, Beltsville, MD).
REFERENCES
Ali, T. E., and L. R. Schaeffer. 1987. Accounting for covariances among test-day milk yield in dairy cows. Can. J. Anim. Sci. 67:637–644. Everett, R. W., F. Schmitz, and L. H. Wadell. 1994. A test day model for monitoring management and genetics in dairy cattle. J. Dairy Sci. 77(Suppl. 1):267. (Abstr.)
Gengler, N., A. Tijani, G. R. Wiggans, and I. Misztal. 1999. Estimation of (co)variance function coefficient for test day yield with expecta-tion-maximization restricted maximum likelihood algorithm. J. Dairy Sci. 82:225. [Online.] Available: http://www.adsa.org/ manuscripts/8436e/.
Gengler, N., and G. R. Wiggans. 2001. Variance of effects of lactation stage within herd by herd yield. J. Dairy Sci. 84(Suppl. 1):216. (Abstr. 896)
INTERBULL. 2000. National genetic evaluations programs for dairy production traits practised in INTERBULL member countries 1999-2000. INTERBULL Bulletin 24. Upsala, Sweden. Available: http://www-interbull.slu.se/bulletins/framesida-pub.htm. Lidauer, M., E. A. Ma¨ntysaary, I. Stranden, and J. Po¨so¨. 2000.
Multi-ple-trait random regression test-day model for all lactations. IN-TERBULL Bulletin 25:81–87. Available: http://www-interbull.-slu.se/bulletins/framesida-pub.htm.
Mayeres, P., J. Stoll, R. Reents, and N. Gengler 2002. Alternative modeling of fixed effects in test day model to increase their use-fulness for management decisions. INTERBULL Bulletin 29:128– 132. Available: http://www-interbull.slu.se/bulletins/framesida-pub.htm.
Meyer, K., H.-U. Graser, and K. Hammond. 1989. Estimates of genetic parameters for first lactation test day production of Australian Black and White cows. Livest. Prod. Sci. 21:177–199.
Ptak, E., and L. R. Schaeffer. 1993. Use of test day yields for genetic evaluation of dairy sires and cows. Livest. Prod. Sci. 34:23–34. Reents, R., J. C. M. Dekkers, and L. R. Schaeffer 1995. Genetic
evaluation for somatic cell score with a test day model for multiple lactations. J. Dairy Sci. 78:2858–2870.
Reents, R., L. Dopp, M. Schmutz, and F. Reinhardt. 1998. Impact of application of a test-day model to dairy production traits on ge-netic evaluation of cows. INTERBULL Bulletin 17:49–54. Avail-able: http://www-interbull.slu.se/bulletins/framesida-pub.htm. Schaeffer, L. R., and J. Jamrozik. 1996. Multiple-trait prediction of
lactation yields for dairy cows. J. Dairy Sci. 79:2044–2055. Swalve, H. H. 1995. The effect of test day models on the estimation
of genetic parameters and breeding values for dairy yield traits. J. Dairy Sci. 78:929–938.
Van Bebber, J., N. Reinsch, W. Junge, and E. Kalm. 1997. Accounting for herd, year and season effects in genetic evaluations of dairy cattle: A review. Livest. Prod. Sci. 51:191–203.
Van Bebber, J., N. Reinsch, W. Junge, and E. Kalm. 1999. Monitoring daily milk yields with a recursive test day repeatability model (Kalman Filter). J. Dairy Sci. 82:2421–2429.
VanRaden, P. 1997. Lactation yields and accuracies computed from test day yields and (co)variances by best prediction . J. Dairy Sci. 80:3015–3022.
Van Vleck, L. D. 1987. Contemporary groups for genetic evaluations. J. Dairy Sci. 70:2456–2464.
Wiggans, G. R. 1985. Procedures for calculating lactation records. Natl Coop. Dairy Herd Improvement Handbook. Fact Sheet G-1, p.10. Ext. Serv., USDA, Washington, DC.