JANSSEN PHILIPPE
INFLUENCE DE L’HÉTÉROGÉNÉITÉ DE
L’HABITAT SUR LA RICHESSE SPÉCIFIQUE DES
COLÉOPTÈRES EN FORÊT BORÉALE
Mémoire présenté
à la Faculté des études supérieures de l’Université Laval dans le cadre du programme de maîtrise en biologie pour l’obtention du grade de Maître ès sciences (M.Sc.)
DÉPARTEMENT DE BIOLOGIE FACULTÉ DES SCIENCES ET DE GÉNIE
UNIVERSITÉ LAVAL QUÉBEC
2008
Résumé
Cette étude visait à évaluer la relation entre la richesse des coléoptères et l’hétérogénéité compositionnelle et structurale de l’habitat, caractérisée à plusieurs échelles spatiales. Aux étés 2004 et 2005, 70 peuplements de la forêt boréale de la Côte-Nord du Québec ont été échantillonnées. Globalement, 133 espèces de coléoptères ont été capturées au sol par pièges fosse et 251 espèces dans les airs par pièges à impact. L’influence du type d’hétérogénéité et de l’échelle spatiale variait entre ces deux groupes de coléoptères. L’hétérogénéité compositionnelle, évaluée à l’échelle du peuplement, expliquait le mieux les variations spatiales de richesse des coléoptères terricoles, alors que c’était plutôt l’influence conjointe de l’hétérogénéité structurale et compositionnelle évaluée aux échelles du peuplement et du paysage qui expliquait le mieux les variations spatiales de richesse des coléoptères volants. L’étude démontre l’importance de considérer plusieurs composantes de l’hétérogénéité et plusieurs échelles spatiales pour la compréhension des patrons de biodiversité.
iii
Abstract
The main objective of this study was to establish the relationship between beetle species richness and compositional and structural heterogeneity characterized at multiple spatial scales. During the summers of 2004 and 2005, 70 stands of the boreal forest of the North shore region of Québec were sampled. Overall, 133 ground-dwelling beetle species and 251 flying species were captured using pitfall and flight interception traps. The influence of the type of heterogeneity and the spatial scale varied between the two groups of beetles. Compositional heterogeneity evaluated at the stand scale best explained spatial variations in ground-dwelling beetle richness, whereas it was the joint influence of structural and compositional heterogeneity at both stand and landscape scales that best explained spatial variations in flying beetle richness. The study outlines the importance of considering several components of heterogeneity and multiple spatial scales to better understand of biodiversity patterns.
Avant-Propos
Ce mémoire est constitué d'un chapitre rédigé en anglais qui a été soumis pour publication ainsi que d'une introduction et d’une conclusion générale écrites en français. Les coauteurs de l’article, Daniel Fortin et Christian Hébert, ont contribué à l’élaboration de l'étude, de même qu’à la rédaction et la révision des textes de ce mémoire.
Avant tout, je tiens à remercier chaleureusement mon directeur, Daniel Fortin, pour sa contribution active et efficace dans la supervision de ma maîtrise. Ses conseils ont toujours été pertinents et son expertise scientifique m’a permis de pousser les limites de la rigueur toujours plus loin. Avec du recul et quand je regarde les résultats obtenus après ces deux années de travail, je prends conscience des progrès personnels que j’ai accomplis et des compétences que j’ai acquises. Beaucoup en sont dus à Daniel.
Je voudrais également remercier Christian Hébert, mon codirecteur et représentant du côté entomologique de ma maîtrise. Ses connaissances, son expertise en entomologie et en écologie forestière ainsi que sa vision davantage tournée vers l’applicabilité des résultats de la recherche pour le gestionnaire, ont fait qu’il a été pour moi un codirecteur essentiel, en parfaite complémentarité avec mon directeur. Je le remercie également pour sa disponibilité, son écoute et l’importance qu’il accorde aux échanges d’idées dans son laboratoire.
Un grand merci à Georges Pelletier, taxonomiste au Centre de Foresterie des Laurentides, sans l’aide duquel je serais encore derrière mon microscope à compter les poils en bordure du pronotum d’une petite bête de moins de 5 mm. Après une année à identifier des coléoptères, j’ai compris que j’avais atteint ma limite de saturation, Georges pousse les limites beaucoup plus loin et transmet toujours avec passion ses connaissances. Je lui dois énormément et notamment la modeste expertise que j’ai développé en identification.
Merci à Carole Germain, jeune retraitée du CFL, et Yves Dubuc, désormais technicien solitaire du laboratoire de Christian, pour leur aide au quotidien dans la gestion des données, des étiquettes, des spécimens, du matériel, de l’entreposage… Bref des affaires qui peuvent vite s’entremêler et se perdent quand on étudie des groupes d’espèces
v diversifiés et abondants comme les coléoptères. Merci à Sophie Brugerolle, Guillaume Côté, Jérôme Lemaître et Isabelle Plante pour la mise en place du dispositif expérimental ainsi que pour la collecte des données. Merci à Marie-André Boisvert pour les longues journées passé à trier les échantillons, à saisir les données et à confectionner les étiquettes. Merci à David Pothier et Stéphane Boudreau pour avoir accepté d’être sur mon comité d’évaluation et ainsi accepter une charge de travail supplémentaire à leur agenda, qui je n’en doute pas, devait déjà être bien rempli.
Enfin, merci aux membres des laboratoires de Daniel Fortin : Ermias Azeria, Jean-Sébastien Babin, Guillaume Bastille-Rousseau, Sabrina Courant, Nicolas Courbin, Karine Dancose, Pierre Etcheverry, James Hodson, Mélina Houle, Cheryl Johnson, Mélanie Leblanc, Jérôme Lemaître, David Pinaud, Kim Poitras, et de Christian Hébert : Sébastien Bélanger, Richard Berthiaume, Jonathan Boucher, Pierre-Marc Brousseau, Éric Domaine, Jean-Philippe Légaré, pour les conseils de certains, les idées des autres et plus généralement pour les moments partagés, le congrès de la SEQ en est, je pense, un bon exemple.
Table des matières
Résumé... ii
Abstract... iii
Avant-Propos ...iv
Table des matières ...vi
Liste des tableaux...1
Liste des figures ...2
INTRODUCTION GÉNÉRALE ...3
Le concept d’hétérogénéité de l’habitat...4
Mesurer l’hétérogénéité de l’habitat… ...4
…une question d’échelle ...5
Universalité du concept d’hétérogénéité de l’habitat?...6
Territoire d’étude : La forêt boréale de la Côte-Nord du Québec ...7
Modèle d’étude : les coléoptères ...8
Relier l’hétérogénéité et les coléoptères dans la forêt boréale...9
Objectif de l’étude ...10
Méthodologie ...10
BEETLE DIVERSITY IN OLD-GROWTH BOREAL FORESTS: INFLUENCE OF HABITAT HETEROGENEITY AT MULTIPLE SCALES...12
Abstract...13
Introduction...14
Materials and Methods...16
Study area ...16
Insect sampling ...17
Characterisation of sampling sites ...18
Heterogeneity indices and environmental variables ...19
Statistical analyses ...22
Results...24
vii
Species richness of ground-dwelling beetles ...25
Species richness of flying beetles ...27
Beetles richness and types of heterogeneity ...30
Beetles richness and scales of heterogeneity ...31
Discussion...32
Acknowledgements...35
CONCLUSION GÉNÉRALE...36
Le concept d’hétérogénéité de l’habitat...36
Influence des coupes forestières dans le paysage ...37
Diversité des coléoptères et représentativité de notre échantillonnage ...38
Enseignements et pratiques de gestion durables...39
Perspectives d’avenir ...39
Bibliographie ...41
Annexe 1 ...50
Annexe 2 ...53
Liste des tableaux
Table 1. Repartition of sampling sites among stand type and age, according to the ecoforest maps of the Ministère des Ressources Naturelles et de la Faune du Québec, in the old-growth boreal forest of the North Shore region of Québec, Canada. ...17 Table 2. Description of stand and landscape variables used to model beetle richness in
old-growth boreal forests of the North-Shore region of Québec, Canada. ...21 Table 3. The 10 top-ranking models among 61 models (see Appendix 1) predicting richness of ground-dwelling beetles in 70 stands of old-growth boreal forests, as assessed with Akaike’s Information Criterion corrected for small sample size (AICc). Number of
estimated parameters including the intercept (K), AICc, the difference in AICc
(ΔAICc), and ...26
Table 4. The 10 top-ranking models among 61 models (see Appendix 1) predicting richness of flying beetles in 70 stands of old-growth boreal forests, as assessed with Akaike’s Information Criterion corrected for small sample size (AICc). Number of estimated
parameters including the intercept (K), AICc, the difference in AICc (ΔAICc), and
AICc weight (w) are provided. ...28
Table 5. Average coefficients and confidence intervals (CI) for each variable of the 12 most parsimonious models predicting richness of ground-dwelling beetles (first 10 provided in Table 3) and each variable of the 27 most parsimonious models (first 10 provided in Table 4) predicting richness of flying beetles in old-growth boreal forests of the North-Shore region of Québec, Canada. Bold character indicates variables excluding 0 of the 95% confidence interval. ...29
2
Liste des figures
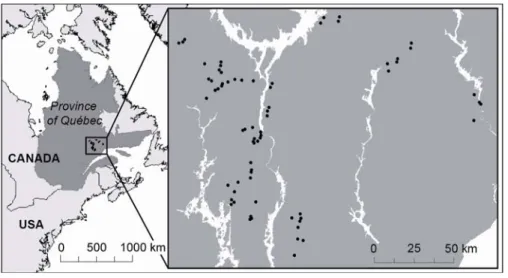
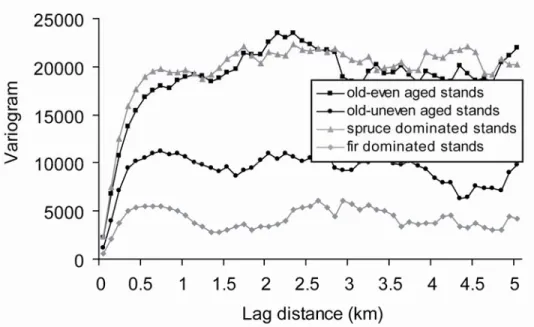
Figure 1. Study area and distribution of sampling sites in the old-growth boreal forest of the North Shore region of Québec, Canada. ...16 Figure 2. Variogram estimated for four vegetation cover classes in the boreal forest of the North Shore region of Québec, Canada. ...24 Figure 3. Influence of types of habitat heterogeneity on the richness of ground-dwelling and flying beetles in old-growth boreal forests. Sums of AICc weights are provided for models based exclusively on compositional variables, on structural variables or on both types of variables. ...30 Figure 4. Influence of heterogeneity estimated at different spatial scales on the richness of ground-dwelling and flying beetles in old-growth boreal forests. Sum of AICc weights are provided for models based exclusively on stand variables, on landscape variables or on variables estimated at both scales. The hatched bar indicates the relative contribution of models including variables measured at 400 m and 800 m radii, within models including stand and landscape variables and models including exclusively landscape variables. ...31
INTRODUCTION GÉNÉRALE
Avec l’émergence des notions de biodiversité et de développement durable, les pratiques de gestion ont évolué vers une plus grande prise en compte des diverses fonctions des écosystèmes. En milieu forestier, la conservation de la biodiversité est reconnue comme l’un des enjeux majeurs (e.g. Conseil Canadien des Ministres des Forêts 1995, 2003, Coalition pour la Stratégie Nationale sur les Forêts 1998, 2003, Ministère des Ressources Naturelles 1996, Nilsson et al. 2001) et a été entérinée par l’adoption du Processus de Montréal en 1994 ainsi que par la définition de critères et d’indicateurs pour l’aménagement durable des forêts (CCMF 1995, 2003). Cet intérêt pour la biodiversité s’exprime également à travers les biens et services rendus, dans le sens où les caractéristiques fonctionnelles des organismes, les variations spatio-temporelles dans leur répartition et leur abondance influencent la fonctionnalité des écosystèmes (Hooper et al. 2005). Dans ce cadre et par souci d’évaluation des impacts liés à l’exploitation des forêts naturelles, un des préalables consiste en une caractérisation du milieu naturel. Cette caractérisation passe par l’acquisition d’un ensemble de connaissances relatives au lien existant entre les attributs originels du peuplement et les patrons de biodiversité.
La biodiversité est influencée par différents facteurs ou processus qui, selon leur amplitude, peuvent expliquer des patrons distincts de répartition des espèces. En forêt, l’hétérogénéité est créée, maintenue et accentuée par des processus agissant dans le temps (Smith et al. 1993), comme c’est le cas avec les phénomènes de perturbations et de successions. La variabilité spatio-temporelle de ces processus engendre un mélange des essences et forme des peuplements (Kuuluvainen 2002). Comprendre l’organisation de la biodiversité en forêt implique donc de prendre en considération les spécificités induites par l’hétérogénéité afin de caractériser les patrons de répartition des organismes et l’influence de la variabilité des attributs des peuplements sur la diversité biologique.
4
Le concept d’hétérogénéité de l’habitat
«L’hypothèse de l’hétérogénéité de l’habitat » (MacArthur et MacArthur 1961) apparaît être particulièrement pertinente pour expliquer la diversification de la composition taxonomique en fonction des attributs de l’habitat. Ce concept stipule qu’une augmentation de la diversité des habitats peut mener à une augmentation de la diversité spécifique. Aussi, on entendra par habitat, l’ensemble des ressources et des conditions présentes au sein d’une aire et qui permettent à une espèce d’occuper l’espace (Hall et al. 1997).
L’hypothèse de l’hétérogénéité de l’habitat constitue une pierre angulaire en écologie (MacArthur et Wilson 2001) et représente probablement le concept fondamental le plus important du paradigme contemporain pour la gestion des écosystèmes et la biologie de la conservation (Kolasa et Pickett 1991, Dutilleul et Legendre 1993, Pickett et al. 1997, Spies et Turner 1999). L’hétérogénéité intègre toutes les formes de variations des composantes environnementales, intervenant dans le temps et l’espace (Ostfeld et al. 1997). En ce sens, l’hétérogénéité influence la structure et la dynamique des communautés écologiques (Kolasa et Pickett 1991, Tilman 1994). Les habitats complexes auront ainsi généralement tendance à fournir une plus grande gamme de ressources environnementales (Loucks 1970, Grime 1973, Bazzaz 1975). Cette complexité de l’habitat constitue une source d’opportunités pour la colonisation, la reproduction et la survie des organismes et permet l’accueil de tout un éventail d’espèces (Kuuluvainen 2002). Il en résulte souvent une augmentation de la biodiversité des écosystèmes terrestres et aquatiques (MacArthur et MacArthur 1961, Downing 1991, Huston 1994).
Mesurer l’hétérogénéité de l’habitat…
Ce sont fréquemment les communautés végétales qui déterminent la structure physique des habitats, donc qui influencent la distribution et les interactions entre les espèces animales (Lawton 1983, McCoy et Bell, 1991). En milieu forestier, de nombreuses études ont mis en évidences l’influence de la couverture arborée sur le microclimat du peuplement (Chen et al. 1999), la diversité de la végétation au sol (Pitkänen 1997), les processus de décomposition (Packham et al. 1992) et le cycle des nutriments (Prescott 2002). En forêt
boréale, Esseen et al. (1992) ont montré que les arbres vivants et morts constituent les composantes structurales principales des habitats de la faune et de la flore.
Les communautés végétales forestières sont habituellement décrites à travers des attributs de composition et de structure (Noss 1990, Franklin et al. 2002). L’hétérogénéité intervient lorsque l’un ou l’autre de ces attributs varie dans le temps ou dans l’espace (Li and Reynolds 1995, Franklin and Van Pelt 2004). Aussi, en quantifiant distinctement les composantes associées à la structure et à la composition forestières, et en les reliant à la diversité faunistique du peuplement, il est possible de mettre en évidence le rôle fonctionnel de l’hétérogénéité sur la biodiversité. Dans ce sens, MacArthur et MacArthur (1961) ont montré que la distribution verticale du feuillage était plus importante que la composition en espèces de plantes pour la diversité de l’avifaune forestière. De même, l’importance de la diversité structurale des habitats a permis d’expliquer les patrons d’abondance et de diversité des arthropodes de la strate supérieure du sapin de Douglas, Pseudotsuga menziesii (Mirb.) Franco (Halaj et al. 2000).
…une question d’échelle
Comprendre la relation entre un groupe d’espèces et les attributs d’un écosystème implique de considérer des éléments relatifs à l’écologie des espèces étudiées. Dépendamment de la taille du domaine vital et des besoins en nourriture, la réponse des espèces à des attributs spécifiques de l’hétérogénéité environnementale divergera (e.g. Boyce et al. 2003, Fortin et al. 2003). On comprend que l'hétérogénéité sera perçue différemment suivant le groupe d’organismes considéré (Harmon et al. 1986, Wiens 1994, Tews et al. 2004). Une pelouse constitue une salade verte pour un mouton et un univers complexe pour un insecte (Huston, 1994). Cette distinction implique le choix d’une échelle spatiale en cohérence avec la perception que le modèle d’étude peut avoir de son environnement, ce qui sollicite le choix de variables descriptives appropriées (Tews et al. 2004).
Les besoins d’une espèce en termes de reproduction et de survie sont souvent associés à des attributs intervenant à une échelle spécifique (Tews et al. 2004). D’un autre côté, il a été montré pour de nombreuses espèces que c’est davantage la combinaison d’attributs agissant à plusieurs échelles qui explique les patrons de répartition (e.g. Hastings 1990, Kie et al.
6 2002, Williams et al. 2002). Dans ce sens, l’hétérogénéité est considérée comme un phénomène agissant à plusieurs échelles spatiales (Kolasa et Pickett 1991) et son étude implique la sélection de groupes de variables adaptés non seulement au modèle d’étude, mais également aux échelles spatiales pertinentes. La nécessité de considérer plusieurs échelles est d’autant plus vraie dans le cadre d’études portant sur plusieurs espèces car celles-ci peuvent répondre à l’hétérogénéité de l’habitat à différentes échelles. Il est ainsi globalement admis que l’étude des patrons de biodiversité devrait inclure au moins deux échelles spatiales (e.g. Niemelä et al. 1996, Mitchell et al. 2001, Holland et al. 2005).
Richesse en espèces animales et hétérogénéité de l’habitat
Bien que la plupart des études ait montré une augmentation de la richesse spécifique avec l’hétérogénéité de l’habitat, certaines études ont mis en évidence une diminution de cette même richesse (revue dans Tews et al. 2004). C’est le cas par exemple pour des groupes taxonomiques aussi variés que les mammifères (August 1983, Sullivan et Sullivan 2001), les oiseaux (Ralph 1985) ou bien encore les papillons (Hill et al. 1995). Par ailleurs, une influence positive de l’hétérogénéité de l’habitat sur la richesse spécifique de ces mêmes groupes faunistiques a également été mise en évidence (e.g. Debinski and Brussard 1994, Ecke et al. 2002). D’ailleurs, environ 15% des 85 études revues par Tews et al. (2004) présentaient des résultats contradictoires. Ces résultats étaient parfois expliqués par le choix arbitraire des paramètres structuraux de la végétation en rapport avec le groupe d’espèces étudié (Tews et al. 2004). Dans ce sens, Sullivan and Sullivan (2001) ont montré que la diversité en espèces de mammifères forestiers terricoles était plus forte dans les dispositifs de coupes que dans les forêts non aménagées. Ces dernières présentaient pourtant une plus grande diversité structurale, mesurée par un indice combinant la surface terrière, la densité et le pourcentage de couverture des arbres et du bois mort. Ainsi, si le choix des paramètres structuraux de la végétation avait été en relation avec l’hétérogénéité de la couverture au sol, les résultats auraient sans doute permis d’illustrer la plus grande diversité structurale des dispositifs de coupes, comparativement aux forêts non aménagées (Tews et al. 2004). Aussi, la nuance entre un habitat hétérogène et un habitat fragmenté est fonction de ce que le groupe d’espèces perçoit comme un habitat, donc de l’échelle spatiale. Par exemple, alors que les chablis en forêt augmentent l’hétérogénéité de l’habitat pour les papillons
(Spitzer et al. 1997), ils peuvent fragmenter l’habitat des carabes des forêts fermées (Rainio et Niemela 2003). Dans ce sens, l’hétérogénéité sera davantage exprimée par la diversité des paramètres de végétation mesurée à l’intérieur des limites de ce qui constitue l’habitat d’un groupe d’espèces donné (Tews et al. 2004). La prise en compte des paramètres structuraux de la végétation à échelles étendues induira donc la considération d’une plus grande diversité d’habitat, pas nécessairement en relation avec la diversité des espèces échantillonnée localement, exprimée par exemple par le rayon d’attractivité des pièges.
Territoire d’étude : La forêt boréale de la Côte-Nord du Québec
La forêt boréale forme une ceinture s’étendant de l’Amérique du Nord à la Russie, en passant par la Scandinavie. Elle constitue l’un des plus grands biomes au monde (Haila 1994, Pothier 2001). Encore récemment considérée comme une ressource inépuisable (Simberloff 2001), la forêt boréale a fait l’objet d’une exploitation intensive (Haila 1994), cela particulièrement en Scandinavie où la quasi-totalité de la forêt originelle a laissé place à des forêts de seconde venue (Kuuluvainen et al. 2002). Ces pratiques ont eu pour conséquence d’altérer fortement la structure des communautés floristiques et faunistiques (Esseen et al. 1992, Niemelä 1997, Larsson et Kjell 2001), mettant de nombreuses espèces en péril. En Finlande par exemple, 196 espèces d’insectes saproxyliques sont inscrites sur la liste des espèces menacées (Rassi et al. 1992).
Au Québec, dans le domaine bioclimatique de la pessière à mousses, la forêt boréale naturelle de l’Est trouve sa spécificité dans l’irrégularité de sa structure (Boucher et al. 2003). Cette situation s’explique par l’humidité élevée du climat régional qui limite l’importance du feu dans les processus de dynamique forestière et favorise les phénomènes de sénescence et de chablis (Pham et al. 2004). Ainsi et comparativement à la forêt boréale de l’ouest du Québec, où le cycle du feu varie de 50 à 100 ans, dans la forêt boréale de l’est du Québec la période de retour du feu peut excéder 300 ans (Gauthier et al. 2001, Bouchard et al. 2008). Avec l’allongement du cycle de feu, une dynamique de trouées s’installe (Pham et al. 2004), ce qui engendre une structure forestière irrégulière et influence l’organisation spatio-temporelle des ressources, donc la répartition des communautés fauniques (Nilsson et al. 2001, Thompson et al. 2003). L’irrégularité de cette forêt
8 s’exprime également par la présence conjointe de différents types de peuplements, pouvant s’organiser le long d’un gradient de successions, allant des stades les plus jeunes ou les plus réguliers, vers les stades les plus anciens ou les plus irréguliers. Ce gradient permet l’évaluation de la variabilité quantitative et qualitative des attributs du peuplement sur la représentativité et la diversité des espèces. La forêt de la Côte-Nord du Québec constitue donc un terrain d’étude de choix pour l’acquisition de connaissances sur les facteurs qui modulent les patrons de biodiversité en zone boréale.
Modèle d’étude : les coléoptères
La forêt boréale est riche de nombreuses espèces, cependant, les connaissances demeurent limitées au niveau de certains groupes taxonomiques tels que les invertébrés (Rapport Coulombe 2004). Les insectes sont pourtant d’une importance fonctionnelle considérable dans les écosystèmes, tant dans les réseaux trophiques que dans l’accomplissement de processus complexes, comme par exemple la pollinisation ou la décomposition des matériaux (Wilson 1987). Pour les insectes, environ 25 000 espèces ont été répertoriées au Canada alors que leur richesse totale est estimée à 55 000 espèces (Danks 1993). Cette importante diversité devrait donc jouer un rôle majeur dans les inventaires de biodiversité (Niemlä 1997, Nilsson et al. 2001). Malheureusement, les insectes ont été trop longtemps ignorés (Franklin 1993, Miller 1993) au bénéfice des vertébrés, qui en forêt, constituent le groupe d’organismes le plus étudié (Hunter 1999). Cette situation est révélatrice de difficultés pratiques telles que le manque de spécialistes (Nilsson et al. 2001) et la rareté des ouvrages de référence sur la taxonomie et l’écologie des espèces. C’est pourquoi tout comme la plupart des études, la présente recherche focalise sur l’ordre d’insectes le mieux connu, le plus diversifié et le mieux représenté en forêt : les coléoptères.
Les coléoptères constituent une large proportion de la diversité spécifique de nombreux écosystèmes, depuis les tropiques jusqu’à la zone boréale (Martikainen and Kouki 2003). Durant les 20 dernières années, les coléoptères ont fait l’objet de nombreuses recherches, notamment en Scandinavie (Martikainen and Kouki 2003). De manière générale, plusieurs de ces études ont comparé d’une part, des vieilles forêts non perturbées à des forêts aménagées (Väisänen et al. 1993, Martikainen et al. 1999, Martikainen et al. 2000, Similä
et al. 2002) et d’autre part, des pratiques de foresterie intensives à des pratiques extensives (Siitonen and Martikainen 1994, Martikainen et al. 1996). Aussi, des études ont été menées afin de connaître les attributs préférentiels de certains groupes, comme les coléoptères saproxyliques (e.g. Martikainen et al. 1996, Økland et al. 1996, Martikainen et al. 1999, Siitonen 2001, Gibb et al. 2006) ou les carabes (e.g. Niemelä et al. 1996, Saint-Germain et al. 2005, Pearce and Venier 2006). Les résultats de ces études ont permis de souligner l’importance des forêts anciennes pour le maintien d’une plus large diversité de coléoptères, notamment pour des espèces rares ou menacées. De plus, les attributs associés à la quantité (volume) et à la qualité (gros diamètre, position, stade de décomposition, essence) du bois mort et au mélange des essences ont été mis en évidence (Økland et al. 1996, Martikainen et al. 2000).
Relier l’hétérogénéité et les coléoptères dans la forêt boréale
Bien que beaucoup de recherches aient été effectuées dans le domaine de l'hétérogénéité de l'habitat et des patrons de biodiversité, la plupart des études se sont limitées aux communautés de vertébrés. Tews et al. (2004) estiment que moins de 6% des publications étudiées dans leur revue de littérature concernent le lien entre l’hétérogénéité de l’habitat et les coléoptères. Par exemple, Brose (2003) a mis en évidence que les variations de composition spécifique des carabes étaient davantage fonction de l’hétérogénéité structurale de la végétation des prairies humides que de la diversité du couvert végétal. De même, Lassau et al. (2005) ont montré que la réponse des coléoptères, dans les boisés sur grès, était fortement associée à la complexité de l’habitat.
Aussi, les effets de l’hétérogénéité sont moins bien documentés pour les milieux naturels que les habitats anthropogènes (Tews et al. 2004). Les milieux naturels constituent pourtant un réservoir de vie, au niveau desquels de nombreuses espèces sont encore inconnues (Franklin 1993). Ils constituent en ce sens une source de bénéfices potentiels, tant du point de vue écologique, scientifique, éthique, qu’économique. La forêt boréale irrégulière de la Côte-Nord du Québec, bien que partiellement exploitée, présente encore une large proportion de vieux peuplements naturels, jusqu’alors peu étudiés. Les peuplements
10 forestiers de ce territoire constituent un terrain d’étude idéal, combinant une variabilité graduelle dans l’hétérogénéité des attributs à une forte représentativité de forêts vierges. Enfin, il n’existe à notre connaissance, que peu d’études ayant considéré l’ensemble de la diversité des coléoptères d’un habitat donné et aucune ne s’étant intéressée au rôle de l’influence de l’hétérogénéité de l’habitat sur la richesse de ce groupe taxonomique en forêt boréale. Cette situation est d’autant plus regrettable, si l’on considère que les coléoptères constituent un groupe d’indicateurs pertinent pour donner un cadre à la gestion durable des forêts (Langor et Spence 2006). C’est pourquoi une meilleure compréhension de l’influence de l’hétérogénéité de l’habitat sur la diversité des coléoptères pourrait nous permettre de mieux définir les attributs d’importance de la forêt boréale pour maintenir la biodiversité de ces insectes. Ainsi, il sera possible de fournir à l’industrie les outils nécessaires au développement de pratiques d’aménagement durable des forêts.
Objectif de l’étude
La présente étude vise à caractériser les patrons de biodiversité des coléoptères en forêt boréale irrégulière. Cette caractérisation se place dans le contexte de la compréhension des liens existant entre l’hétérogénéité de l’habitat et la diversité des coléoptères, à plusieurs échelles spatiales. Plus spécifiquement, la réponse de deux groupes de coléoptères à l’hétérogénéité de l’habitat est étudiée : les coléoptères au sol, qui se déplacent majoritairement en marchant et les coléoptères dans les airs, qui se déplacent majoritairement en volant. Aussi, pour chacun de ces groupes, deux sources d’hétérogénéité sont étudiées : l’hétérogénéité de composition et de structure. L’objectif central de l’étude est donc de comprendre l’influence du type d’hétérogénéité sur la richesse de deux groupes de coléoptères, à plusieurs échelles spatiales, dans les vieilles forêts boréales de la Côte-Nord du Québec.
Méthodologie
Notre étude se situe en forêt boréale, sur la Côte-Nord du Québec entre les 49ème et 51ème parallèles. Au total, 70 stations ont été échantillonnées sur deux ans, soit 36 en 2004 et 34
en 2005. Ces stations ont été sélectionnées selon des critères de représentativité de la diversité structurale et compositionnelle de la forêt boréale de la Côte-Nord.
Deux types de pièges passifs ont été utilisés de manière complémentaire pour échantillonner les coléoptères. Le piège à impact multidirectionnel est une méthode d’échantillonnage standardisée qui vise la capture des insectes volants. Il est considéré comme efficace pour capturer des coléoptères, notamment des espèces saproxyliques (Økland 1996, Brustel 2004). Le piège fosse permet de collecter les insectes se déplaçant en marchant au sol et est particulièrement efficace pour la capture des Carabidae (Dávalos et Blossey 2006).
Deux échelles spatiales ont été considérées. L’échelle du peuplement correspond à une placette circulaire de 400 m2 (rayon de 11.28 m), au niveau de laquelle de nombreux attributs descriptifs du peuplement ont été mesurés. L’échelle du paysage correspond à des cercles de 400 et 800 m de rayon depuis le centre de la placette et à l’intérieur desquels les composantes du paysage ont été extraites de cartes écoforestières.
Deux sources d’hétérogénéité ont été mesurées à chacune des trois échelles spatiales. L’hétérogénéité de composition correspond à la richesse des essences d’arbres et d’arbustes à l’échelle du peuplement, tandis qu’aux échelles du paysage, cette hétérogénéité se caractérise par la richesse des types de couverts. L’hétérogénéité structurale fait référence à la diversité des classes de diamètres à l’échelle du peuplement et à la diversité des types de structures de couverts aux échelles du paysage.
Le chapitre qui suit démontre l’importance de considérer plusieurs composantes de l’hétérogénéité et plusieurs échelles spatiales pour améliorer la compréhension des patrons de biodiversité. La méthodologie suivie ainsi que les analyses statistiques effectuées sont présentées plus en détails. La discussion replace les éléments trouvés dans le contexte plus général des connaissances existantes et illustre l’importance de considérer plusieurs groupes pour une meilleure compréhension de la diversité des coléoptères.
Chapitre principal
BEETLE DIVERSITY IN OLD-GROWTH BOREAL
FORESTS: INFLUENCE OF HABITAT
HETEROGENEITY AT MULTIPLE SCALES
JANSSEN PHILIPPE, FORTIN DANIEL and CHRISTIAN HÉBERT
Janssen Philippe
Chaire de recherche industrielle CRSNG-Université Laval en sylviculture et faune et Département de biologie, Université Laval, Québec, Qc, G1K7P4, Canada
Email : philippejanssen@hotmail.fr
Fortin Daniel
Chaire de recherche industrielle CRSNG-Université Laval en sylviculture et faune et Département de biologie, Université Laval, Québec, Qc, G1K7P4, Canada
Email : Daniel.Fortin@bio.Ulaval.ca
Hébert Christian
Ressources Naturelles Canada, Service Canadien des Forêts, Centre de Foresterie des Laurentides, 1055 du P.E.P.S., P.O Box 10380, Stn. Sainte-Foy, Québec, Qc, G1V 4C7, Canada
Abstract
The relative contribution of compositional and structural heterogeneity on biodiversity is currently ambiguous because field studies generally integrate these two sources of habitat heterogeneity into a single index. We established the relationship between species richness of ground-dwelling and flying beetles and compositional and structural attributes of forest heterogeneity. The relationship was evaluated at two spatial scales: the scale of a forest stand, corresponding to an 11.3 m radius, and the scale of the landscape, corresponding to either a 400 or 800 m radius. Seventy old-growth boreal forest sites were sampled on the North shore region of Québec, Canada, during the summers of 2004 and 2005. A total of 133 ground-dwelling beetle species (range: 4-42 species per site) were captured in pitfall traps and 251 flying species (range: 16-58 species per site) in flight-interception traps. We found that the most relevant type of heterogeneity to explain variations in species richness and the significance of landscape scale information varied between groups of beetles. Compositional heterogeneity (i.e. the number of species of forest trees and shrubs) at the stand scale best predicted species richness in ground-dwelling beetles. On the other hand, it was the combined influence of structural and compositional habitat heterogeneity at stand and landscape scales that best explained richness patterns in flying beetles. Our study outlines the significance of considering multiple types and spatial scales of habitat heterogeneity when describing patterns of species richness.
14
Introduction
Biological diversity usually relates positively to habitat heterogeneity (MacArthur and MacArthur 1961, Huston 1994). In forest ecosystems, habitat heterogeneity arises when either stand composition or structure varies over space or time (Li and Reynolds 1995, Franklin and Van Pelt 2004). Forest structure has been identified as a key determinant of biodiversity (review by McElhinny et al. 2005). Although some researchers have suggested that “stand structural complexity is essential for biodiversity conservation in all forests” (Lindenmayer et al. 2006), others have noted that indices of habitat structure often include attributes of forest composition (McElhinny et al. 2005). Combining structural and compositional attributes into one index may obscure the relative effect of habitat composition on biodiversity.
Several studies have shown that different components of habitat heterogeneity can have distinct consequences on biodiversity patterns (e.g. MacArthur and MacArthur 1961, Bersier and Meyer 1994, Schaffers et al. 2008). Unfortunately, only few studies have examined the separate effects of habitat structure and composition on biodiversity, with mixed results. For example, ground-dwelling beetle richness was influenced by the compositional attributes of heterogeneity in dwarf shrub habitats (Gonzáles-Megías et al. 2007), whereas carabid beetle richness was more closely associated with structural attributes of heterogeneity in temporary wetlands (Brose 2003). The contrasting results could reflect differences either in habitat heterogeneity between study areas or in the ecological requirements between the two groups of beetles. Regardless, such observations indicate a clear need for a closer examination of the effect of habitat composition on biodiversity.
The link between biodiversity and the type of habitat heterogeneity may also vary with spatial scale (Tews et al. 2004). In riparian forests, for example, birds select their breeding habitat on the basis of structural attributes at broad spatial scale and on compositional attributes at a finer scale (Bersier and Meyer 1994). The latter example illustrates the fact that diversity is scale dependent (Magurran 2004), and emphasizes the need to evaluate the relationship between diversity and habitat heterogeneity at multiple scales (Wiens and Milne 1989).
Most studies quantifying the relationship between habitat heterogeneity and species richness have been conducted on vertebrate communities, and have generally focused on habitats under anthropogenic disturbance (review by Tews et al. 2004). Information is thus limited for major taxonomic groups, such as insects, in natural forest stands. Studies aimed at establishing beetle-habitat relationships in the boreal forest have used old-growth forests as benchmarks for estimating the impact of forest management (e.g. Martikainen et al. 2000, Similä et al. 2002), or have concentrated their investigation towards specific groups such as saproxylics (e.g. Økland et al. 1996, Franc et al. 2007) or carabids (e.g. Niemelä et al. 1996, Martikainen et al. 2006). To our knowledge, there has been no study on global species richness of beetles in natural landscapes dominated by old-growth boreal forests. Given the fundamental role that insects play in many ecosystem processes, this gap in knowledge could preclude our ability to develop efficient strategies for sustainable forest management (Wilson 1987).
Our study examined the relationship between species richness of beetles and habitat heterogeneity at multiple spatial scales in the old-growth boreal forest of the North shore of Québec, Canada. The boreal forest of this region is characterized by a humid climate that results in a long fire cycle, i.e. even exceeding 300 years (Gauthier et al. 2001, Bouchard et al. 2008). Forests are characterized by an irregular stand structure and composition (Boucher et al. 2003) partially created by insect outbreaks and windthrow (Pham et al. 2004). The ecosystem thus provides a unique opportunity to quantify the relationship between habitat heterogeneity and beetle richness in old-growth boreal forests. Specifically, we tested (1) whether habitat heterogeneity influenced beetle species richness in old-growth boreal forests, (2) whether ground-dwelling and flying beetles responded similarly to habitat heterogeneity, (3) which component of habitat heterogeneity (structure or composition) best explained species richness and (4) whether the link between heterogeneity and species richness was scale dependent.
16
Materials and Methods
Study area
The study was carried out in the North Shore region of Québec, Canada, between the 49th and 51th parallels (Figure 1). The area belongs to the eastern spruce-moss subdomain of the boreal forest (Ministère des Ressources Naturelles et de la Faune du Québec 2003a). Dominant trees species are black spruce (Picea mariana (Mill.)), and balsam fir (Abies balsamea (L.) Mill.). White spruce (Picea glauca (Moench) Voss), white birch (Betula papyrifera (Marsh.)), trembling aspen (Populus tremuloides (Michx.)), and jack pine (Pinus banksiana (Lamb.)), are also locally abundant.
We sampled 36 sites in 2004 and 34 sites in 2005, for a total of 70 sites over the two years. Sites were selected to reflect the range of structure and composition of the old-growth boreal forests of the North Shore region (Table 1). Site selection was based on the 1:20000 ecoforest maps of the Ministère des Ressources Naturelles et de la Faune du Québec (MRNFQ), updated for cutovers and logging roads by the local forestry companies. Each site was located in a stand >4 ha, at a distance >100 m from the stand’s edge, and >2 km from any other sampling sites.
Figure 1. Study area and distribution of sampling sites in the old-growth boreal forest of the North Shore region of Québec, Canada.
Table 1. Distribution of sampling sites, according to stand type and age, in the old-growth boreal forest of the North Shore region of Québec, Canada.
Age
Stand type 50-70 71-90 91-120 >120 Total
Spruce 6 9 15 4 34
Spruce - Fir 3 4 9 8 24
Fir 3 - 3 6 12
Total 12 13 27 18 70
Insect sampling
Insects were collected from 2 June to 17 August 2004 at 36 sites and from 7 June to 15 August 2005 at 34 sites. Two types of traps were used at each site. A multidirectional flight-interception trap was placed at the center of each sampling site, 0.5 - 1 m above the ground to capture flying insects. The trap was built using four 15 x 40 cm panels (two made of Plexiglas and two of mosquito net) mounted into a cross pattern, along a 10-cm diameter black ABS cylinder, with two funnels located above and below the cylinder, and leading to collecting vials (Saint-Germain et al. 2004). Four pitfall traps (MultiPher® traps; Jobin and Coulombe 1988) were buried into the ground, 7 m away from the multidirectional flight-interception trap, and 10 m from each other to capture ground-dwelling insects. Pitfall traps had a diameter of 10 cm and were screened with a wire mesh (10 x 10 mm) to limit the captures of vertebrates.
We used a 40 % ethanol solution with traces of household vinegar (5 % acetic acid) to preserve insects. Trapped insects were collected every two weeks. Most beetles were identified at the species or genus level, depending on the available information in the literature. Some Aleocharinae sub-family specimens (Staphylinidae) were identified at tribe level. Identifications were verified by experts of the Canadian National Collection (CNC) of Insects, Arachnids and Nematodes (Ottawa, Canada) and cross-checked with insect
18 collections from the CNC or the Insectarium René-Martineau of the Canadian Forest Service (Québec, Canada).
Characterisation of sampling sites
Sampling sites were characterized at the stand and landscape scales. At the stand scale, a 400 m² circular plot (radius: 11.3 m) was established in which the diameter at breast height (DBH) of every living and dead tree 9 cm was recorded (2 cm classes). The DBH of all living and dead trees <9 cm was also recorded in two perpendiculars subplots of 2 m x 20 m. Coarse woody debris with diameter ≥9 cm at base and ≥1 m in length were inventoried: the diameter at both ends (2 cm classes), the length, and the tree species, whenever possible, were recorded. Only the portion of debris located inside the plots was considered. At the landscape scale, a Geographic Information System (GIS), managed with ArcGIS 9.1 (Environmental Systems Research Institute, Redlands, California, USA), was used to characterize the landscape mosaic within 400 and 800 m of each sampling site. We used forest inventory maps, based on MRNFQ ecoforest classification (i.e. Normes de cartogarphie écoforestière, Ministère des Ressources Naturelles et de la Faune du Québec 2003b), to describe landscape composition and structure within each of the two radii (data collected between 1997 and 2003 for the study area). These maps constitute baseline information for the planning of logging operations by forestry companies. By studying the link between species richness and habitat attributes using information already used by forest managers, our findings should be more readily applicable to the conservation and management of forest ecosystems.
Ecoforest classification uses age classes to define structural classes. Stand age provides a suitable index of forest structure because the two are closely associated in our study area (Boucher et al. 2003). Landscape structure was characterized by 14 mutually exclusive land cover types: Young even-aged stands, i.e. basal area of stems dominated by one age class ≤80 years (0-20, 21-40, 41-60, 61-80 years classes), Old even-aged stands, i.e. basal area of stems dominated by one age class >80 years (81-100, ≤101 years classes), Young uneven-aged stands, i.e. basal area of stems dominated by at least three age classes ≤80 years, Old uneven-aged stands, i.e. basal area of stems dominated by at least three age classes >80
years, Multi-storied stands, i.e. basal area of stems distributed in two-stories separated by at least 5 m. Each of these five classes of forest stands were subdivided into two classes based on tree density (A: ground projection of tree canopy ≤60%, B: >60%). The remaining four additional structure classes were: Sparse plant cover (combining wet and dry barrens), Cutovers (0-20 years), Water bodies and Other features (e.g. anthropogenic infrastructures, burns and windthrows, which covered <3% of the study sites).
Landscape composition was characterized based on 14 mutually exclusive classes of stand composition: stands dominated by spruce or fir species (2 classes: Spruce stands, Fir stands), stands co-dominated by spruce and fir species (2 classes: Spruce-fir stands, Fir-spruce stands), stands dominated by Fir-spruce or fir species with at least two companion species (2 classes: Spruce+spp stands, Fir+spp stands), other stands dominated by one species with one or more companion species (3 classes: Pine+spp stands, Aspen+spp stands, Birch+spp stands), Dry barren lands, Wet barren lands, Water bodies, Cutovers and Other features (e.g. anthropogenic infrastructures, burns and windthrows).
Heterogeneity indices and environmental variables
At the stand scale, structural heterogeneity was estimated as the number of diameter classes (2 cm classes) and compositional heterogeneity as the number of tree (e.g. black spruce, jack pine) and shrub (e.g. speckled alder Alnus rugosa, american mountain ash Sorbus americana) species within the 400 m² circular plot. The indices were calculated for standing trees (combining live and dead trees) and for coarse woody debris (Table 2). Also, the basal area (m²/ha) of standing trees and the volume (m³/ha) of coarse woody debris of medium (9-16 cm) and large (≥16 cm) diameter were considered as structural attributes. The 16-cm threshold value corresponded to the upper limit of the diameter class (14-16 cm) in which fell the mean diameter recorded in the study area (15 ± 5 cm, n = 70). The basal area (m²/ha) of standing black spruce and balsam fir trees and the volume (m³/ha) of coarse woody debris of these two species were considered as compositional attributes.
At the landscape scale, structural heterogeneity was measured as the number of landscape structure classes (14 classes) and compositional heterogeneity as the number of landscape composition classes (14 classes), within the 400 m and 800 m radii (Table 2). Also, the area
20 covered by old even-aged stands and the area of old uneven-aged stands were considered as structural attributes, whereas the area covered by spruce dominated stands (combining spruce stands, spruce-fir stands and spruce+spp stands) and the area covered by fir dominated stands (combining fir stands, fir-spruce stands and fir+spp stands) were considered as compositional attributes. The areas covered by cutovers and water bodies were considered as influencing landscape composition and structure, and thus appear in both categories of models (Appendix 1).
Table 2. Description of stand and landscape variables used to model beetle richness in old-growth boreal forests of the North-Shore region of Québec, Canada.
Variable Description Range
latitude Latitude in UTM coordinates 5532265-5681758 Stand characteristics measured within a 11.28 m radius, leading to a 400 m² plot
ststand Number of diameter classes of standing trees 6-17
mediumba Basal area of medium size trees (DBH: 9-16 cm) 1.9-42.7 m²/ha largeba Basal area of large trees (DBH: >16 cm) 0-41.6 m²/ha spstand Species richness of standing trees and shrubs 1-7
spruceba Basal area of black spruce 2.1-92.3 m²/ha
firba Basal area of balsam fir 0-88.3 m²/ha
stlog Number of diameter classes of coarse woody debris 0-13 m3/ha mediumvl Volume of coarse woody debris of medium logs
(basal diameter: 9-16 cm)
0-34.1 m3/ha
largevl Volume of coarse woody debris of large logs (basal diameter: >16 cm)
0-224.3 m3/ha
splog Number of species of coarse woody debris 0-4
sprucevl Volume of coarse woody debris of black spruce 0-117.6 m3/ha firvl Volume of coarse woody debris of balsam fir 0-126.6 m3/ha Landscape characteristics measured within radius i = 400 or 800 m, leading to landscapes of 50 ha and 201 ha, respectively
wateri Area covered by lakes and rivers 0-58.7 ha
cuti Area covered by 0 - 20 year cutovers 0-135.5 ha
compositioni Number of landscape composition classes 1-10
sprucestandi Area covered by spruce stands, spruce-fir stands and
spruce+spp stands
0-177.9 ha
firstandi Area covered by fir stands, fir-spruce stands and
fir+spp stands
0-197.5 ha
structurei Number of landscape structure classes 2-11
oldeveni Area covered by old even-aged stands 0-197.4 ha
22
Statistical analyses
We tested for spatial autocorrelation in landscape attributes between sampling sites with variograms. Analyses were based on 200 plots of 10 m buffers extending in the four cardinal directions around each sampling site (i.e. 50 plots by direction).
Richness-habitat relationships were evaluated based on two dependent variables: 1) species richness of ground-dwelling beetles, measured from captures in pitfall traps and 2) species richness of flying beetles from captures in the multidirectional flight-interception trap. We developed 61 biologically plausible models (Appendix 1) and, because of overdispersion (c >2) we used negative binomial regressions to relate richness in beetle species and variables of habitat heterogeneity at the different scales. Some of the candidate models included variables describing forest composition only, some models included forest structure only, whereas other models included both types of variables. Similarly, some models described habitat heterogeneity at either the stand or landscape scale, whereas other models incorporated both spatial scales. Candidate models were based on subsets of 29 potential independent variables (Table 2). A square-root transformation was applied to environmental variables with skewness >1 to approximate normal distribution (McCune and Grace 2002). Multicollinearity among explanatory variables was assessed using variance inflation factors. This verification led to the exclusion of volume of coarse woody debris of black spruce (sprucevl) and of large diameter (largevl) from candidate models. Also, variance inflation factors indicated that effects of sampling year on species richness were already accounted for by latitude. Hence, only latitude was used in candidate models. In the end, we considered only models with variance inflation factor <2.5.
Model performance was evaluated using Akaike’s Information Criterion corrected for small sample sizes (AICc, Anderson et al. 2000). We used model averaging (Burnham and
Anderson 2004) when the AICc weight of the top-ranking model was <0.95. Average
parameter estimates and associated unconditional standard errors were calculated from the subset of the top ranking models whose sum of AICc weights was ≥0.95. This subset of
models can be viewed as a confidence set on the Kullback-Leibler best model (Burnham and Anderson 2004).
To determine the relative importance of forest composition and structure on beetle richness, we compared the sum of AICc weights (Burnham and Anderson 2004) for models including
compositional or structural variables only, and those including both type of variables. To identify which spatial scale best explained beetle richness, we compared the sum of AICc
weights for models including only variables estimated at the stand scale or at a landscape scale (400 or 800 m radius), and models including variables measured at both scales.
24
Results
Spatial autocorrelation became absent at distances >750 m for the major vegetation classes of old-growth boreal forests of the North-Shore region of Québec, Canada (Figure 2). Given that sampling sites were >2 km apart (Figure 1), habitat attributes could be considered as independent among sites.
Figure 2. Variogram estimated for four vegetation cover classes in the boreal forest of the North Shore region of Québec, Canada.
Beetles richness and habitat heterogeneity
A total of 315 beetle species (14 819 individuals), belonging to 53 families were captured at the 70 sites; 133 species (4 236 individuals) from 21 families were caught in pitfall traps and 251 species (10 583 individuals) from 52 families in the multidirectional flight-interception traps. The most abundant species were Epuraea planulata Erichson (Nitidulidae) and Rhizophagus dimidiatus Mannerheim (Monotomidae). Ground-dwelling species richness averaged 16 species per site, with a range of 4 to 42 species, whereas flying species richness averaged 30 species per site, with a range of 16 to 58 species.
Species richness of ground-dwelling beetles
The top-ranking model (Model 3; w3 = 0.31, r² = 41.8% for the correlation between
predicted and observed values) predicting species richness of ground-dwelling beetles only accounted for stand composition (Table 3). Model 3 was at least 2.8 times (i.e. 0.309/0.112) more likely to explain species richness of ground-dwelling beetles than other models. Its AICc weight, however, was relatively low, indicating that other models also received a
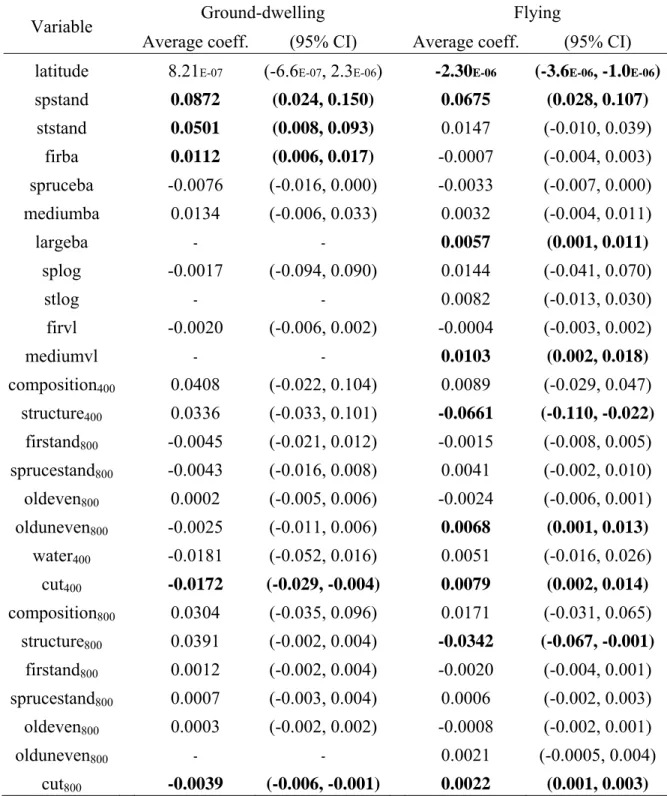
certain level of support (Burnham and Anderson 2004). We therefore combined the 12 best models (∑w =0.963) and used model averaging to draw inferences about the variables influencing ground-dwelling beetle richness. The top 10 models are displayed in Table 3. Species richness in ground-dwelling beetles increased with increasing heterogeneity in tree species composition (spstand) and diameter (ststand), as well as with the basal area of balsam fir (firba). In contrast, species richness decreased as the area of cutovers increased within a 400 m (cut400) or an 800 m (cut800) radius. The influence of the other habitat
attributes appeared less important, given that the 95% confidence interval of their regression coefficient included 0 (Table 5).
26 Table 3. The 10 top-ranking models among 61 models (see Appendix 1) predicting richness of ground-dwelling beetles in 70 stands of old-growth boreal forests, as assessed with Akaike’s Information Criterion corrected for small sample size (AICc). Number of
estimated parameters including the intercept (K), AICc, the difference in AICc (ΔAICc), and
AICc weight (w) are provided.
No Candidate Model K AICc ΔAICc w
3 latitude spstand firba 4 -4007.2 0.0 0.309
42 latitude spstand ststand firba mediumba 6 -4005.2 2.0 0.112 46 latitude spstand ststand spruceba mediumba composition400
structure400 sprucestand400 oldeven400 cut400
11 -4005.0 2.2 0.105
41 latitude spstand ststand spruceba mediumba 6 -4004.8 2.4 0.094 16 latitude spstand spruceba firba composition400
sprucestand400 firstand400 water400 cut400
10 -4004.3 2.9 0.073
14 latitude spstand firba composition800 firstand800 6 -4004.2 3.0 0.069
13 latitude spstand firba composition400 firstand400 6 -4003.8 3.4 0.056
17 latitude spstand spruceba firba composition800
sprucestand800 firstand800
8 -4003.5 3.7 0.048
6 latitude spstand splog spruceba firba firvl 7 -4002.9 4.3 0.035 15 latitude spstand spruceba firba composition400
sprucestand400 firstand400
Species richness of flying beetles
The top-ranking model (Model 48, r² = 49.5%) was 4.8 times more likely to explain flying beetle richness than the second best model. The AICc weight of Model 48 was low (w48 =
0.37), however. We used the 27 best models (∑w = 0.951), the first 10 being displayed in Table 4, for model inference. Species richness of flying beetles increased with the heterogeneity in tree species composition (spstand), the basal area of large size trees (largeba), the volume of medium size woody debris (mediumvl), the area of old-uneven stand within a 400 m radius (olduneven400) and the area of cutovers within 400 or 800 m
radii (cut400 or cut800). Richness of flying beetles decreased with increasing latitude and as
the heterogeneity of stand structure within 400 or 800 m radii (structure400 or structure800)
increased. Other habitat attributes appeared to have little influence on flying beetle richness, given that the 95% confidence interval of their regression coefficient included 0 (Table 5).
28 Table 4. The 10 top-ranking models among 61 models (see Appendix 1) predicting richness of flying beetles in 70 stands of old-growth boreal forests, as assessed with Akaike’s Information Criterion corrected for small sample size (AICc). Number of estimated
parameters including the intercept (K), AICc, the difference in AICc (ΔAICc), and AICc
weight (w) are provided.
No Candidate Model K AICc ΔAICc w
48 latitude spstand ststand firba mediumba composition400
structure400 firstand400 olduneven400 cut400
11 -9648.5 0.0 0.368
54 latitude spstand ststand stlog composition400 structure400 7 -9645.6 2.9 0.087
46 latitude spstand ststand spruceba mediumba composition400
structure400 sprucestand400 oldeven400 cut400
11 -9645.3 3.2 0.076
32 latitude stlog mediumvl structure400 oldeven400 6 -9645.1 3.4 0.069
34 latitude ststand mediumba mediumvl structure400 oldeven400
olduneven400
8 -9645.0 3.5 0.065
49 latitude spstand ststand firba mediumba composition800
structure800 firstand800 olduneven800 cut800
11 -9643.5 5.0 0.031
21 latitude mediumba largeba mediumvl 5 -9643.2 5.3 0.026 52 latitude spstand ststand splog composition400 structure400 7 -9643.0 5.4 0.024
43 latitude spstand stlog firvl mediumvl 6 -9643.0 5.4 0.024
Table 5. Average coefficients and confidence intervals (CI) for each variable of the 12 most parsimonious models predicting richness of ground-dwelling beetles (first 10 provided in Table 3) and each variable of the 27 most parsimonious models (first 10 provided in Table 4) predicting richness of flying beetles in old-growth boreal forests of the North-Shore region of Québec, Canada. The 95% confidence interval of coefficients in bold excluded 0.
Ground-dwelling Flying
Variable
Average coeff. (95% CI) Average coeff. (95% CI) latitude 8.21E-07 (-6.6E-07, 2.3E-06) -2.30E-06 (-3.6E-06, -1.0E-06)
spstand 0.0872 (0.024, 0.150) 0.0675 (0.028, 0.107) ststand 0.0501 (0.008, 0.093) 0.0147 (-0.010, 0.039) firba 0.0112 (0.006, 0.017) -0.0007 (-0.004, 0.003) spruceba -0.0076 (-0.016, 0.000) -0.0033 (-0.007, 0.000) mediumba 0.0134 (-0.006, 0.033) 0.0032 (-0.004, 0.011) largeba - - 0.0057 (0.001, 0.011) splog -0.0017 (-0.094, 0.090) 0.0144 (-0.041, 0.070) stlog - - 0.0082 (-0.013, 0.030) firvl -0.0020 (-0.006, 0.002) -0.0004 (-0.003, 0.002) mediumvl - - 0.0103 (0.002, 0.018) composition400 0.0408 (-0.022, 0.104) 0.0089 (-0.029, 0.047) structure400 0.0336 (-0.033, 0.101) -0.0661 (-0.110, -0.022) firstand800 -0.0045 (-0.021, 0.012) -0.0015 (-0.008, 0.005) sprucestand800 -0.0043 (-0.016, 0.008) 0.0041 (-0.002, 0.010) oldeven800 0.0002 (-0.005, 0.006) -0.0024 (-0.006, 0.001) olduneven800 -0.0025 (-0.011, 0.006) 0.0068 (0.001, 0.013) water400 -0.0181 (-0.052, 0.016) 0.0051 (-0.016, 0.026) cut400 -0.0172 (-0.029, -0.004) 0.0079 (0.002, 0.014) composition800 0.0304 (-0.035, 0.096) 0.0171 (-0.031, 0.065) structure800 0.0391 (-0.002, 0.004) -0.0342 (-0.067, -0.001) firstand800 0.0012 (-0.002, 0.004) -0.0020 (-0.004, 0.001) sprucestand800 0.0007 (-0.003, 0.004) 0.0006 (-0.002, 0.003) oldeven800 0.0003 (-0.002, 0.002) -0.0008 (-0.002, 0.001) olduneven800 - - 0.0021 (-0.0005, 0.004) cut800 -0.0039 (-0.006, -0.001) 0.0022 (0.001, 0.003)
30
Beetles richness and types of heterogeneity
The sum of AICc weights for models including compositional variables (models 1 to 20),
structural variables (models 21 to 39) or both types of variables (models 40 to 61) (see Appendix 1 for model description) revealed that the type of habitat heterogeneity influencing species richness differed between ground-dwelling and flying beetles (Figure 3). Species richness of ground-dwelling beetles was mostly influenced by compositional heterogeneity. Seven of the top 10 models included only attributes of forest composition (Table 3). Cumulative AICc weight for all models including only compositional variables
was 0.65. In contrast, species richness of flying beetles was influenced by both compositional and structural heterogeneity. The top three models included both types of heterogeneity (Table 4). Also, the cumulative AICc weight for models including a
combination of compositional and structural variables was 0.70.
Figure 3. Influence of types of habitat heterogeneity on the richness of ground-dwelling and flying beetles in old-growth boreal forests. Sums of AICc weights are provided for models based exclusively on compositional variables, on structural variables or on both types of variables.
Beetles richness and scales of heterogeneity
Species richness of ground-dwelling beetles was a function of multiple scales, although models based only on stand characteristics performed slightly better than those combining both stand and landscape attributes (Figure 4). Species richness of flying beetles was associated with attributes of both scales (stand and landscape within 400 m, Figure 4). The weight of evidence favoured models accounting for both scales of attributes 4.88 times (i.e. 0.825/0.169) more than models based on stand characteristics alone. For the two groups of beetles, models of species richness performed better when landscape variables were measured within a 400 m than an 800 m radius (Figure 4). However, the six models including only landscape variables (models 56 to 61) were poor predictors of beetle richness (Figure 4).
Figure 4. Influence of heterogeneity estimated at different spatial scales on the richness of ground-dwelling and flying beetles in old-growth boreal forests. Sum of AICc weights are provided for models based exclusively on stand variables, on landscape variables or on variables estimated at both scales. The hatched bar indicates the relative contribution of models including variables measured at 400 m and 800 m radii, within models including stand and landscape variables and models including exclusively landscape variables.
32
Discussion
Our study shows that the compositional and structural components of forest heterogeneity have distinct consequences on the species richness of ground-dwelling and flying beetles in old-growth boreal forests. Our findings are significant because habitat heterogeneity studies commonly integrated compositional and structural heterogeneity into a single index simply referred to as “structural” heterogeneity or complexity (McElhinny et al. 2005). This has resulted in guidelines for sustainable management that put more emphasis on structural than compositional components of forests (e.g. Lindenmayer et al. 2006). The preservation of biodiversity is recognized as a criterion of sustainable management in most countries (Lindenmayer et al. 2000, Kuuluvainen 2002), and our results outline the importance of considering compositional heterogeneity for beetle richness in old-growth boreal forests. Richness of ground-dwelling beetles was influenced primarily by compositional heterogeneity, i.e. the number of tree and shrub species and the basal area of balsam fir. Models that accounted for both compositional and structural heterogeneity also received some support, indicating that stand structure (e.g. the number of diameter classes of standing trees) also appeared to influence the richness of ground-dwelling beetles in old-growth boreal forests. Previous studies have reported a positive effect of habitat heterogeneity on biodiversity in this group of beetles (e.g. Lassau et al. 2005), but only few studies have investigated the relative contribution of different types of habitat heterogeneity on ground-dwelling beetles (e.g. Gonzáles-Megías et al. 2007, Brose 2003). Higher compositional heterogeneity in old-growth boreal forests might be associated with greater amounts of resources at ground level (e.g. leaf litter), which may have a positive effect on biodiversity. Indeed, amount of leaf-litter has been shown to increase ground-dwelling beetle richness (Lassau et al. 2005) and affect assemblage structure of carabid beetles (Koivula et al. 1999). Similarly, balsam fir may have a positive effect on species richness because it is the predominant tree species contributing to coarse woody debris. Balsam fir is particularly susceptible to windthrow and insect and disease outbreaks (Farrar 1995, MacLean and Ebert 1999, Ruel 2000). Thus, balsam fir is an important generator of structural heterogeneity.
Unlike the ground beetles, compositional heterogeneity alone explained poorly the spatial variations in local richness of flying beetles. Instead, species richness of flying beetles was influenced by both structural and compositional attributes of forest heterogeneity. Flying beetles occupying old-growth boreal forests display a wide range of diets and use many microhabitats, potentially explaining why both forest composition and structure influenced species richness. Richness decreased with the diversity of stand structures in the landscape (structural heterogeneity) in our study. This is contrary to the positive link between richness and heterogeneity usually reported in the literature (Tews et al. 2004). One plausible explanation for our results is that beetle flight is favoured in habitats characterized by simple vertical structures (Lassau et al. 2005). The latter hypothesis could also explain the negative effect of structural heterogeneity on flying beetle richness observed at landscape scales. In contrast, the richness of flying beetles increased with compositional heterogeneity or the number of tree and shrub species. The presence of deciduous trees in coniferous stands has been reported to increase the richness of non-saproxylic beetles (Martikainen et al. 2000) and saproxylic beetles (Bakke 1999), a trend consistent with our results. The richness of saproxylic species depends on various attributes linked to the quantity and diversity of dead wood (e.g. Økland et al. 1996, Franc et al. 2007). Saproxylic species were a large portion of the flying beetles captured in our study, and we observed an increase in the richness of these with the basal area of large trees and the volume of coarse woody debris, two habitat attributes strongly associated with saproxylic beetles (Martikainen et al. 2000).
Spatial scale also influenced species richness of beetles. The richness of flying beetles was a function of both stand and landscape attributes, whereas the richness of ground-dwelling beetles was influenced mostly by stand attributes. The greater mobility of flying beetles may make them more likely than ground dwelling beetles to respond to landscape features measured over broad spatial extents (With and Crist, 1995). In agricultural landscape, the richness of most soil macroarthropod taxa was better explained by variables measured at the local scale (i.e. land use and habitat characteristics) than by those measured at landscape scales (i.e. composition of the neighbouring landscape) (Dauber et al. 2005). Fine-scale habitat heterogeneity should be particularly important for species with reduced mobility because it reflects variations in microhabitat and resource availability (Niemelä et al. 1996).
34 In contrast, species richness of saproxylic flying beetles in the Norwegian boreal forest was best described by ecological variables measured at landscape scales of 1 and 4 km² (Økland et al. 1996). Similarly, arboreal beetle richness in the eastern deciduous forest of Ohio and Indiana was more closely associated to broad-scale characteristics of ecoregions than fine-scale variations in trees and forest stands (Gering et al. 2003). Our research underlines the importance of considering multiple functional groups and scales when evaluating the role of heterogeneity on richness patterns of taxa as diversified as beetles.
Although landscape features had less influence on the richness of ground-dwelling than flying beetles, both groups displayed a certain level of response to landscape attributes. The abundance of cutovers in the surrounding landscape decreased the richness of ground-dwelling beetles in residual forest stands but increased the richness of flying beetles. Cutovers may harbour different animal communities than closed stands (Koivula and Niemelä 2002, Similä et al. 2002, Martikainen et al. 2006). Flying beetles are relatively mobile and the probability of being captured in adjacent forest stands is likely to be increased by the immediate proximity of flowering plants, abundant in cutovers and on which feed many adult saproxylic beetles (Arnett and Thomas 2001, Arnett et al. 2002). Also, the less mobile ground-dwelling beetles may disperse over relatively small distances, and they may favour movements between relatively similar land cover types (e.g. among forested stands). In fact, the availability and connectivity of mature stands would appear essential to maintain forest-specialist carabid species, and forest gaps exceeding 50–200 m would already act as a barrier (Koivula and Niemelä 2002). Similarly, we found that cutovers had a negative effect on the ground beetle richness, highlighting the sensitivity of old-growth ground-dwelling beetles to habitat perturbations. Logging operations should account for fine-scale heterogeneity, as well as for the characteristics of the forest mosaic (Niemelä et al. 1996) to maintain biodiversity in old-growth forests under management. We suggest that strategies for sustainable management should consider that forest harvesting impact species richness at distances reaching 400 m (Figure 4) inside adjacent forest stands, even for animals as small as insects.