Elsevier Editorial System(tm) for Journal of Environmental Radioactivity
Manuscript Draft Manuscript Number: JENVRAD-D-16-00246R1
Title: Exploring 222Rn as a tool for tracing groundwater inflows from eskers and moraines into slope peatlands of the Amos region of Quebec, Canada
Article Type: Research Paper
Keywords: peatland; esker; moraine; 222Rn; groundwater discharge; Québec Corresponding Author: Prof. Daniele L. Pinti, PhD
Corresponding Author's Institution: UQAM First Author: Laureline Berthot, MSc
Order of Authors: Laureline Berthot, MSc; Daniele L. Pinti, PhD; Marie Larocque, PhD; Sylvain Gagné, MSc; Myriane Ferlatte, MSc; Vincent Cloutier, PhD
Abstract: Peatlands can play an important role in the hydrological dynamics of a watershed. However, interactions between groundwater and peat water remain poorly understood. Here, we present results of an
exploratory study destined to test radon (222Rn) as a potential tracer of groundwater inflows from fluvioglacial landform aquifers to slope
peatlands in the Amos region of Quebec, Canada. 222Rn occurs in
groundwater but is expected to be absent from peat water because of its rapid degassing to the atmosphere. Any 222Rn activity detected in peat water should therefore derive from groundwater inflow. 222Rn activity was measured in groundwater from municipal, domestic wells and newly drilled and instrumented piezometers from the Saint-Mathieu-Berry and Barraute eskers (n=9), from the Harricana Moraine (n=4), and from the fractured bedrock (n=3). Forty measurements of 222Rn activity were made from piezometers installed in five slope peatlands, along six transects oriented perpendicular to the fluvioglacial deposits. The relationship between 222Rn and total dissolved solids (TDS) measured in water from the mineral deposits underlying the peat layer suggests that 222Rn is
introduced by lateral inflow from eskers and moraine together with
salinity. This input is then diluted by peat water, depleted in both TDS and 222Rn. The fact that a relationship between TDS and 222Rn is visible calls for a continuous inflow of groundwater from lateral
eskers/moraines, being 222Rn rapidly removed from the system by radioactive decay. Although more research is required to improve the sampling and tracing techniques, this work shows the potential of 222Rn tracer to identify groundwater inflow areas from granular aquifers found in eskers and moraines to slope peatlands.
Exploring
222Rn as a tool for tracing groundwater inflows from eskers and
moraines into slope peatlands of the Amos region of Quebec, Canada
Laureline BERTHOT1, Daniele L. PINTI1*, Marie LAROCQUE1, Sylvain GAGNÉ1, Miryane FERLATTE1, Vincent CLOUTIER2
1 – GEOTOP and Département des sciences de la Terre et de l’atmosphère, Université du Québec à Montréal, C.P. 8888, Succ. Centre-Ville, Montréal, QC, H3C 3P8, Canada
2 - Groundwater Research Group, Research Institute on Mines and the Environment, Université du Québec en Abitibi-Témiscamingue, Campus d’Amos, 341, rue Principale Nord, suite 5004, Amos QC, J9T 2L8, Canada
* Corresponding author: [email protected]; fax +1 514 987 3635 Title Page with author names and affiliations
Highlights
Radon measured in eskers and connected peatlands in Quebec
Radon is tested as novel tracer of groundwater inflow in peatlands
Shallower peat water is depleted in radon by degassing to atmosphere
Radon and TDS relation suggests inflow from esker and short residence time *Highlights (for review)
Exploring
222Rn as a tool for tracing groundwater inflows from eskers and
1moraines into slope peatlands of the Amos region of Quebec, Canada
2 3 Laureline BERTHOT1 , Daniele L. PINTI1 *, Marie LAROCQUE1 , Sylvain GAGNÉ1 , Miryane 4 FERLATTE1 , Vincent CLOUTIER2 5 6 7
1 – GEOTOP and Département des sciences de la Terre et de l’atmosphère, Université du 8
Québec à Montréal, C.P. 8888, Succ. Centre-Ville, Montréal, QC, H3C 3P8, Canada 9
10
2 - Groundwater Research Group, Research Institute on Mines and the Environment, Université 11
du Québec en Abitibi-Témiscamingue, Campus d’Amos, 341, rue Principale Nord, suite 5004, 12
Amos QC, J9T 2L8, Canada 13
14
* Corresponding author: [email protected]; fax +1 514 987 3635 15
16 17
Keywords: peatland; esker; moraine; 222
Rn; groundwater discharge; Québec 18 19 20 21 22 *Manuscript file
Abstract
23
Peatlands can play an important role in the hydrological dynamics of a watershed. However, 24
interactions between groundwater and peat water remain poorly understood. Here, we present 25
results of an exploratory study destined to test radon (222
Rn) as a potential tracer of groundwater 26
inflows from fluvioglacial landform aquifers to slope peatlands in the Amos region of Quebec, 27
Canada. 222
Rn occurs in groundwater but is expected to be absent from peat water because of 28
its rapid degassing to the atmosphere. Any 222
Rn activity detected in peat water should therefore 29
derive from groundwater inflow. 222
Rn activity was measured in groundwater from municipal, 30
domestic wells and newly drilled and instrumented piezometers from the Saint-Mathieu-Berry 31
and Barraute eskers (n=9), from the Harricana Moraine (n=4), and from the fractured bedrock 32
(n=3). Forty measurements of 222
Rn activity were made from piezometers installed in five slope 33
peatlands, along six transects oriented perpendicular to the fluvioglacial deposits. The 34
relationship between 222
Rn and total dissolved solids (TDS) measured in water from the mineral 35
deposits underlying the peat layer suggests that 222
Rn is introduced by lateral inflow from eskers 36
and moraine together with salinity. This input is then diluted by peat water, depleted in both 37
TDS and 222
Rn. The fact that a relationship between TDS and 222
Rn is visible calls for a 38
continuous inflow of groundwater from lateral eskers/moraines, being 222
Rn rapidly removed 39
from the system by radioactive decay. Although more research is required to improve the 40
sampling and tracing techniques, this work shows the potential of 222
Rn tracer to identify 41
groundwater inflow areas from granular aquifers found in eskers and moraines to slope 42
peatlands. 43
44 45
1. INTRODUCTION
46
Eskers (long, winding ridges of stratified sand and gravel) and moraines (accumulations 47
of unconsolidated glacial debris) are common deglacial morphological features of the northern 48
hemisphere (Clark and Walder, 1994). They can be sites of unconfined to confined granular 49
aquifers, containing extensive reserves of excellent quality groundwater. Their hydrodynamics 50
are still poorly understood, mainly because of the spatial complexity and heterogeneous nature 51
of the fluvioglacial deposits (Boulton et al. 1995). 52
Peatlands are wetlands with a thick water-logged organic layer composed of living, dead 53
and decaying plant material. Ombrotrophic peatlands (bogs) are peatlands that are almost 54
exclusively rain-fed and that have a higher water table isolated from the regional groundwater 55
flow. In contrast, fens are usually fed by mineral-rich surface water or groundwater. Slope bogs 56
are bogs that have developed on a sloping mineral bedrock or on sloping sediments (defined in 57
NWWG, National Wetlands Working Group 1997). Due to their geomorphic position, slope 58
bogs are often surrounded by marginal fens which can be strongly connected to surface aquifers 59
and can receive water volumes that are not negligible for the peatland water budget or for the 60
entire ecosystem (Glaser et al. 1997). The peat system formed by a slope bog and its marginal 61
fen is hereafter named slope peatland. It is important to quantify groundwater input to slope 62
peatlands in order to understand the hydrodynamics of these environments, but this flux is 63
difficult to measure. Existing studies are mainly based on numerical modeling, water level 64
measurements and water chemistry data (e.g., Ferone and DeVito 2004; Price et al. 2005; 65
Ferlatte et al. 2015; Larocque et al. 2016). 66
Radon (222
Rn) is a noble gas produced by the radioactive decay of 226
Ra adsorbed on soil 67
grains or contained in minerals composing the aquifers (Cecil and Green, 2000). The produced 68
222
Rn is then released into the interstitial fluids by a-recoil, diffusion or weathering (Nazaroff, 69
1992). The 222
Rn in turn decays to 218
Po, with a half-life of 3.8235 days. The 222
Rn content 70
reaches secular equilibrium (i.e., its quantity remains constant because its production rate equals 71
its decay rate) after a groundwater residence time of approximately 25 days (Andrews et al. 72
1985). U-rich rocks from denuded Precambrian crystalline basements and composing eskers 73
and moraines are known to produce 222
Rn (Ek and Ek 1996; Breitner et al. 2008; Breitner et al. 74
2010), which migrates into groundwater (Morland et al. 1998; Frengstad et al. 2000; Grolander 75
2009). 76
222
Rn has successfully been used in hydrology to trace fluid exchange between aquifers 77
and surface water reservoirs such as streams (Hoehn et al. 1992; Ellins et al. 1990; Genereux 78
and Hemond, 1990; Cook et al. 2003; Smith et al. 2012; Lefebvre et al. 2015), lakes (Kluge et 79
al. 2007; Dugan et al. 2011), estuaries (Xu et al. 2014), coastal lagoons (Baudron et al. 2015), 80
and wetlands (Cook et al. 2008; Rodellas et al. 2012). Groundwater is typically enriched in 81
222
Rn compared to surface water. The latter is depleted of 222
Rn because of its rapid degassing 82
to the atmosphere. When groundwater discharges into a coastal ocean, lake or stream, 222 Rn 83
activity in the surface water reservoir increases to detectable levels. Coupled with measured 84
changes in salinity, electric conductivity or other tracers, 222Rn measurements can be used to 85
quantify these water exchanges (e.g., Stieglitz et al., 2010). 86
Because peatlands are in direct contact with the atmosphere and there is no internal 87
source of radon within the organic deposits, it is expected that they do not contain 222
Rn unless 88
it is introduced via groundwater inflow. The esker-peatland system can therefore be considered 89
comparable to the groundwater-river systems, and it is hypothesized that water exchanges can 90
be traced using 222
Rn. The objective of this work was to test 222
Rn as a tracer of water flow into 91
eskers and moraines and of inflow from eskers and moraines to slope peatlands. The research 92
was performed in the Abitibi region of southern Quebec (Canada) which has one of the highest 93
densities of eskers in the world (Veillette et al. 2003). 94
2. STUDY AREA
96
The study area (860 km2
; Fig. 1a) is located in the Abitibi region of Quebec, Canada. 97
Precambrian rocks forming the bedrock aquifer in the study area are mainly Archean mafic-98
intermediate volcanic rocks and metasediments of the Superior Province. These lithologies are 99
intruded by Archean granites and tonalites and crosscut by gneissic rocks (Weber and Latulippe 100
1964). The bedrock aquifer is characterized by low hydraulic conductivity, for which the water 101
bearing potential increases locally with fractures (Cloutier et al. 2007). 102
The Laurentide Ice Sheet retreat and deglaciation started in the Abitibi region at ~ 9 ka 103
(Dyke 2004) exposing the Precambrian basement and depositing fluvioglacial sediments to 104
form a regional landform, the Harricana interlobate moraine, along with a very dense network 105
of satellite eskers (Veillette et al. 2003). Eskers and moraines are composed of chaotic 106
accumulations of pebble, gravel and sand derived from the glacial erosion of the local Archean 107
bedrock (Veillette et al. 2004). In the study area, three major fluvioglacial landforms are found 108
from west to east (Fig. 1a): Saint-Mathieu-Berry (SMB) esker, the Harricana Moraine and the 109
Barraute esker. The SMB esker is 120 km long, 25 to 45 m thick, and 1 to 5 km wide; the 110
Harricana Moraine has a total length of 278 km and a maximum width of 4.4 km; the Barraute 111
esker is about 20 km long, and is buried over most of its length (Fig. 1a). All of them constitute 112
major granular aquifers (Veillette et al. 2004). 113
The formation of the proglacial Barlow-Ojibway Lake, and its subsequent drainage 114
towards the Tyrrell Sea 8,200 years ago (Roy et al. 2011), left behind a thick accumulation of 115
fine-grained glacio-lacustrine sediments, named the Ojibway clay. These sediments belt the 116
flanks of the SMB esker and the Harricana Moraine, and created a confining cover on the buried 117
Barraute esker. Direct recharge occurs in unconfined aquifers of the SMB esker and Harricana 118
Moraine. Veillette et al. (2007) and Boucher et al. (2015) suggested that the southern end of the 119
Harricana Moraine (Mont Video; Fig. 1a) could be a recharge area for the buried Barraute esker. 120
Groundwater flows rapidly within the highly porous (average porosity 25-30%; Cloutier 121
et al. 2013) and permeable gravel aquifers formed by eskers and moraines. Groundwater in 122
eskers is mainly of Ca-HCO3 type, with average salinity of 87 mg/L (Castelli et al. 2011). 123
Groundwater from the fractured bedrock aquifer shows higher salinity up to 760 mg/L (Table 124
1). 3 H/3
He water ages in the SMB esker and in the Harricana Moraine range from 6 to 32 yrs 125
(Boucher et al. 2015). For the fractured bedrock, groundwater residence times span from 126
1,473±300 yrs to 137±28 kyrs, suggesting the occurrence of several generations of fossil melt 127
water trapped under the clay plain following the last two glaciations (Boucher et al. 2015). 128
Slope peatlands started accumulating organic matter on esker and moraine flanks after 129
the drainage of the Ojibway Lake, as indicated by 14
C dating of basal peat ranging from 8,610 130
to 5,620 yrs (Ferlatte, 2014). The present work focuses on five slope peatlands (Fig. 1a): 131
Sources Nord (SN), Sources Sud (SS), and La Coupe (LC) which border the western flank of 132
the Harricana Moraine, La Belle (LB1, LB2) on the eastern flank of the Harricana Moraine, 133
and Saint-Mathieu-Berry (SMB) located on the eastern flank of the SMB esker. Sandy deposits 134
or clay are found next to the organic deposits and sometimes immediately underneath, forming 135
lateral extensions of local or regional features upon which the organic material has expanded 136
(hereafter called underlying mineral deposits). The peatlands show a marginal fen at their up-137
gradient limit and fingering organic deposits that drain naturally in small streams at the outer 138
peatland edge (Ferlatte et al. 2015). A regional aquifer characterization study (Cloutier et al. 139
2013) has shown that sand thickness can vary from 1 to 20 m at the peatland border (near the 140
surface aquifer), allowing lateral groundwater – peatland exchanges (Fig. 1b). Using spatio-141
temporal variations in water levels, Ferlatte et al. (2015) identified two lateral flow patterns at 142
the margin of the slope peatlands (see figures 4 and 5 in Ferlatte et al. 2015 for detailed 143
piezometric heads in all the transects and for typical lateral connections). In some peatlands 144
(LB2, SMB, SN and SS), groundwater from the surface aquifer flows into the peatland and 145
peatland water flows in the same direction. In the other peatlands (LB1 and LC), water flows 146
from a piezometric mound at station no.2 both into the surface aquifer and towards the peatland 147
center. Vertical hydraulic gradients measured by Ferlatte et al. (2015) suggest that water 148
generally flows downward, i.e., from the peatland to the underlying mineral deposits. Sporadic 149
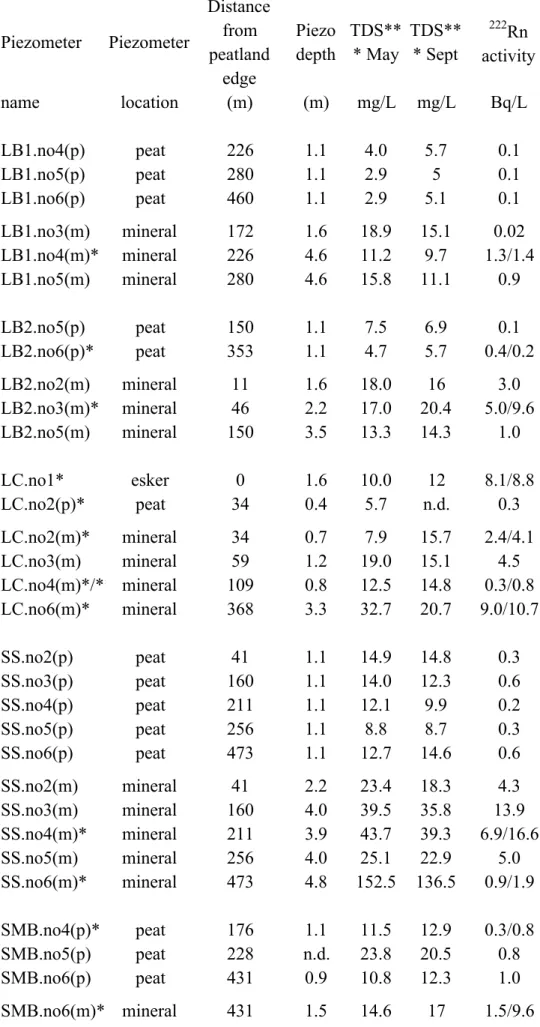
occurrences of vertical inflows were observed at LB2, SMB and SS (cf. Table 3 in Ferlatte et 150 al. 2015). 151 152 3. METHODS 153
A total of sixteen groundwater samples (Fig. 1a; Table 1) were collected in the study 154
area during the summer of 2012. Samples were collected from the Landrienne municipal well 155
and from two domestic wells in the fractured bedrock aquifer underlying the clay plain (101CH 156
and 55HB; Fig. 1a). Two wells drilled by the Quebec Ministry of Environment (MDDEP-S and 157
MDDEP-P), one piezometer drilled by the Université du Québec en Abitibi-Témiscamingue 158
(UQAT; PACES 1-03) and one domestic well at the Mont Video camping site were sampled 159
from the Harricana Moraine. The Barraute municipal well was sampled from the Barraute esker. 160
The Amos municipal well and seven piezometers (TSAM-P1, P2, TSSM-P1, P3, P5, PACES 161
1-12, 1-13) drilled and instrumented by UQAT were sampled from the SMB esker. Domestic 162
(55HB and 101CH) and municipal (Landrienne) wells in the clay plain have steel casings to the 163
bedrock, and are open from the fractured rock aquifer to the bottom of the well. All other drilled 164
piezometers have a casing and short screens (1.5 m long, except for well TSSM-P5 (3 m screen) 165
and Barraute (4.6 m screen)). The Amos municipal well is a multi-drain well with casing, 166
consisting of eight horizontal drains extending from the base of the vertical borehole with 167
variable lengths of between 7.2 and 45.8 m and a diameter of 0.2 m. Screens cover between 70 168
and 90% of the horizontal drain length. 169
In 2010, five peatlands (Fig. 1a) were instrumented with transects of six piezometric 170
stations (Fig. 1b). In each peatland, one or two transects were positioned perpendicular to the 171
peatland margin, in the direction of potential lateral groundwater flow. Transects LB1 and LB2 172
were located 690 m apart and parallel to each other. For each transect, one piezometer was 173
installed in the surface aquifer (station no.1) while nests of two piezometers were installed in 174
the peatland (stations no.2 to 6). The nests were composed of a surface piezometer (referred to 175
as “(p)” for peat), at a maximum depth of 1.1 m in the peat, and a deep piezometer, 40 cm below 176
the mineral-peat interface (slotted section located in the underlying mineral deposits; referred 177
to as “(m)” for mineral). Each piezometer is made up of a 2.5 cm-ID-PVC pipe, slotted over 178
the lower 30 cm and sealed at the base. In the shallow aquifer (station no. 1; Fig. 1b), the 179
piezometers were installed using an auger and sufficiently deep to ensure that they reach the 180
water table. The shallow piezometer was located within 10 m of the peatland margin; station 181
no.2 is located as close as possible to the peatland margin, where peat thickness reaches 40 cm; 182
station no.3 is located where significant changes in vegetation are observed (transition from a 183
fen vegetation to a bog vegetation); stations no.4, 5, and 6 are approximately 50, 100 and 300 m 184
away from station no.3 respectively (Fig. 1b) (Ferlatte et al., 2015). Major ions and trace 185
elements were measured from water sampled at each of the stations (Ferlatte, 2014; Larocque 186
et al. 2016). Ferlatte et al. (2015) used slug tests in temporary piezometers to measure peat 187
hydraulic conductivities between stations no.2 and 3. Their results showed that hydraulic 188
conductivities decrease with depth and for the SMB peatland vary between 5.5x10⁻⁶ m.s-1 at 189
0.50-0.75 m to 6.9x10⁻⁷ m.s-1 at 1.00-1.25 m below the surface.
190
In the municipal wells (Amos, Landrienne, and Barraute), groundwater was collected 191
directly at a faucet connected directly to the wellhead. Groundwater from the monitoring wells 192
and the peatland piezometers was collected using a Waterra®
Inertial Pump System which 193
consists of a foot valve located at the bottom of a high-density polyethylene tube with a variable 194
diameter of 5/8” to 1” and an electric actuator Hydrolift-2®
pump. Groundwater from domestic 195
wells (55HB, 101CH, Mont Video) was collected at the water faucet closest to the well, outside 196
the house to avoid home reservoirs where the water undergoes degassing. Water was purged 197
from monitoring wells until electrical conductivity, pH, and temperature stabilized. Peatland 198
piezometers were purged to ensure the collection of fresh water. Sampling was done three days 199
following the purge to allow time for water level recovery and thus to have a sufficient volume 200
of water to be recovered in our sampling vessels. A volume of water equivalent to the length of 201
the piezometer was purged prior of sampling to be sure that no stagnant degassed water was 202
collected. Radon was collected using 250 cm3
glass bottles by inserting a PVC tube to the 203
bottom. We ensured a constant and low flux of water pumped by the Waterra®
to avoid water 204
agitation and bubbling, which could provoke radon degassing. Once filled, the bottle was 205
rapidly sealed with a plastic cap and examined visually for the presence of any air bubble 206
(Leaney and Herczeg, 2006). The bottles were labeled with the time of sampling in order to 207
correct the measured 222
Rn activities of the time lap between field collection and laboratory 208
analyses. 209
Only 40 peatland piezometers (of a total of 57) contained sufficient water to allow robust 210
222
Rn analysis. In 12 piezometers, there was enough water to take two consecutive samples for 211
222
Rn analyses. The 222
Rn activity was measured with a liquid alpha scintillation counter (Hidex, 212
LS 300) in the GEOTOP laboratories, Université du Québec à Montréal. Scintillometer 213
efficiency was calibrated using international standards. Sampling and analysis protocols were 214
optimized and analytical tests were performed to obtain the best accuracy and precision of 222 Rn 215
activity in a continuous interval from 0.5 to 35 Bq/L. Sample preparation for 222
Rn measurement 216
was performed using the extraction method (EM; Leaney and Herczeg 2006) as follows: 25 217
cm3 of scintillant were mixed with the entire volume of sampled water (250 cm3). 218
Approximately 10 cm3
of air were introduced into the glass bottle to facilitate emulsion between 219
water and the scintillant. The cocktail was mixed for 4-5 min and left to stand until phases 220
separate. A volume 8 cm3
of scintillant was then extracted and added to the counting glass vials. 221
During calibration, mean background noise values were smaller than 0.12 Bq/L, with an 222
average error of 4% for the analysis. Data reported here are corrected for the background noise. 223
Details of the sample preparation and analyses are given in Lefebvre et al. (2013) and Pinti et 224
al. (2014). 225
Five water samples (LB2.no2(m), LB2.no3(m), SN.no2(m), SMB.no2(p) and 226
SMB.no3(m); Table A1) contained 10 to 30% suspended particles volumetrically. These 227
particles can contribute to a sustained flux of 222
Rn in water through the decay of 226
Ra adsorbed 228
on the clay or organic particles. To quantify this flux, the 226
Ra activity from the solid phase 229
was measured at the GEOTOP, using a high-purity Germanium well detector gamma-ray 230
spectrometer equipped with an ORTEC® DSPEC jr. 2.0 interface. Eight grams of soil matrix 231
from the five samples were closed and left in vials for at least 25 days to ensure that secular 232
equilibrium between 226
Ra and 222
Rn was reached. The 226
Ra activity was obtained by measuring 233
the peak of 214Pb at 352 keV and 295.2 keV, and the peak of 214Bi at 609keV (see Pickler et al., 234
2012 for details). Results are reported in appendix (Table A1) together with a discussion on the 235
contribution of 226
Ra to peat water samples. 236
Uranium (U) concentration in peatland sediments was calculated from the 226
Ra activity 237
at 352 keV and assuming secular equilibrium (1 ppm U = 12.34 Bq/kg 226
Ra). The U content in 238
rocks composing the aquifer matrix of the eskers and moraines was measured on selected rock 239
samples collected in a quarry on the top of the Harricana Moraine. The U content was 240
determined by neutron activation at the Slowpoke reactor of the Physics Department of the 241
Université de Montréal. Results are reported also in Table A1 in the appendix. 242
In eight piezometers (LB2.no6(p), SS.no6(p), SMB.no6(p), SN.no2(p), SN.no3(p), 243
SN.no4(p), SN.no5(p), SN.no6(p)), the volume of water available was sufficient to be pumped 244
through refrigerator-type copper tubes with stainless steel clamps at each extremity while 245
avoiding contact with ambient air (e.g., Boucher et al., 2015). A 14 cm3
volume of water was 246
trapped in the copper tube and then degassed under vacuum at the Noble Gas Laboratory of the 247
GEOTOP to measure noble gas contents. These analyses were aimed at testing whether we can 248
use atmosphere-derived noble gas isotopes 36 Ar, 84
Kr and 132
Xe dissolved in peatland water as 249
an indicator of water degassing and thus be able to relate radon variability in sampled peatlands 250
to local degassing in the peatland system or to the natural variability of radon in water systems, 251
which is very often observed (e.g., Harris et al. 2006). Water was degassed under vacuum and 252
purified to analyze the single isotopes by using a quadrupole mass spectrometer (QMS) Prisma-253
200C from Pfeiffer®, equipped with a Faraday cup and a channeltron multiplier. The 254
instrument was calibrated daily with a purified air standard. Analytical details on noble gas 255
measurements are reported in Roulleau et al. (2012). Results are reported in appendix Table A2. 256 257 3. RESULTS 258 222
Rn activities measured in esker and moraine groundwater were found to range from 259
2.8 (PACES 1-13; SMB esker) to 12.5 Bq/L (PACES 1-03; Harricana Moraine) (Table 1). 260
Groundwater from the fractured bedrock aquifer underlying the Ojibway clay plain shows 261
higher 222
Rn activity, ranging from 14.7 (101CH) to 34.9 Bq/L (Landrienne municipality well) 262
(Table 1). The Amos municipal well was sampled twice and the obtained 222Rn activities were 263
11.1 and 11.5 Bq/L. The TDS (Table 1) was calculated as the sum of the measured dissolved 264 major ions, Ca2+ , Mg2+ , Na+ , K+ , Cl -, SO4 2-, and HCO3
-. The TDS is higher in the fractured 265
bedrock (ranging from 351 to 763 mg/L) than in the eskers and moraine aquifers (ranging from 266
45 mg/L at Mont Video to 251 mg/L in the Barraute municipality well). 267
The 222
Rn activities measured in peat water range from 0.1 (LB1.no5(p)) to 1.0 Bq/L 268
(SMB.no6(p)), while groundwater from the mineral deposits underlying the peatland shows 269
higher and more variable 222
Rn activity, ranging from 0.02 (LB1.no3(m)) to 16.6 Bq/L 270
(SS.no4(m)) (Table 2). One piezometer (LC.no1) was installed on the esker, at the edge of the 271
peatland, and its 222Rn activity (8.1 and 8.8 Bq/L; Table 2) relates to groundwater inflow. Two 272
consecutive water samples were taken from twelve piezometers for 222
Rn analyses, when the 273
volume of water in the piezometer was sufficient (Table 2). In general, the second sample shows 274
higher 222
Rn activity than the first. This could indicate water stratification in the peatland. Water 275
sampled first might be partially stagnant and degassed of its 222
Rn content. The second sample 276
might represent deeper water, isolated from the atmosphere and having preserved the total 277
amount of dissolved 222
Rn. As mentioned in the “Methods” section, a third consecutive sample 278
of water was taken into copper tubes to measure the atmospheric noble gas composition 279
whenever there was sufficient water (Appendix). Results (Table A2) show that samples 280
LB2.no6(p) and SMB.no6(p) clearly underwent degassing (16-32% and 36-42% of the total, 281
respectively). For all the other samples, degassing was minimal (2-3%) or practically null 282
(Table A2), indicating that deeper water is less affected by degassing and that the purged 283
volume of water should be increased to avoid the risk of collecting degassed samples (e.g., 284
Harris et al. 2006). 285
TDS concentrations for peat water and for water in the underlying mineral deposits were 286
calculated as the sum of the dissolved major ions for the May and September 2011 samplings 287
of Ferlatte (2014). With a few exceptions, TDS values in May and September were similar and 288
the average TDS value was considered sufficiently representative to be used henceforth. 289
Average TDS values range from 4.0 to 22.2 mg/L in the peat water and from 10.4 to 41.5 mg/L 290
in the underlying mineral deposits. One outlier (sample SS.no6(m)) shows much higher TDS, 291
with an average concentration of 144.5 mg/L (Table 2). 292
293
4. DISCUSSION
4.1 222
Rn activity in eskers and peat water: comparison with similar environments
295
Very few data of 222
Rn activity in groundwater from eskers and moraines exist in 296
literature. Indeed, the majority of the studies are for soil gas radon carried out for environmental 297
and health issues (e.g., Akerblom et al., 1994). Results for the current study are compared to 298
the few data existing from shallower wells tapping groundwater from Quaternary deposits 299
(eskers and moraines) in Scandinavian regions. In these regions, fluvioglacial deposits are 300
derived from the denudation of Archean igneous and metamorphic rocks, similarly to those of 301
the Canadian Precambrian Shield of Abitibi. Fennoscandian fluvioglacial Quaternary deposits 302
are geologically the equivalent of those of Abitibi. 303
The average 222
Rn activity of 7.7 Bq L-1
in groundwater from eskers and moraine of the 304
Abitibi region are in the lower ends of the values measured in shallow wells from esker-covered 305
Fennoscandian regions (up to 70 Bq/L; Banks et al. 1998; Vesterbacka et al. 2005; Grolander 306
2009; Fig. 2a). The lower 222
Rn activity measured in the Amos region esker and moraines are 307
likely related to the lower U content in these rocks compared those from the Fennoscandian 308
shield. U contents are relatively low, between 0.2 to 0.9 ppm as measured in Harricana Moraine 309
sediments (Table A2). Fennoscandian granites and metamorphic rocks are known to contain 310
notable amounts of U (several tenths or hundreds ppm), producing high 222
Rn activity 311
(Frendgstad et al. 2000). For example, in deep wells drilled directly in the granitic bedrock of 312
the Fennoscandian craton, measured 222
Rn activities are extremely high, with values ranging 313
from 700 to 30,000 Bq/L (Frendgstad et al. 2000). In the Amos region, the maximum 222Rn 314
activity from wells tapping water directly from the crystalline basement is 34.9 Bq/L 315
(Landrienne municipality well; Table 1). 316
In the Amos region, 222
Rn activity expected in esker/moraine groundwater or from the 317
crystalline basement can be estimated from the U content of the rock (0.2-0.9 ppm), using the 318
Eqn. A1 in the appendix. However, because it is assumed that the secular equilibrium between 319
226
Rasediment and 222
Rnwater has been reached in the aquifer (t = 25 days; Andrews et al. 1985), the 320
term 1-elt
Eqn. A1 can be ignored. Resulting 222
Rn activity in groundwater varies from 1.8 to 321
25.6 Bq/L, in the range of the measured values (Table 1). 322
Because there are no other study of 222
Rn in peatlands, measured 222
Rn activities in peat 323
water from the current study were compared with those from other wetland environments, such 324
as coastal wetlands and mangrove sites (Cook et al. 2003; Cook et al. 2008; Gleeson et al. 2013; 325
Maher et al. 2013; Zarroca et al. 2013; Fig. 2b). 222
Rn activities from these environments can 326
be compared to those from the slope peatlands set on eskers because they are expected to have 327
accumulated some 222
Rn, mainly from radium originating in the mineral substratum and from 328
groundwater 222
Rn. It is clear that this is a first-order approximation because of the different 329
hydrological dynamics that distinguish these wetland environments. The majority of the 330
shallower peat water samples from this study (designated “p” in Table 2), show 222
Rn activities 331
lower than 1 Bq/L, similar to the range of activities measured in the other wetland environments 332
(Fig. 2b). This minimum activity of 1 Bq/L probably translates the equilibrium between 222 Rn 333
produced in the aquifer rocks and that degassed to the atmosphere. Water samples from the 334
mineral substratum of the peatland show 222
Rn activities significantly higher than reported in 335
the wetlands literature (up to 16.6 Bq L-1
) and comparable to those from the eskers or the 336
fractured bedrock (Table 1). 337
338
4.2 222
Rn and TDS in peatland water as an indicator of water mixing and residence time
339
222
Rn activities recorded in water from the peat (shallower piezometers “p”) has an 340
average222
Rn activity of 0.36 Bq/L, while water from the mineral substratum (deeper 341
piezometers “m”) has an average 222
Rn activity of 4.7 Bq/L (Fig. 2b). The observed difference 342
can be accounted for 1) degassing of radon towards the atmosphere in piezometers located 343
closer to the surface, or 2) dilution from rainwater depleted in 222 Rn. 344
There is a clear trend between the TDS (salinity) and the 222
Rn activity measured in the 345
mineral substratum water (black dots; Fig. 3) which is not present for the peat water samples 346
(white circles; Fig. 3). This trend has been observed in studies of groundwater discharge in 347
coastal wetlands (Rodellas et al., 2012) and of coastal aquifer interactions with seawater (e.g., 348
Stieglitz et al., 2010). In the latter case, the observed trend would be the opposite of that 349
observed here, i.e. low salinity, high 222
Rn groundwater mixes with high salinity, 222
Rn-depleted 350
seawater. In order to observe a trend between a conservative tracer such as salinity and a non-351
conservative tracer such as 222
Rn (Fig. 3), which is affected by radioactive decay and degassing, 352
the residence time of 222
Rn in the wetland must be short, i.e. there has to be a continuous inflow 353
of 222
Rn rich groundwater from the eskers/moraines. Longer residence times will lead to a less 354
clear trend because of the radioactive decay of 222
Rn. The trend observed in deeper piezometers 355
in the mineral substratum clearly indicates that mixing between two sources of water and 222 Rn 356
dominates radioactive decay and degassing (Stieglitz et al., 2010). The mixing would be 357
between high TDS and 222
Rn-rich groundwater from eskers/moraines which is progressively 358
diluted by peat water depleted in both TDS and 222Rn (Fig. 3). This mixing implies that the 359
blurring of the TDS-radon relation in the shallower piezometers can be caused only by 360
degassing of 222
Rn close to the surface. 361
Based on the TDS-222
Rn relationship (Fig. 3), the TDS of the peat water (i.e. when 222 Rn 362
reach zero at the abscissa intercept) is ~12 mg/L which can be interpreted as a threshold below 363
which there is no more 222Rn-rich groundwater inflow into the peatland. This threshold is 364
compatible with the independent calculation of 16 mg/L derived by Larocque et al. (2016) for 365
the peat water using major ions geochemistry. Figure 4 summarizes the possible 222
Rn sources 366
and pathways between the eskers and the slope peatlands. 367
368
4.3 Limitations and improvements
It is clear from the results of this study that much work remains to be done to improve 370
both the sampling techniques, particularly in the peat layer where the water volumes necessary 371
to reliably detect and measure 222Rn are limiting. In situ repeated measurements using a portable 372
radon scintillometer would limit the amount of water used and increase the precision of the 373
measurement. The few atmospheric-derived noble gas data obtained in this study suggest that 374
their systematic analyses together with radon will be extremely helpful in determining 375
degassing processes in situ in order to understand the measured variability in radon in repeated 376
measurements. Use of passive diffusion samplers, i.e. devices in which gas diffuses through a 377
semi-permeable membrane connected to a small-volume copper tube (e.g., Aeschbach-Hertig 378
and Solomon, 2013) inserted at the bottom of the peatland piezometers might be ideal for 379
measuring with precision the degassing conditions of the water in the peat layer. Finally, 380
dedicated nests of several piezometers inserted into the peat and the underlying mineral deposits 381
at different depths at each location could be useful to measure 222
Rn activity gradients in order 382
to quantify flows and determine their dominant directions. 383
384
5. CONCLUSIONS
385
The objective of this work was to test 222
Rn as a potential tracer of groundwater inflow 386
from eskers and moraine to slope peatlands in the region of Amos, Quebec. The distribution of 387
222
Rn measured in eskers/moraine and in slope peatlands of the Abitibi region shows that its 388
activity in eskers is enriched by on average one order of magnitude compared to that measured 389
within the peatlands, mainly because 222
Rn is degassed to the atmosphere in the shallower peat 390
layer. The measured 222
Rn activity in the eskers and moraine is compatible with the values 391
expected at secular equilibrium with its progenitor, 226
Ra contained in the aquifer rocks. The 392
observed relationship between 222Rn and TDS in the mineral deposits below the peatlands 393
indicate a mixing between two water sources, one enriched in salt and 222
Rn which could be 394
identified as groundwater in flowing into peatlands. This work also highlights the limitation of 395
the method and in situ measurements of 222
Rn, possibly continuous monitoring of 222
Rn and 396
other parameters such as salinity could be the key to quantify groundwater inflows into 397 peatlands. 398 399 ACKNOWLEDGEMENTS 400
This study was funded by the Fonds de Recherche Québec - Nature et Technologie (project no. 401
136990 of the Programme de recherche en partenariat sur les eaux souterraines du Québec to 402
DLP, MR and ML) and NSERC Discovery Grant no. 314496 to DLP. The municipalities of
403
Amos, Landrienne and Barraute, as well as D. Blanchette (UQAT), C. Boucher, P. Méjean and 404
G. Vautour (GEOTOP-UQAM) are thanked for their help and cooperation during sampling. 405
REFERENCES
407
Aeschbach-Hertig, W., Solomon, D. K., 2013. Noble Gas Thermometry in Groundwater 408
Hydrology. In: Burnard, P. (Ed.), The Noble Gases as Geochemical Tracers, Advances in 409
Isotope Geochemistry, Springer-Verlag Berlin Heidelberg, pp. 81-122. doi: 10.1007/978-3-410
642-28836-4_5. 411
Akerblom, G. 1994. Ground radon - monitoring procedures in Sweden. Geoscientist 4, 21-27. 412
Andrews, J.N., Goldbrunner, J.E., Darling, W.G., Hooker, P.J., Wilson, G.B., Youngman, M.J., 413
Eichinger, L., Rauert, W., Stichler, W., 1985. A radiochemical, hydrochemical and dissolved 414
gas study of groundwaters in the Molasse basin of Upper Austria. Earth Planet. Sci. Lett. 73, 415
317-332. doi:10.1016/0012-821X(85)90080-9. 416
Banks, D., Frengstad, B., Midtgard, A.K., Krog, J.R.,Strand, T., 1998. The chemistry of 417
Norwegian groundwaters: I. The distribution of radon, major and minor elements in 1604 418
crystalline bedrock groundwaters. Sci. Total Environ. 222, 71-91. doi:10.1016/S0048-419
9697(98)00291-5. 420
Baudron, P., Cockenpot, S., Lopez-Casteljon, F., Radakovitch, O., Gilabert, J., Mayer, A., 421
Garcia-Arostegui, J.L., Martinez-Vicente, D., Leduc, C., Claude, C.,2015. Combining 422
radon, short-lived radium isotopes and hydrodynamic modeling to assess submarine 423
groundwater discharge from an anthropized semiarid watershed to a Mediterranean lagoon 424
(Mar Menor, SE Spain). J. Hydrol. 525, 55-71. 425
Bonotto, D.M., Caprioglio, L., 2002. Radon in groundwaters from Guarany aquifer, South 426
America: environmental and exploration implications. Appl. Rad. Isotopes 57, 931-940. 427
doi:10.1016/S0969-8043(02)00230-0. 428
Boucher, C., Pinti, D.L., Roy, M., Castro, M.C., Cloutier, V., Blanchette, D., Larocque, M., 429
Hall, C.M., Wen, T., Sano, Y., 2015. Groundwater age investigation of eskers in the Amos 430
region, Quebec, Canada. J. Hydrol. 524, 1-14. doi:10.1016/j.jhydrol.2015.01.072 431
Boulton, G.S., Caban, P.E., Van Gijssel, K., 1995. Groundwater flow beneath ice sheets: part I 432
– Large scale patterns. Quarter. Sci. Rev. 14, 545-562. doi:10.1016/0277-3791(95)00039-R. 433
Breitner, D., Turtiainen, T., Arvela, H., Vesterbacka, P., Johanson, B., Lehtonen, M., Hellmuth, 434
K.-H., Szabó, C., 2008. Multidisciplinary analysis of Finnish esker sediment in radon source 435
identification. Sci. Total Environ. 405, 129-139. doi: 10.1016/j.scitotenv.2008.06.015. 436
Breitner, D., Arvela, H., Hellmuth, K.-H., Renvall, T., 2010. Effect of moisture content on 437
emanation at different grain size fractions – A pilot study on granitic esker sand sample. J. 438
Environ. Radioact. 101, 1002-1006. doi: 10.1016/j.jenvrad.2010.07.008 439
Castelli. S., Cloutier, V., Blanchette, D., 2011. Hydrogéochimie et qualité de l’eau des sources 440
associées aux eskers de l’Abitibi, Québec. Proc Geohydro 2011 Joint/IAH-CNC, Québec, 4. 441
Cecil, C.D.L., Green, J., 2000. Radon-222. In: Cook, P., Herczeg, A.L., (Eds.) Environmental 442
tracers in subsurface hydrology), Kluwer Academic Publisher, Amsterdam, pp. 175-194. 443
Clark, P.U., Walder, J.S., 1994. Subglacial drainage, eskers, and deforming beds beneath the 444
Laurentide and Eurasian ice sheets. GSA Bull. 106, 304-314. doi: 10.1130/0016-7606. 445
Cloutier, V., Veillette, J., Roy, M., Gagnon, F., Bois, D., 2007. Regional hydrogeochemistry of 446
groundwater in fractured Canadian Shield rock and glaciofluvial formations in Abitibi, 447
Québec. Proc 60th Canadian Geotechnical Conference and 8th Joint CGS/IAH-CNC 448
Groundwater Conference, Ottawa, pp. 355-362. 449
Cloutier, V., Blanchette, D., Dallaire, P.-L., Nadeau, S., Rosa, E., Roy, M., 2013. Projet 450
d’acquisition de connaissances sur les eaux souterraines de l’Abitibi-Témiscamingue (partie 451
1). Research report P001. GRES, IRME, Université du Québec en Abitibi-Témiscamingue, 452
135p. 453
Cook, P.G., Favreau, G., Dighton, J.C., Tickell, S., 2003. Determining natural groundwater 454
influx to a tropical river using radon, chlorofluorocarbons and ionic environmental tracers. 455
J. Hydrol. 227, 74–88. doi: 10.1016/S0022-1694(03)00087-8. 456
Cook, P.G., Wood, C., White, T., Simmons, C.T., Fass, T., Brunner, P., 2008. Groundwater 457
inflow to a shallow, poorly mixed wetland estimated from a mass balance of radon. J. 458
Hydrol. 354, 213-226. doi: 10.1016/j.jhydrol.2008.03.016. 459
Dugan, H.A., Gleeson, T., Lamoureux, S.F., Novakowski, K., 2011. Tracing groundwater 460
discharge in a High Arctic lake using radon-222. Environ. Earth Sci. 66, 1385-1392. doi: 461
10.1007/s12665-011-1348-6. 462
Dyke, A.S., 2004. An outline of North American deglaciation with emphasis on central and 463
northern Canada. In: Ehlers, J., Gibbard, P.L. (Eds.) Quaternary glaciations – Extent and 464
chronology, Part II: North America. Elsevier, Amsterdam, pp. 373-424. 465
Ek, J., Ek, B., 1996. Radium and uranium concentrations in two eskers with enhanced radon 466
emission. Environ Int. 22 (suppl. 1), 495-498. doi 10.1016/S0160-4120(96)00151-1. 467
Ellins, K.K., Roman-Mas, A., Lee, R., 1990. Using 222
Rn to examine groundwater/ surface 468
discharge interaction in the Rio Grande de Manati, Puerto Rico. J. Hydrol. 115, 319–341. 469
doi: 10.1016/0022-1694(90)90212-G. 470
Ferlatte, M., 2014. Geochemical tracers of recharge-discharge functions in southern Québec 471
aquifer-peatland systems. MSc Dissertation, Université du Québec à Montréal. 472
Ferlatte, M., Quillet, A., Larocque, M., Cloutier, V., Pellerin, S., Paniconi, C., 2015. Aquifer-473
peatland connectivity in southern Quebec (Canada). Hydrol. Proc. 29, 2600-2612. 474
Ferone, J.M., Devito, K.J., 2004. Shallow groundwater–surface water interactions in pond– 475
peatland complexes along a Boreal Plains topographic gradient. J. Hydrol. 292, 75-95. doi: 476
10.1016/j.jhydrol.2003.12.032. 477
Frengstad, B., Midtgård Skrede, A.K., Banks, D., Reidar Krog, J., Siewers, U., 2000. The 478
chemistry of Norwegian groundwaters: III. The distribution of trace elements in 476 479
crystalline bedrock groundwaters, as analysed by ICP-MS techniques. Sci. Total Environ. 480
246, 21-40. 481
Genereux, D.P., Hemond, H.F., 1990. Naturally occurring radon-222 as a tracer for streamflow 482
generation: steady state methodology and field example. Water Resour. Res. 26, 3065–3075. 483
doi: 10.1029/WR026i012p03065. 484
Glaser, P.H., Siegel, D.I., Romanowicz, E.A., Shen, Y.P., 1997. Regional linkages between 485
raised bogs and the climate, groundwater, and landscape of north-western Minnesota. J. 486
Ecol. 85, 3-16. 487
Gleeson, J., Santos, I.R., Maher, D.T., Golsby-Smith, L., 2013. Groundwater-surface water 488
exchange in a mangrove tidal creek: Evidence from natural geochemical tracers and 489
implications for nutrient budgets. Mar. Chem. 156, 27-37. doi: 490
10.1016/j.marchem.2013.02.001. 491
Grolander, S., 2009. Radon as a groundwater tracer in Forsmark and Laxemar. Svensk 492
Kärnbränslehantering AB., SKB Rapport R-09-47, pp. 57. 493
Harris, S.A., Billmeyer, E.R., Robinson, M.A., 2006. Evaluation of repeated measurements of 494
radon-222 concentrations in well water sampled from bedrock aquifers of the Piedmont near 495
Richmond, Virginia, USA: Effects of lithology and well characteristics. Environ. Res. 101, 496
323-333. 497
Hoehn, E., von Gunten, H.R., 1989. Radon in groundwater: a tool to assess infiltration from 498
surface waters to aquifers. Water Resour. Res. 25,1795–1803. doi: 499
10.1029/WR025i008p01795. 500
Kluge, T., Ilmberger, J., von Rohden, C., Aeschbach-Hertig, W., 2007. Tracing and quantifying 501
groundwater inflow into lakes using a simple method for radon-222 analysis. Hydrol. Earth 502
System Sci. 11, 1621-1631. doi: 10.5194/hess-11-1621-2007. 503
Larocque, M., Ferlatte, M., Pellerin, S., Cloutier, V., Munger, J., Quillet, A., Paniconi, C., 2016. 504
Chemical and botanical indicators of groundwater inflow to ombrotrophic peatlands. Ecol. 505
Indicators 64,142-151. doi: 10.1016/j.ecolind.2015.12.012. 506
Leaney, F.W., Herczeg, A.L., 2006. A rapid field extraction method for determination of radon-507
222 in natural waters by liquid scintillation counting. Limnol. Oceanogr.: Methods, 4, 254– 508
259. doi: 10.4319/lom.2006.4.254 509
Lefebvre, K., Barbecot, F., Ghaleb, B., Larocque, M., Gagné, S., 2013. Full range determination 510
of 222
Rn at the watershed scale by liquid scintillation counting. Appl. Rad. Isotopes 75, 71-511
76. doi: 10.1016/j.apradiso.2013.01.027. 512
Lefebvre, K., Barbecot, F., Larocque, M., Gillon, M., 2015. Combining isotopic tracers (222 Rn 513
and d13
C) for improved modelling of groundwater discharge to small rivers. Hydrol Proc. 514
29, 2814–2822. doi: 10.1002/hyp.10405. 515
Maher, D.T., Santos, I.R., Golsby-Smith, J., Gleeson, J., Eyre, B.D., 2013. Groundwater 516
derived dissolved inorganic and organic carbon exports from a mangrove tidal creek: The 517
missing mangrove carbon sink? Limnol. Oceanogr. 58, 475-488. doi: 518
10.4319/lo.2013.58.2.0475. 519
Morland, G., Strand, T., Furuhaug, L., Skarphagen, H., Banks, D., 1998. Radon in quaternary 520
aquifers related to underlying bedrock geology. Ground Water 36, 143-146. 521
Nazaroff, W.W., 1992. Radon transport from soil to air. Rev. Geophys. 30, 137-160. doi: 522
10.1029/92RG00055. 523
Nazaroff, W.W., Nero, A.V., 1988. Radon and its decay products in indoor air. John Wiley and 524
Sons Inc., New York. 525
NWWG (National Wetlands Working Group), 1997. The Canadian wetland classification 526
system. 2nd
edition. University of Waterloo, Waterloo, Ontario. 527
Pickler, C., Pinti, D.L., Ghaleb, B., Garduno-Monroy, V.H., Tremblay, A., 2012. Radium 528
depletion and 210 Pb/226
Ra disequilibrium of Marítaro hydrothermal deposits, Los Azufres 529
Geothermal Field, Mexico. Geochem J. 46, 493-504. 530
Pinti, D.L., Retailleau, S., Barnetche, D., Moreira, F., Moritz, A.M., Larocque, M., Gélinas, Y., 531
Lefebvre, R., Hélie, J.-F., Valadez, A., 2014. 222
Rn activity in groundwater of the St. 532
Lawrence Lowlands, Quebec, eastern Canada: relation with local geology and health hazard. 533
J. Environ. Radioact. 136, 206-217. doi: 10.1016/j.jenvrad.2014.05.021. 534
Price, J.S., Braunfireun, B., Waddington, J.M., Devito, J.K., 2005. Advances in Canadian 535
wetland hydrology, 1999–2003. Hydrol. Proc. 19, 201–214. doi: 10.1002/hyp.5774. 536
Rodellas, V., Garcia-Orellana, J., Garcia-Solsona, E., Masqué, P., Domínguez, J.A., 537
Ballesteros, B.J., Mejías, M., Zarroca, M., 2012. Quantifying groundwater discharge from 538
different sources into a Mediterranean wetland by using 222
Rn and Ra isotopes. J. Hydrol. 539
466-467, 11-22. doi: 10.1016/j.jhydrol.2012.07.005. 540
Roulleau, E., Pinti, D.L., Stevenson, R.K., Takahata, N., Sano, Y., Pitre, F., 2012. N, Ar and 541
Pb isotopic co-variations in magmatic minerals: Discriminating fractionation processes from 542
magmatic sources in Monteregian Hills, Québec, Canada. Chem. Geol. 326–327, 123–131. 543
doi:10.1016/j.chemgeo.2012. 07.016. 544
Roy, M., Dell’Oste, F., Veillette, J.J., de Vernal, A., Hélie, J.F., Parent, M., 2011. Insights on 545
the events surrounding the final drainage of Lake Ojibway based on James Bay stratigraphic 546
sequences. Quarter. Sci. Rev. 30, 682-692. doi: 10.1016/j.quascirev.2010.12.008. 547
Smith, S.P., Kennedy, B.M., 1983. The solubility of noble gases in water and NaCl brine. 548
Geochim. Cosmochim. Acta 47, 503–515. 549
Smith, C.G., Swarzenski, P.W., Dimova, N.T., Zhang, J., 2012. Natural radium and radon 550
tracers to quantify water exchange and movement in reservoirs. In: Baskaran, M. (Ed.) 551
Handbook of environmental isotope geochemistry. Springer, Berlin Heidelberg, pp. 345-552
365. 553
Stieglitz, T.C., Cook, P.G. and Burnett, W.C., 2010. Inferring coastal processes from regional-554
scale mapping of 222
Radon and salinity: examples from the Great Barrier Reef, Australia. J. 555
Environm. Radioact. 101, 544-552. 556
Veillette, J.J., Paradis, S.J., Thibaudeau, P., 2003. Les cartes de formation en surface de 557
l’Abitibi. Geological Survey of Canada, Open File 1523, 10 maps, 1:100 000 scale. 558
Veillette, J.J., Maqsoud, A., De Corta, H., Bois, D., 2004. Hydrogéologie des eskers de la MRC 559
d’Abitibi, Québec. Proc 57th Canadian Geotechnical Conference, 5th Joint CGS/IAH-560
CNC Conference, Québec, October 2004, session 3B2, pp. 6-13. 561
Veillette, J.J., Cloutier, V., de Corta, H., Gagnon, F., Roy, M., Douma, M., Bois, D., 2007. A 562
complex recharge network, the Barraute Esker, Abitibi, Québec. Proc 60th
Canadian 563
Geotechnical Conference and 8th Joint CGS/IAH-CNC Groundwater Conference, Ottawa, 564
Canada, pp. 347-354. 565
Vesterbacka, P., Mäkeläinen, I., Arvela, H., 2005. Natural radioactivity in drinking water in 566
private wells in Finland. Radiat. Prot. Dosim. 113, 223-232. doi: 10.1093/rpd/nch446. 567
Weber, W.W., Latulippe, M., 1964. Amos-Barraute Area, Abitibi East County. Quebec 568
Department of Natural Resources and Mines Branch, Geological Report 109, pp. 3-7. 569
Xu, B., Xia, D., Burnett, W.C., Dimova, N.T., Wang, H., Zang, L., Gao, M., Jiang, M., Yu, Z., 570
2014. Natural 222Rn and 220Rn indicate impact of the Water-Sediment Regulation Scheme 571
(WSRS) on submarine groundwater discharge in the Yellow River estuary, China. Appl 572
Geochem 51: 79-85. 573
Zarroca, M., Linares, R., Rodellas, V., Garcia-Orellana, J., Roqué, C., Bach, J., Masqué, P., 574
2013. Delineating coastal groundwater discharge processes in a wetland area by means of 575
electrical resistivity imaging, 224
Ra and 222
Rn. Hydrol. Proc. 28, 2382–2395. doi: 576
10.1002/hyp.9793. 577
FIGURE CAPTIONS
578 579
Figure 1. (a) Schematic map of the sampled area, with the position of the Saint-Mathieu-Berry
580
(SMB) esker, the Barraute esker and the Harricana Moraine. Black circles are groundwater 581
wells located on the Harricana Moraine, white circles are groundwater wells located on the 582
SMB and Barraute eskers, and grey squares are groundwater wells tapping the fractured 583
bedrock aquifer. Grey zones represent the areal extent of the monitored peatlands with white 584
squares indicating the location of the instrumented transects. (b) Schematic profile showing 585
how peatlands were instrumented with piezometers (modified from Ferlatte et al. 2015). 586
587
Figure 2. Measured 222
Rn activities a) in wells located in esker, moraine and bedrock aquifers, 588
and b) within the peatlands and in the mineral deposits underlying the peatlands, compared with 589
literature values from similar environments. References are: [1] Gronlander 2009; [2] 590
Vesterbacka et al. 2005; [3] Banks et al. 1998; [4] Zarroca et al. 2013; [5] Cook et al. 2008; [6] 591
Gleeson et al. 2013. 592
593
Figure 3. 222
Rn activity measured in water from the peat layer (white circles) and in the 594
underlying mineral deposits (black circles), plotted against TDS. The TDS is the average of the 595
two measured values (May and September 2011), and the vertical error bars represent the 596
maximum and minimum values (see Table 2 and Ferlatte, 2014). For the piezometers with an 597
asterisk in Table 2, the symbols indicate the average of repeated 222
Rn measurements with 598
uncertainties. 222
Rn activities of samples SMBno.6(m) and SSno.4(m) are significantly different 599
between repeat measurements, indicating accidental degassing, and the maximum values have 600
instead been reported here. The correlation has been calculated by excluding outliers (one 601
sample: SS.no6(m)), determined as values that are ≥1.5s larger than the calculated mean value. 602
Arrows indicate how radioactive decay, degassing, mixing and groundwater inflows affect the 603 222 Rn-TDS relationship. 604 605
Figure 4. Schematic illustrating the potential 222
Rn sources, the processes affecting 222 Rn 606
activity and the 222
Rn migration paths in the eskers/moraine-peatland systems of Abitibi. 607
Appendix
609
The 226
Ra and 238
U in peat and esker sediments
610
Table A1 report the g-measurements carried out in the sediments found in water samples 611
(LB2.no2(m), LB2.no3(m), SN.no2(m), SMB.no2(p) and SMB.no3(m). The 226
Ra activities 612
measured in sediments show high variability, with values ranging from 5.04 to 6.07 Bq/kg for 613
sample LB2.no3(m), and from 27.12 to 34.12 Bg/kg for sample SMB.no2(p). 226
Ra activities 614
measured in the sandy sediment of LB2.no2(m) and LB2.no3(m) are similar to each other and 615
are the lowest of the five water samples from which sediments could be analyzed. 226Ra activity 616
apparently increases in sediments where till deposits and clay are present. The highest 226 Ra 617
activity is found in clay sediments (i.e., sample SMB.no3(m)), where the adsorption capacity 618
of radium is the highest. However, SMB peat water is very acidic (pH = 3.9-4.4; Ferlatte 2014) 619
and the sorption capacity of radium is likely inhibited in this sample, as observed in other acidic 620
environments (Pickler et al., 2012). 621
The 226
Ra activities were used to estimate the activity of 226
Ra-supported 222
Rn in the 622
water samples and the U content of the peatland mineral substratum. Calculated U 623
concentrations in the sediment range from 0.41 (LB2.no2(m)) to 0.82 ppm (SN.no2(m)), with 624
an outlier of 2.52 ppm for SMB.no2(p)) (Table A1). 625
The 222
Rn contribution from the suspended sediment to peat water in samples 626
LB2.no2(m), LB2.no3(m), SN.no2(m), SMB.no2(p) and SMB.no3(m) (Table A1) can be 627
calculated following Eqn. A1, modified from Bonotto and Caprioglio (2002): 628 629 222 Rn !" #$water(BqL −1) = 12.469 ⋅ρ⋅ 1−
(
φ φ)
⋅ ARn⋅ U[ ]
rock⋅ (1− e λt) (Eqn. A.1) 630 631where r is the bulk density of the rock (g cm-3
), f is the porosity and (1-f/f) is the void ratio 632
decay constant of 222
Rn (0.00755 hr-1
) and t is the time interval (in hours) between sampling and 634
analysis. The void ratio has been assumed to range between 0.11 and 0.43, corresponding to 635
the 10 to 30% volume of sediment in 250 cm3 of water contained in the sample. The time 636
interval between sampling and analysis varied between 73 and 233 hours. The emanation 637
coefficient is the fraction of the total amount of 222
Rn produced by 226
Ra decay that escapes from 638
the rock to the pore water. It is a difficult parameter to evaluate and depends on lithology, 639
temperature and moisture content (Nazaroff 1992). Nazaroff and Nero (1988) suggest values 640
of between 0.06 and 0.18 (an average value of 0.14) for sands. More recent experimental work 641
on granite sand from eskers shows similar emanation coefficients, with values ranging from 642
0.17 to 0.24 (Breitner et al. 2008) and 0.12 to 0.30 (Breitner et al. 2010). 643
The 222
Rn contributed from the sediment to peat water can range from 1.9 to 8.3% of the 644
total measured 222
Rn activity for a sediment volume of 10% and an ARn of 0.12, and from 18 to 645
80% of the total measured 222
Rn activity for a sediment volume of 30% and an ARn of 0.30 646
(Table A1). This calls for caution in taking peat water samples so as to avoid as much as 647
possible the collection of suspended material. Filtration during sampling with a large mesh 648
could reduce the collection of larger sediment particles, though this process may be unfeasible, 649
given the limited amount of available water. 650
651
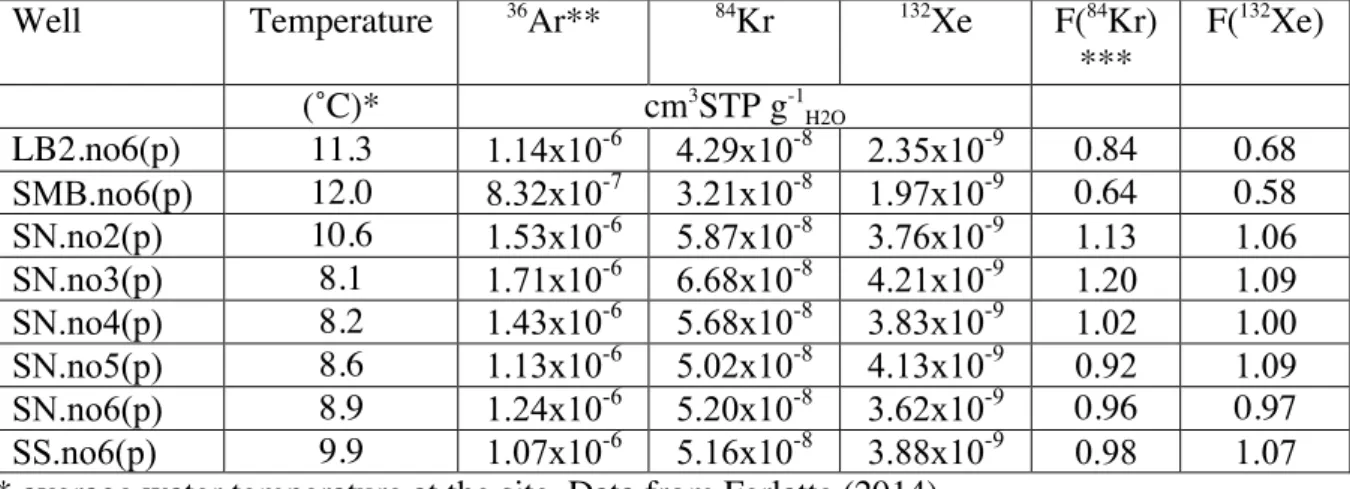
Atmosphere-derived noble gases
652
Table A2 report the abundances of atmosphere-derived noble gas isotopes 36Ar, 84Kr and 653
132
Xe in cm3
STP (Standard Pressure and Temperature) per gram of water, measured in peatland 654
water samples. These abundances were also reported in the F-notation. In F-notation, measured 655
abundances are normalized to the atmospheric abundance dissolved in groundwater or ASW 656
(Air Saturated Water) with 36Ar as the reference isotope: 657
F(i)=(i/36
Ar)sample/(i/ 36
Ar)ASW 659
660
where i represents 84Kr and 132Xe. ASW noble gas composition is calculated at the sampling 661
temperature and using solubility data in groundwater from Smith and Kennedy (1983). F-values 662
are fractionation factors that provide a measure of the enrichment or depletion relative to the 663
ASW composition and thus they are very useful fingerprints of occurrence of peatland water 664
degassing that could have affected radon data. 665
Table A1. Gamma-ray measurements of 226Ra activity in peatland sediments and neutron-activation U concentration in Harricana rocks Piezometer name Mineral substratum* 226Ra ± 226Ra ± 226Ra ± 226Ra contrib. to 222Rn [U]** 295.2 keV 214Pb 352 keV 214Pb 609 keV 214Bi Bq/kg Bq/kg Bq/kg % ppm LB2.no2(m) Sand 5.57 1.01 5.04 0.64 6.76 1.13 3.65-35.19 0.41 LB2.no3(m) Sand 5.04 0.96 6.29 0.72 6.39 1.11 1.92-18.52 0.51 SN.no2(m) Sand/Till 11.46 2.04 10.10 1.29 13.79 2.30 8.29-79.93 0.82 SMB.no2(p) Sand/Clay 34.12 5.34 31.07 3.39 27.12 4.97 - 2.52 SMB.no3(m) Clay 9.75 1.86 8.91 1.19 11.79 2.13 3.25-31.33 0.72 Harricana Clay-silt 0.75 Harricana Clay-silt 0.75 Harricana Sand 0.36 Harricana Sand 0.33 Harricana Arkose 0.20 Harricana Conglomerate 0.87
Harricana Volcanic rock 0.84
*: Sediment substratum for peatland are from Ferlatte et al. (2014). **: U concentration in Harricana moraine from Boucher (2013). 666
667 668 669 670
671
Table A2. Measured atmospheric noble gas amounts and calculated fractionation factor “F” in 672
selected peatland piezometers. 673 674 Well Temperature 36 Ar** 84 Kr 132 Xe F(84 Kr) *** F(132 Xe) (˚C)* cm3 STP g-1 H2O LB2.no6(p) 11.3 1.14x10⁻⁶ 4.29x10⁻⁸ 2.35x10⁻⁹ 0.84 0.68 SMB.no6(p) 12.0 8.32x10⁻⁷ 3.21x10⁻⁸ 1.97x10⁻⁹ 0.64 0.58 SN.no2(p) 10.6 1.53x10⁻⁶ 5.87x10⁻⁸ 3.76x10⁻⁹ 1.13 1.06 SN.no3(p) 8.1 1.71x10⁻⁶ 6.68x10⁻⁸ 4.21x10⁻⁹ 1.20 1.09 SN.no4(p) 8.2 1.43x10⁻⁶ 5.68x10⁻⁸ 3.83x10⁻⁹ 1.02 1.00 SN.no5(p) 8.6 1.13x10⁻⁶ 5.02x10⁻⁸ 4.13x10⁻⁹ 0.92 1.09 SN.no6(p) 8.9 1.24x10⁻⁶ 5.20x10⁻⁸ 3.62x10⁻⁹ 0.96 0.97 SS.no6(p) 9.9 1.07x10⁻⁶ 5.16x10⁻⁸ 3.88x10⁻⁹ 0.98 1.07
* average water temperature at the site. Data from Ferlatte (2014). 675
** average uncertainties on the measured isotopic abundances are ±5% of the measured value. 676
*** calculated uncertainties on the F(i) values are 7.5% of the calculated value. 677
Figure 1
Figure 2
Figure 3
Figure 4
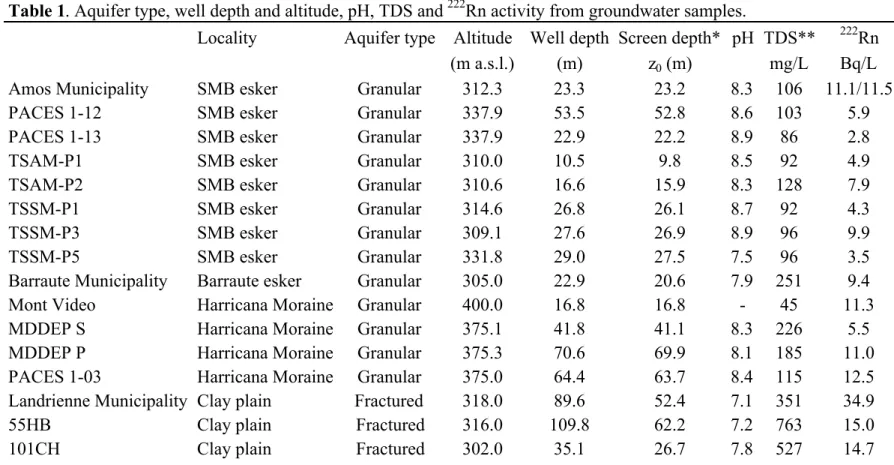
Table 1. Aquifer type, well depth and altitude, pH, TDS and 222Rn activity from groundwater samples.
Locality Aquifer type Altitude Well depth Screen depth* pH TDS** 222Rn
(m a.s.l.) (m) z0 (m) mg/L Bq/L
Amos Municipality SMB esker Granular 312.3 23.3 23.2 8.3 106 11.1/11.5
PACES 1-12 SMB esker Granular 337.9 53.5 52.8 8.6 103 5.9
PACES 1-13 SMB esker Granular 337.9 22.9 22.2 8.9 86 2.8
TSAM-P1 SMB esker Granular 310.0 10.5 9.8 8.5 92 4.9
TSAM-P2 SMB esker Granular 310.6 16.6 15.9 8.3 128 7.9
TSSM-P1 SMB esker Granular 314.6 26.8 26.1 8.7 92 4.3
TSSM-P3 SMB esker Granular 309.1 27.6 26.9 8.9 96 9.9
TSSM-P5 SMB esker Granular 331.8 29.0 27.5 7.5 96 3.5
Barraute Municipality Barraute esker Granular 305.0 22.9 20.6 7.9 251 9.4
Mont Video Harricana Moraine Granular 400.0 16.8 16.8 - 45 11.3
MDDEP S Harricana Moraine Granular 375.1 41.8 41.1 8.3 226 5.5
MDDEP P Harricana Moraine Granular 375.3 70.6 69.9 8.1 185 11.0
PACES 1-03 Harricana Moraine Granular 375.0 64.4 63.7 8.4 115 12.5
Landrienne Municipality Clay plain Fractured 318.0 89.6 52.4 7.1 351 34.9
55HB Clay plain Fractured 316.0 109.8 62.2 7.2 763 15.0
101CH Clay plain Fractured 302.0 35.1 26.7 7.8 527 14.7
Error on 222Rn activity is 4% and blanks 0.12 Bq/L (Lefebvre et al., 2013)
* For wells with complete casing, depth is taken from the surface to the half-lenght of the screen (4.5 and 1.5 m long) * For open wells to bedrock, depth is taken from the surface to midway of the unscreened section.
** Total Dissolved Solids from Boucher et al. (2015) SMB: Saint-Mathieu-Berry
Table 1