Acknowledgements
First and foremost, I would like to thank the supervisor of my thesis, Dr. Christine FRANCES deep from my heart for her valuable guidance, great help and dedicated support on this study.
I am quite grateful to Higher Education of Pakistan for the scholarship that permitted me to undertake this study.
I am grateful for kind help and administrative support of “Société française d'exportation des ressources éducatives (SFERE)” for my studies in France.
I would like to thank my colleagues Madam Mallorie TOURBIN, Madam Sylvie SHETRITE and Mr. Soualo OUATTARA for their kind support in different aspects of my work.
I cannot forget to thank technical and administrative teams of Laboratoire de Génie Chimique, for their untiring and steady support in the laboratory.
I would also like to thank to my father (late), mother, my brothers & sister for their endless love and constant support throughout my academic career.
Abstract
Wet grinding process is an interesting means of producing fine and nano particles. The particle sizing plays an important role in interpretation, control and optimization of various aspects of the wet grinding process. There is a lack of knowledge in understanding different aspects of particle sizing during a wet grinding process. The particle sizing in a wet grinding process is typical in the sense: (i) The dispersions in a wet grinding process, often, involve additives and (or) impurities. It is less known how impurities and additives influence the particle size of the dispersions in the wet grinding process. (ii) In a wet grinding process, dispersions of different concentrations may be used. It is less known how dispersions of different concentration may influence the particle sizing in a wet grinding process. (iii) In a wet grinding process, the change in average particle size of the product is rapid due to relatively fast breakage of the particles. (iv) The degree of poly dispersity in product changes with grinding time. (v) The nature of interaction between particles is non-colloidal before grinding process; this interaction becomes colloidal after a certain grinding time. Similarly, there is a lack of knowledge to understand how quality of final ground product is influenced in a wet grinding process. This study investigates the different aspects of particle sizing and product quality of aqueous dispersions of CaCO3 in a wet grinding process carried out in a stirred media mill. Acoustic attenuation spectroscopy that is known for measuring particle size of dispersions on line, under real process conditions and without diluting the sample has been employed in the study in addition to the technique of dynamic light scattering. The study brings out the conditions in which the effects of impurities and additives etc. on particle size of the dispersions may be determined using acoustic attenuation spectroscopy. Furthermore, the study compares and analyze the particle sizing results obtained though acoustic attenuation spectroscopy and dynamic light scattering. The causes of differences in the results of two techniques have been investigated. We report presence of multiple scattering at high concentration of the dispersions during wet grinding process that result in misleading results of the particles sizes. Quality is an intangible concept. In order to understand how different operating parameters influence product quality, we propose a method based upon the definition of quality as defined in ISO 9000:2005. The method takes into consideration the important operating parameters of wet grinding process (such as the operating condition of the mill, the measurement of particle size and the material) and important product characteristics ( such as average particle size, range of width of particle size distribution, stability of dispersion, degree of impurities, specific energy input and physical appearance). We bring out how a relationship between operating parameters and products of different grades may be established in a wet grinding process.
Key words: Acoustic attenuation spectroscopy, colloids, dynamic light scattering, fine and nano
Résumé (abstract in French)
Le procédé de broyage en voie humide est une opération intéressante permettant la production de particules fines ou de nanoparticules. La caractérisation de la taille des particules est une donnée essentielle pour l’interprétation des données, le contrôle et l’optimisation de ces procédés selon divers aspects. Il y a un manque de connaissances relatif à la caractérisation de la taille de particules en relation avec les procédés de broyage en voie humide. Cette caractérisation est spécifique pour différentes raisons. (i) Les dispersions traitées par broyage contiennent souvent des impuretés et (ou) des additifs. Nous savons assez peu comment les impuretés et les additifs influencent la taille des particules en suspension dans ces procédés. (ii) Lors de procédés de broyage en voie humide, des dispersions de différentes concentrations peuvent être utilisées. Il est important de savoir comment la concentration de la dispersion peut influencer la mesure de la taille des particules lors du procédé. (iii) La modification de la taille moyenne des particules, résultant de leur fragmentation, est rapide. (iv) Le degré de polydispersité dans le produit change au cours du temps. (v) La nature des interactions entre les particules change; avant broyage les particules sont non-colloïdales, elles le deviennent après un certain temps d’opération. De même, il y a un manque de connaissances permettant de comprendre comment la qualité du produit broyé final est affectée lors du broyage. Dans cette étude nous explorons plusieurs aspects de la caractérisation de taille et de la qualité du produit au cours d’un procédé de broyage en voie humide du CaCO3, réalisé à l’aide d’un broyeur à billes agité. La spectroscopie acoustique qui est une technique connue pour ses potentialités en matière de caractérisation de taille de dispersions en ligne, sous des conditions réelles de procédés et sans nécessiter une dilution des échantillons, a été utilisée dans cette étude en complément de la diffusion dynamique de la lumière. Ce travail a montré sous quelles conditions les effets des impuretés et des additifs etc. sur la taille des particules en suspension pouvaient être déterminés par spectroscopie acoustique. De plus, nous avons comparé et analysé les résultats des mesures de taille obtenus avec les deux techniques. Les différences observées ont été analysées. Nous avons montré que la diffusion multiple observée à forte concentration en solide lors des procédés de broyage en voie humide pouvait conduire à une mauvaise interprétation des résultats relatifs à la taille des particules. En outre, la qualité est un concept relatif. Dans ce travail, nous avons adopté une démarche pour mesurer les effets de différents paramètres sur les caractéristiques du produit broyé en se basant sur une définition de la qualité telle que dans la norme ISO 9000 :2005. La démarche a permis de prendre en compte différents paramètres opératoires importants (tels que les conditions de fonctionnement du broyeur, la mesure de la taille des particules et les propriétés du matériau), ainsi que différentes propriétés caractéristiques du produit (comme la taille moyenne des particules, la largeur de la distribution de taille, la stabilité de la dispersion, le taux d’impuretés, l’énergie spécifique apportée au système et l’apparence visuelle du
produit). Nous avons montré que nous pouvions établir une relation entre les paramètres opératoires et différentes qualités de produits obtenus par un procédé de broyage en voie humide.
Mots clés : Broyeur à billes agité, colloïdes, diffusion dynamique de la lumière, impuretés, particules
fines et nanoparticules, procédé de broyage en voie humide, qualité du produit et spectroscopie acoustique.
Table of contents
Acknowledgements... iii
Abstract ... iv
Résumé (abstract in French) ... v
Table of contents... vii
Table of figures ... xi
Table of tables... xvii
List of symbols ... xviii
I. Introduction... 7
I.1 Context and motivation ... 7
I.2 Problems and opportunities ... 8
I.3 Objectives of the study ... 9
I.4 Structure of the thesis ... 9
I.5 Important terms and terminologies... 10
I.6 References ... 12
II. Literature Review ... 15
II.1 Colloidal stability ... 15
II.1.1 Surface forces between colloidal particles ... 15
II.1.2 Electrostatic stabilization (DLVO theory)... 19
II.1.3 Steric stabilization ... 21
II.1.4 Comparison: steric stabilization vs. electrostatic stabilization ... 22
II.1.5 Summing up - colloidal stability ... 23
II.2 Particle sizing of colloidal dispersions ... 24
II.2.1 Laser diffraction technique... 24
II.2.2 Acoustic attenuation spectroscopy ... 27
II.2.3 Dynamic light scattering ... 30
II.2.4 Summing up - comparison of particle sizing techniques... 33
II.3 Colloid preparation by wet grinding processes ... 34
II.3.1 General considerations ... 34
II.3.2 Designs of stirred media mills... 35
II.3.3 Issues and approaches in stirred media milling ... 37
II.3.4 Stress number and stress intensity... 38
II.3.5 Important operating parameters... 41
II.4 References ... 47
III.1 Materials ... 54
III.1.1 Calcium carbonate (A) ... 54
III.1.2 Calcium carbonate (B)... 55
III.1.3 Magnesium carbonate... 55
III.1.4 Sodium nitrate ... 56
III.1.5 Sodium polyacrylate... 56
III.1.6 H2O... 56
III.2 Equipments ... 56
III.2.1 Mastersizer 2000 ... 56
III.2.2 Ultrasizer ... 58
III.2.3 Zetasizer nano ZS... 62
III.2.4 Lab Star ... 64
III.3 Methods ... 67
III.4 Reliability and precision... 67
III.5 Preliminary work ... 68
III.5.1 Determination of a single measurement strategy for acoustic measurements ... 68
III.5.2 Determination of different acoustic trends ... 69
IV.Effects of Impurities on Particle Sizing by Acoustic Attenuation Spectroscopy... 74
IV.1 Introduction ... 75
IV.2 Theory ... 75
IV.3 Materials ... 77
IV.4 Equipment and software ... 78
IV.5 Fitness of the measurements... 78
IV.6 Experiments... 79
IV.7 Results and discussions ... 80
IV.7.1 Effects of concentration of dispersions on acoustic attenuation spectra ... 80
IV.7.2 Effects of concentration of impurities on acoustic attenuation spectra ... 85
IV.8 Conclusions ... 87
IV.9 References ... 90
V. Effects of Concentration of Dispersions on Particle Sizing during Production of Fine Particles in Wet Grinding Process... 93
V.1 Introduction ... 94
V.2 Fundamentals of the techniques of particle sizing... 95
V.2.1 Acoustic attenuation spectroscopy ... 95
V.2.2 Dynamic light scattering ... 96
V.3 Materials ... 96
V.5 Results and discussion... 100
V.5.1 General considerations in particle sizing... 100
V.5.2 Effects of concentration of dispersions on particle sizing during wet grinding 102 V.5.3 Causes of different trends... 104
V.6 Conclusions ... 110
V.7 References ... 114
VI.Effects of Particle Sizing and Operating Parameters on Product Quality in Wet Grinding Process... 117
VI.1 Introduction ... 117
VI.2 Theoretical background ... 117
VI.2.1 Quality ... 117
VI.2.2 Product quality ... 118
VI.2.3 Operating parameters ... 119
VI.3 Materials ... 119
VI.4 Methods ... 120
VI.5 Measurements... 121
VI.5.1 Acoustic attenuation spectroscopy ... 121
VI.5.2 Dynamic light scattering ... 122
VI.6 Equipments ... 122
VI.6.1 LabStar ... 122
VI.6.2 Ultrasizer ... 123
VI.6.3 Zetasizer nano ZS... 123
VI.7 Results and discussions ... 123
VI.7.1 Effects of materials on product characteristics... 123
VI.7.2 Effects of operating conditions of the mill on product characteristics ... 140
VI.7.3 Effects of measurement techniques on product characteristics ... 146
VI.7.4 Operating parameters and product grades ... 148
VI.8 Conclusions ... 150
VI.9 References ... 152
VII. Conclusions and Future Work ... 154
VII.1Important conclusions ... 154
VII.1.1 Effects of impurities on particle sizing by acoustic attenuation spectroscopy .. 154
VII.1.2 Effects of concentrations of the dispersions on particle sizing ... 155
VII.1.3 Effects of particle sizing and operating parameters on product quality ... 156
VII.2Future work ... 157
About the author ... 165
Appendix B... 173
Appendix C ... 178
Appendix D ... 183
Table of figures
Fig. II.1: Variation of Gel, GA and GT with h (distance between two particles). ... 21
Fig. II.2: Variation Gmax with concentration of electrolyte. ... 21
Fig. II.3: Different patterns of steric stabilization. ... 22
Fig. II.5: Relationship between attenuation coefficient, frequency and particle size... 29
Fig. II.6: Speckle pattern in dynamic light scattering... 31
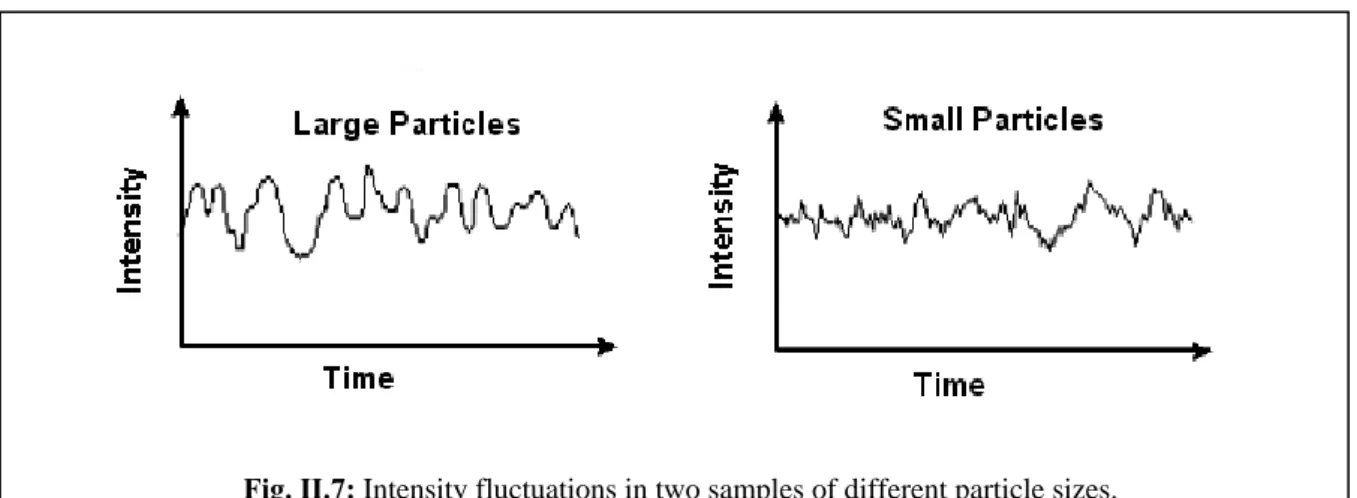
Fig. II.7: Intensity fluctuations in two samples of different particle sizes... 32
Fig. II.8: Schematic of a dynamic light scattering (DLS)... 32
Fig. II.9: Important parts of stirred media mill... 36
Fig. II.10: Three designs of stirred media mills pointed out by Kwade ... 36
Fig. II.11: Effects of speed of agitator on particle size... 41
Fig. II.12: Effects of size of grinding media... 41
Fig. II.13: Effects of filling ratio of grinding media... 42
Fig. II.14: Effects of filling ratio of grinding media... 42
Fig. II.15: Effects of concentration of particles on median size... 43
Fig. III.1: Particle size distribution and shape of CaCO3... 55
Fig. III.2: Mastersizer 2000 based upon laser diffraction technique... 57
Fig. III.3: Malvern Ultrasizer ... 58
Fig. III.4: (a) Application of Ultrasizer under flow cell configuration for particle sizing of a dispersion in stirred tank (b) Measurement cell used in flow cell configuration in dismantled form. 59 Fig. III.5: (a) Application of Ultrasizer under batch cell configuration for particle sizing of a dispersion present into the measurement cell in the instrument (b) Measurement cell used in batch cell configuration in dismantled form. ... 60
Fig. III.6: Zetasizer nano ZS ... 62
Fig. III.7: Zetasizer nano ZS: cell area... 63
Fig. III.8: Zetasizer nano ZS: measurement cells... 64
Fig. III.9: Stirred media mill: LabStar... 65
Fig. III.10: Grinding unit in disassembled form... 66
Fig. III.11: Changes in acoustic spectra with increasing concentration of the dispersion... 69
Fig. III.12: Changes in acoustic spectra with increasing proportion of fine particles in dispersion... 70
Fig. IV.1: (a) Schematic of ECAH theory in terms of input-output. (b) Schematic of an acoustic attenuation spectrometer in terms of input-output. ... 76
Fig. IV.2: Passage of a sound wave through a dispersion... 77
Fig. IV.3: (a) Attenuation spectra of dispersions of Calcium Carbonate without addition of impurities. (b) Attenuation spectra of dispersions of Calcium Carbonate (without impurity) divided by respective weight concentrations. ... 80
Fig. IV.4: (a) Acoustic attenuation spectra of dispersions of CaCO3 at different concentrations. In each
case, 10% MgCO3 of the weight of CaCO3 is present as impurity. (b) The graph shows
attenuation per unit concentration vs. frequency for dispersions of CaCO3 at different
concentrations. In each case, 10% MgCO3 of the weight of CaCO3 is present as impurity.
... 82
Fig. IV.5: (a) Acoustic attenuation spectra of dispersions of CaCO3 at different concentrations. In each case, 30% NaNO3 of the weight of CaCO3 is present as impurity. (b) The graph shows attenuation per unit concentration vs. frequency for dispersions of CaCO3 at different concentrations. In each case, 30% NaNO3 of the weight of CaCO3 is present as impurity. ... 83
Fig. IV.6: (a) Acoustic attenuation spectra of dispersions of CaCO3 at different concentrations. In each case, 30% Sodium Polyacrylate of the weight of CaCO3 is present as impurity. (b) The graph shows attenuation per unit concentration vs. frequency for dispersions of CaCO3 at different concentrations. In each case, 30% Sodium Polyacrylate of the weight of CaCO3 is present as impurity. ... 84
Fig. IV.7: (a) Effects of concentration of impurity of NaNO3 on 10% (m/m) dispersion of CaCO3 . (b) Effects of concentration of impurity of NaNO3 on 10% (m/m) dispersion of CaCO3. ... 86
Fig. V.1: Passage of a sound wave through a dispersion. ... 95
Fig. V.2: Particle size distribution and shape of CaCO3 used... 97
Fig. V.3: Experimental setup. ... 98
Fig. V.4: (a) Changes in acoustic spectra due to increase in quantity of relatively fine particles (b) Changes in acoustic spectra due to changes in proportion of relatively fine particles. (c) Acoustic spectra corresponding to different disperse media. (d) Comparison of acoustic attenuation spectra. ... 101
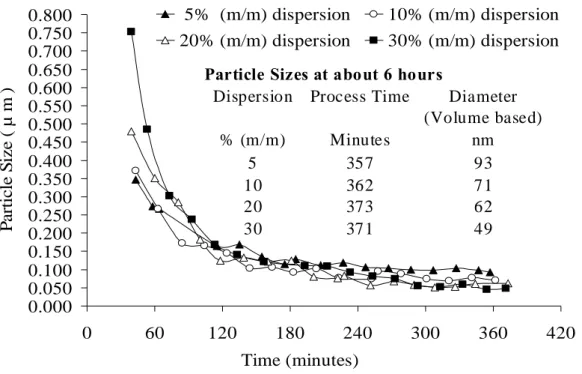
Fig. V.5: Particle sizes measured by acoustic attenuation spectroscopy during size reduction process in stirred media mill. ... 102
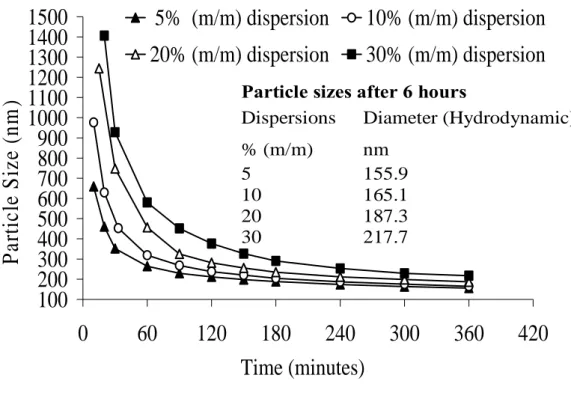
Fig. V.6: Particle sizes measured by dynamic light scattering during size reduction process in stirred media mill. ... 103
Fig. V.7: Particle sizes of the dispersions measured by two different techniques after about 6hrs of grinding... 104
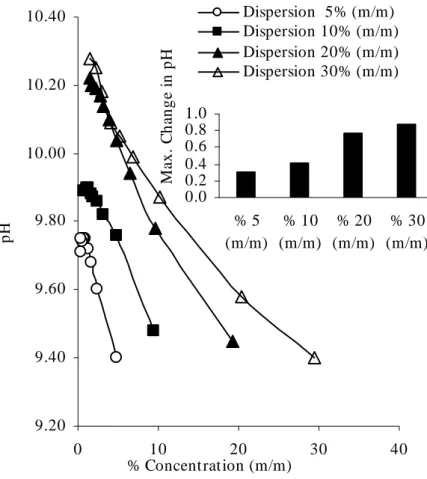
Fig. V.8: Changes in pH during dilution of dispersion after grinding. ... 106
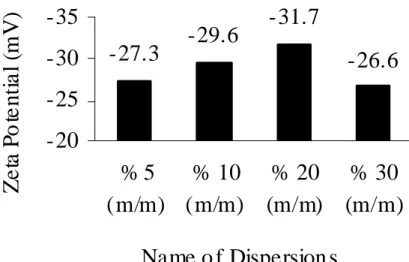
Fig. V.9: Zeta potential for the dispersions measured after 6 hours of grinding... 107
Fig. V.10: Particle sizes studied by acoustic attenuation spectroscopy on diluting the dispersions after grinding experiments. ... 107
Fig. V.11: Comparative study of particle sizes by acoustic attenuation spectroscopy. ... 108
Fig. V.12: Comparative study of particle sizes by two different techniques after dilution... 108
Fig. VI.1: Passage of a sound wave through a dispersion... 121 Fig. VI.2: Progression of size reduction process against time in the compositions 1, 3 and 5 at set 1 of
operating conditions... 124
Fig. VI.3: Progression of size reduction process against specific energy in the compositions 1, 3 and 5
at set 1 of operating conditions. ... 125
Fig. VI.4: Zeta potential versus time in the wet grinding of the compositions 1, 3 and 5 at set 1 of
operating conditions... 125
Fig. VI.5: Progression of size reduction process against time in the compositions 6 and 2 at set 1 of
operating conditions... 128
Fig. VI.6: Progression of size reduction process against specific energy in the compositions 6 and 2 at
set 1 of operating conditions. ... 129
Fig. VI.7: Zeta potential versus time in the wet grinding of the compositions 2 and 6 at set 1 of
operating conditions... 130
Fig. VI.8: Progression of size reduction process against time in the compositions 2 and 6 at set 2 of
operating conditions... 132
Fig. VI.9: Progression of size reduction process against specific energy in the compositions 2 and 6 at
set 2 of operating conditions. ... 132
Fig. VI.10: Zeta potential versus time in the wet grinding of the compositions 2 and 6 at set 2 of
operating conditions... 133
Fig. VI.11: Progression of size reduction process against time in the compositions 5 and 6 at set 1 of
operating conditions... 135
Fig. VI.12: Progression of size reduction process against specific energy in the compositions 5 and 6
at set 1of operating conditions. ... 135
Fig. VI.13: Zeta potential versus time in the wet grinding of the compositions 2 and 6 at set 2 of
operating conditions... 136
Fig. VI.14: Progression of size reduction process against time in the compositions 1 and 2 at set 1 of
operating conditions... 137
Fig. VI.15: Progression of size reduction process against specific energy in the compositions 1 and 2
at set 1of operating conditions. ... 137
Fig. VI.16: Zeta potential versus time in the wet grinding of the compositions 1 and 2 at set 1 of
operating conditions... 138
Fig. VI.17: Progression of size reduction process against time in the compositions 7, 8, 6, 9 at set 1 of
operating conditions... 138
Fig. VI.18: Progression of size reduction process against specific energy in the compositions 7, 8, 6
and 9 at set 1 of operating conditions. ... 139
Fig. VI.19: Zeta potential versus time in the wet grinding of the compositions 7, 8, 6, 9 at set 1 of
Fig. VI.20: Progression of size reduction process against time in the compositions 6 at set 1 and 2 of
operating conditions... 141
Fig. VI.21: Progression of size reduction process against specific energy in the compositions 6 at set
1 and 2 of operating conditions... 141
Fig. VI.22: Zeta potential versus time in the wet grinding of the compositions 6 at set 1 and 2 of
operating conditions... 142
Fig. VI.23: Progression of size reduction process against time in the compositions 2 at set 1 and 2 of
operating conditions... 144
Fig. VI.24: Progression of size reduction process against specific energy in the compositions 6 at set 1
and 2 of operating conditions... 144
Fig. VI.25: Zeta potential versus time in the wet grinding of the compositions 2 at set 1 and 2 of
operating conditions... 145
Fig. VI.26: Progression of size reduction process for the composition 7,8,6,9 measured with dynamic
light scattering... 147
Fig. VI.27: Progression of size reduction process for the composition 7,8,6,9 measured with acoustic
attenuation spectroscopy... 147
Fig. VI.28: Comparison of results of particle sizes measured with dynamic light scattering and
acoustic attenuation spectroscopy... 148
Fig. A. 1: (a) Acoustic attenuation spectra of dispersions of CaCO3 at different concentrations. In each
case, 5% MgCO3 of the weight of CaCO3 is present as impurity. (b) The graph shows
attenuation per unit concentration vs. frequency for dispersions of CaCO3 at different
concentrations. In each case, 5% MgCO3 of the weight of CaCO3 is present as impurity.
... 167
Fig. A. 2: (a) Acoustic attenuation spectra of dispersions of CaCO3 at different concentrations. In each
case, 10% MgCO3 of the weight of CaCO3 is present as impurity. (b) The graph shows
attenuation per unit concentration vs. frequency for dispersions of CaCO3 at different
concentrations. In each case, 10% MgCO3 of the weight of CaCO3 is present as impurity.
... 168
Fig. A. 3: (a) Acoustic attenuation spectra of dispersions of CaCO3 at different concentrations. In each
case, 20% MgCO3 of the weight of CaCO3 is present as impurity. (b) The graph shows
attenuation per unit concentration vs. frequency for dispersions of CaCO3 at different
concentrations. In each case, 20% MgCO3 of the weight of CaCO3 is present as impurity.
... 169
Fig. A. 4: (a) Acoustic attenuation spectra of dispersions of CaCO3 at different concentrations. In each
case, 30% MgCO3 of the weight of CaCO3 is present as impurity. (b) The graph shows
concentrations. In each case, 30% MgCO3 of the weight of CaCO3 is present as impurity.
... 170
Fig. A. 5: (a) Acoustic attenuation spectra of dispersions of CaCO3 at different concentrations. In each
case, 5% NaNO3 of the weight of CaCO3 is present as impurity. (b) The graph shows
attenuation per unit concentration vs. frequency for dispersions of CaCO3 at different
concentrations. In each case, 5% NaNO3 of the weight of CaCO3 is present as impurity.
... 171
Fig. A. 6: (a) Acoustic attenuation spectra of dispersions of CaCO3 at different concentrations. In each
case, 10% NaNO3 of the weight of CaCO3 is present as impurity. (b) The graph shows
attenuation per unit concentration vs. frequency for dispersions of CaCO3 at different
concentrations. In each case, 10% NaNO3 of the weight of CaCO3 is present as impurity.
... 172
Fig. B. 1: (a) Acoustic attenuation spectra of dispersions of CaCO3 at different concentrations. In each
case, 20% NaNO3 of the weight of CaCO3 is present as impurity. (b) The graph shows
attenuation per unit concentration vs. frequency for dispersions of CaCO3 at different
concentrations. In each case, 20% NaNO3 of the weight of CaCO3 is present as impurity.
... 173
Fig. B. 2: (a) Acoustic attenuation spectra of dispersions of CaCO3 at different concentrations. In
each case, 30% NaNO3 of the weight of CaCO3 is present as impurity. (b) The graph shows attenuation per unit concentration vs. frequency for dispersions of CaCO3 at different concentrations. In each case, 30% NaNO3 of the weight of CaCO3 is present as impurity... 174
Fig. B. 3: (a) Acoustic attenuation spectra of dispersions of CaCO3 at different concentrations. In each
case, 5% Sodium polyacrylate of the weight of CaCO3 is present as impurity. (b) The
graph shows attenuation per unit concentration vs. frequency for dispersions of CaCO3 at
different concentrations. In each case, 5% Sodium polyacrylate of the weight of CaCO3 is
present as impurity... 175
Fig. B. 4: (a) Acoustic attenuation spectra of dispersions of CaCO3 at different concentrations. In each
case, 10% Sodium polyacrylate of the weight of CaCO3 is present as impurity. (b) The
graph shows attenuation per unit concentration vs. frequency for dispersions of CaCO3 at
different concentrations. In each case, 10% Sodium polyacrylate of the weight of CaCO3
is present as impurity. ... 176
Fig. B. 5: (a) Acoustic attenuation spectra of dispersions of CaCO3 at different concentrations. In each
case, 20% Sodium polyacrylateof the weight of CaCO3 is present as impurity. (b) The
graph shows attenuation per unit concentration vs. frequency for dispersions of CaCO3 at
different concentrations. In each case, 20% Sodium polyacrylateof the weight of CaCO3 is
Fig. C. 1: (a) Effects of concentration of impurity of MgCO3 on 5% (m/m) dispersion of CaCO3 .(b)
Effects of concentration of impurity of MgCO3 on 10% (m/m) dispersion of CaCO3 . (c)
Effects of concentration of impurity of MgCO3 on 20% (m/m) dispersion of CaCO3. ... 179
Fig. C. 2: (a) Effects of concentration of impurity of NaNO3 on 5% (m/m) dispersion of CaCO3. (b) Effects of concentration of impurity of NaNO3 on 10% (m/m) dispersion of CaCO3. (c) Effects of concentration of impurity of NaNO3 on 20% (m/m) dispersion of CaCO3. .... 180
Fig. C. 3: (a) Effects of concentration of impurity of Sodium polyacrylate on 5% (m/m) dispersion of CaCO3. (b) Effects of concentration of impurity of Sodium polyacrylate on 10% (m/m) dispersion of CaCO3. (c) Effects of concentration of impurity of Sodium polyacrylate on 20% (m/m) dispersion of CaCO3. ... 182
Fig. D. 1: (a) Effects of concentration of impurity of MgCO3 on 5% (m/m) dispersion of CaCO3. (b) Effects of concentration of impurity of MgCO3 on 10% (m/m) dispersion of CaCO3. (c) Effects of concentration of impurity of MgCO3 on 20% (m/m) dispersion of CaCO3. ... 183
Fig. D. 2: (a) Effects of concentration of impurity of NaNO3 on 5% (m/m) dispersion of CaCO3. (b) Effects of concentration of impurity of NaNO3 on 10% (m/m) dispersion of CaCO3. (c) Effects of concentration of impurity of NaNO3 on 20% (m/m) dispersion of CaCO3. .... 184
Fig. D. 3: (a) Effects of concentration of impurity of Sodium polyacrylate on 5% (m/m) dispersion of CaCO3. . (b) Effects of concentration of impurity of Sodium polyacrylate on 10% (m/m) dispersion of CaCO3. (c) Effects of concentration of impurity of Sodium polyacrylate on 20% (m/m) dispersion of CaCO3. ... 185
Fig. E. 1: Multiple scattering in 5 % (m/m) dispersion... 186
Fig. E. 2: Multiple scattering in 10 % (m/m) dispersion... 187
Table of tables
Table II.1: Electrostatic stabilization – conclusions from energy-distance curve ... 20
Table II.2: Steric stabilization – summary of important requirements ... 22
Table II.3: Summary - important parts of a laser diffraction instrument... 25
Table II.4: Summary - assumptions used in Mie theory for calculation of particle size distribution.... 26
Table II.5: Summary- additional assumptions used in Fraunhofer approximation for calculation of particle size distribution... 26
Table II.6: Summary: mechanisms of acoustic losses ... 28
Table II.7: Comparison of particle sizing techniques... 34
Table II.8: Important factors influencing a grinding process ... 35
Table II.9: Wet grinding: different mills and reasons to prefer wet grinding... 35
Table III.1: Physical properties required in calculation of particle size distribution... 62
Table III.2: Frequency band employed in measurements... 68
Table III.3: Aqueous dispersions of CaCO3 mixed with different proportion of coarse and relatively fine particles... 69
Table IV.1: Physical properties required for particle sizing by acoustic attenuation spectroscopy ... 76
Table IV.2: Frequency band employed in the measurements... 78
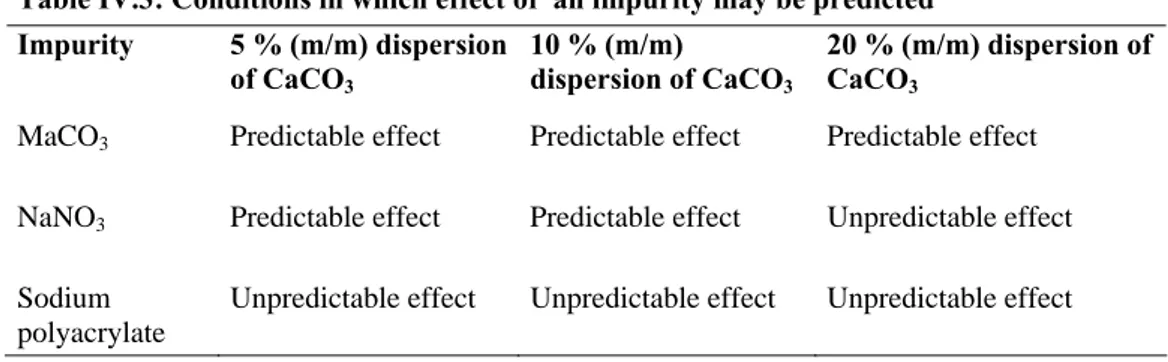
Table IV.3: Conditions in which effect of an impurity may be predicted ... 87
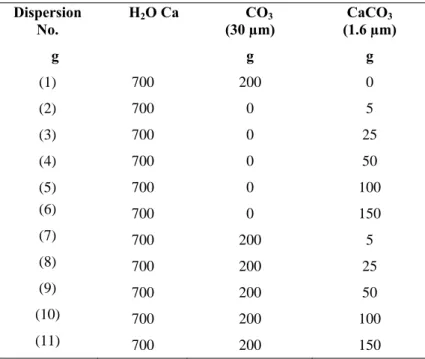
Table V.1: Compositions of dispersions used ... 97
Table V.2: Physical properties at 25˚C used in calculations for particle sizing ... 99
Table V.3: Set of fixed operating parameters... 99
Table V.4: Aqueous dispersions of CaCO3 mixed with different proportion of coarse and relatively fine particles... 100
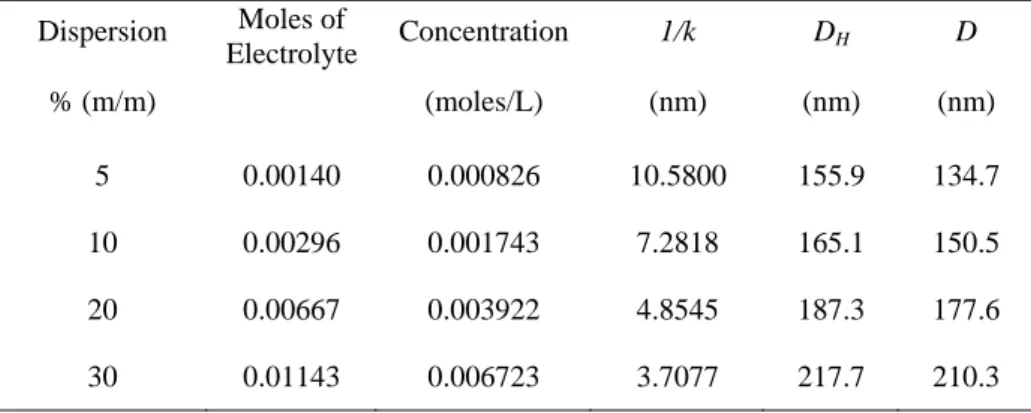
Table V.5: Debye length & diameter of particle (D) at 25˚C in different dispersions ... 105
Table VI.1: Compositions of materials (dispersions) employed in grinding experiments ... 119
Table VI.2: Operating conditions in stirred media milling... 120
Table VI.3: Effects of different compositions of materials on product characteristics (Case A) ... 126
Table VI.4: Effects of different compositions of materials on product characteristics (Case B) ... 130
Table VI.5: Effects of different compositions of materials on product characteristics (Case C) ... 133
Table VI.6: Effects of different compositions of materials on product characteristics (Case D) ... 134
Table VI.7: Effects of different compositions of materials on product characteristics (Case E) ... 136
Table VI.8: Effects of different compositions of materials on product characteristics (Case F)... 140
Table VI.9: Effects of different compositions of materials on product characteristics (Case G) ... 143
Table VI.10: Effects of different compositions of materials on product characteristics (Case H) ... 146
Table VI.11: Different product grades based upon product requirements ... 149
List of symbols
a1 Radius of particle 1 (m)
a2 Radius of particle 2 (m)
A0 Initial amplitude of a sound wave (m)
AH Hamaker constant (J)
Ax Amplitude in a sound wave after a distance x (m)
Cs Weight concentration (-)
Cv Volume concentration (-)
d (H) Hydrodynamic diameter (m)
dGM Diameter of the grinding media (m)
D Translational diffusion coefficient (m²/s) D Interparticle distance (m)
e Electronic charge (C) Em Specific energy (J/Kg)
FA Attractive force between the particles (N)
Ga Attractive energy between two individual atoms or molecules (J)
Gel Energy of repulsion (J)
h Surface-surface separation between the particles (m) k Boltzmann constant (J/K)
l Correlation length (m)
n Refractive index of dispersant (-)
n0 Number of ions of each sort in the bulk phase (-)
n∞ Bulk density of ions (Kg. m-3)
Nc Number of media contacts (-)
NGM Number of grinding media (-)
Np Number of feed particles inside the mill (-)
SI Stress intensity (J/kg) SN Stress number (-)
T Absolute temperature (K) VA Total intersection energy (J)
VGC
Volume of grinding chamber (m3) Z Valency of ions (-)
α Attenuation coefficient (db/m) γ Reduced surface potential (V)
ε Porosity of the bulk grinding media (-) ε0 Permittivity of free space (F/m)
εr Relative permittivity (F/m)
η Viscosity (Pa . s) θ Scattering angle (rad)
κ Debye–Hückel parameter (m-1) λo Wavelength (m)
τ Time difference (the sample time) of the correlator (s) φGM Filling ratio of grinding media (-)
Introduction
CHAPTER I
*
*
As per requirements of the university, the translation of chapter 1in French has been provided in the beginning of chapter 1.
I Introduction (en français)
I.1 Contexte et motivations
La demande de production de dispersions de particules fines ou ultrafines (nanoparticules) augmente jour après jour. Ces dispersions ont de très nombreuses applications dans beaucoup de domaines, tels que les peintures, les pigments, le papier, les adhésifs, les catalyseurs, les matériaux absorbants, les encres d’imprimerie, les émulsions, les crèmes, les céramiques, le ciment, les fibres, les charges pour les plastiques, les matériaux pour le traitement de l’eau, les agents blanchissants et les cosmétiques etc. Les particules fines et ultrafines ont, en raison de leur faible taille et du rapport surface/volume très élevé, des propriétés physico-chimiques exacerbées, qui diffèrent de celles des atomes ou des molécules les constituant mais qui sont aussi différentes de celles du matériau macroscopique. Ces propriétés induisent généralement une amélioration de l’homogénéité, de la solubilité, des propriétés rhéologiques, de la résistance mécanique ou de la réactivité par rapport aux produits de dimension plus élevée.
Il y a deux approches générales permettant la production de particules fines ou de nanoparticules: (i) les méthodes dites « bottom-up » (dans lesquelles les nanoparticules peuvent être produites par réaction, condensation ou agrégation de molécules etc.). (ii) les méthodes dites « top-down » (dans lesquelles on trouve les procédés par broyage qui à partir de particules grossières permettent d’obtenir des particules fines). Cette étude est associée à une méthode de type « top-down ». Dans cette approche, les procédés de broyage en voie sèche et ceux en voie humide sont deux options possibles. Cette étude a trait au procédé de broyage en voie humide pour la production de particules fines ou de nanoparticules. La technologie support de cette étude est celle des broyeurs à billes agités. Cette technologie est en effet une technologie prisée dans le domaine du broyage en voie humide car elle présente beaucoup d’avantages : une faible tendance à l’agglomération des fragments produits, des pertes de matière faibles, une oxydation moindre du produit, une plus grande facilité pour le traitement de matériaux toxiques ou encore le fait qu’il n’est pas nécessaire de mettre en place une technique pour l’élimination des poussières contenues dans l’air.
Dans les procédés de production de nanoparticules, la mesure de la taille des particules joue un rôle important. Récemment, plusieurs techniques ont été développées pour mesurer la taille des particules dans des dispersions de particules fines ou de nano particules. Chaque technique a ses propres
avantages, inconvénients et limitations selon les conditions d’application. Il est nécessaire d’analyser ces potentialités et ces contraintes en référence avec un procédé et selon les conditions de fonctionnement. Cette étude tente de faire cela en privilégiant un procédé de broyage par voie humide. La connaissance apportée par cette étude contribuera à préciser l’information sur la taille des particules du produit élaboré, ce qui permettra d’améliorer l’interprétation, le contrôle et l’optimisation selon différents angles de vue (rendement énergétique, qualité du produit, usure des billes de broyage, …) du procédé en voie humide de broyage par microbilles.
I.2 Problèmes et opportunités
La caractérisation de la taille de particules lors de la production de nanoparticules au moyen d’un procédé de broyage en voie humide est spécifique pour diverses raisons. Les paragraphes suivants décrivent la problématique particulière et les solutions qui ont été analysées dans cette étude.
Les dispersions traitées par broyage contiennent souvent des impuretés et des additifs etc. Par exemple, pour beaucoup d’applications industrielles, des dispersions de CaCO3 sont préparées à partir de CaCO3 brut qui peut contenir des impuretés comme la silice ou le carbonate de magnésium. De même, lors de procédés de broyage en voie humide, il est courant dans la pratique d’ajouter des additifs dans la dispersion pour contrôler l’agrégation et la dispersibilité des particules. Or, il existe un manque de connaissances pour la caractérisation de telles dispersions. Concernant la spectroscopie acoustique, Babick et al. (2000) ont ainsi souligné le fait que seulement une petite expérience a été acquise concernant la caractérisation de la taille des particules dans des conditions réelles, c'est-à-dire en présence de contaminants, pour des systèmes multi-constituants ou pour le cas où la connaissance des phases incluses est incomplète. De même, Povey (2006) a insisté sur l’importance de la caractérisation des tensio-actifs dans le solvant pour obtenir une caractérisation fine de la taille au moyen de la spectroscopie acoustique. L’un des objectifs de cette étude est de s’attaquer à ce problème de manière à trouver les conditions adéquates dans lesquelles des dispersions contenant des impuretés peuvent être analysées par mesure de l’atténuation acoustique.
Lors de procédés de broyage en voie humide, des dispersions de différentes concentrations peuvent être utilisées. Il est important de savoir comment la concentration de la dispersion peut influencer le procédé de broyage. La difficulté avec de nombreuses techniques de caractérisation de la taille comme la diffusion dynamique de la lumière ou la diffraction laser est qu’elles nécessitent une dilution sévère des dispersions avant l’analyse de taille. Cette étape de dilution peut changer la taille des particules par agrégation ou de-agrégation. Aussi, de telles techniques peuvent ne pas produire une information correcte de la taille des particules, ce qui peut entraîner une mauvaise interprétation pour le contrôle et l’optimisation d’un procédé. La technique de
spectroscopie acoustique apparaît comme une solution intéressante dans de telles situations. Cependant, il y a un manque de connaissance quant à l’application de cette technique pour le suivi de procédés de broyage en voie humide. Cette analyse doit être effectuée en considérant différents aspects de la caractérisation de taille réalisée avec cette technique et en comparant les résultats trouvés avec ceux obtenus par le biais d’autres méthodes. Pour parvenir à une meilleure conception des unités, un meilleur contrôle des procédés, et pour permettre l’optimisation des conditions de fonctionnement, il est nécessaire de comprendre les raisons des différences de résultats qui peuvent être observées lorsque on mesure la taille des particules en utilisant des techniques différentes. Un deuxième objectif de cette étude est donc d’analyser les effets de la concentration des dispersions sur l’analyse de taille lors de la production de particules fines par broyage en voie humide.
La caractérisation de la taille des particules lors de la production de particules fines ou de nanoparticules est particulière par rapport à d’autres procédés dans le sens où: (i) La modification de la taille moyenne des particules, résultant de leur fragmentation, est rapide. (ii) Le degré de polydispersité dans le produit change au cours du temps. (iii) La nature des interactions entre les particules change; avant broyage les particules sont non-colloïdales, elles le deviennent après un certain temps d’opération. Ces conditions font que la caractérisation au cours d’un procédé de broyage est plus complexe que le cas d’une simple dispersion et elle nécessite de fait une étude spécifique de sorte à bien comprendre les détails de cette opération selon différents aspects. Il y a un manque de connaissances pour comprendre comment la qualité du produit broyé final est
affectée lors du broyage dans des broyeurs à billes agités. Dans cette étude nous explorons plusieurs aspects de la caractérisation de taille, ainsi que quelques autres paramètres opératoires qui peuvent influencer la qualité du produit broyé.
I.3 Objectifs de l’étude
L’objectif principal de cette thèse est d’analyser les potentialités, les limitations et les problèmes rencontrés dans la mesure de taille de particules en considérant la spectroscopie acoustique, la diffusion dynamique de la lumière et la diffraction laser lors de la production de particules fines ou de nanoparticules en suspension au moyen d’un procédé de broyage en voie humide. En particulier, nous souhaitons analyser:
Les effets des impuretés sur la caractérisation de la taille par spectroscopie acoustique dans l’intention de trouver les conditions adéquates pour lesquelles cette technique peut s’appliquer lors de procédés de broyage en voie humide en présence d’impuretés et/ou d’additifs.
Les effets de la concentration des dispersions sur la mesure de taille lors de la production de particules fines par un procédé de broyage en voie humide. En particulier, nous envisageons de comparer les résultats de la mesure de taille par différentes techniques et d’expliquer les raisons qui conduisent à l’obtention de résultats différents.
Les effets de la caractérisation de la taille, ainsi que ceux de différents paramètres opératoires sur la qualité du produit broyé dans un broyeur à billes agité.
I.4 Structure de la thèse
L’étude a été entreprise selon différentes phases qui sont discutées lors des différents chapitres de la thèse.
Chapitre I: Ce chapitre constitue l’introduction de la thèse. Le contexte, les motivations, la
problématique traitée et les objectifs du travail sont précisés. De même, la structure de la thèse et la définition de quelques termes ou terminologies importants sont donnés dans cette partie. Ce chapitre donne un aperçu de l’originalité, de la contribution et de l’innovation du travail proposé. Il explique comment et sur quels aspects cette étude est différente d’autres travaux dans le domaine.
Chapitre II: Ce chapitre rapporte différents aspects de la littérature qui sont en relation avec le
domaine abordé dans la thèse. Il présente les aspects théoriques, ainsi les développements et les applications pratiques associées aux différentes techniques de caractérisation de la taille. Il dresse également un état de l’art sur les procédés de broyage en voie humide et sur la stabilité des suspensions colloïdales. Ces éléments sont importants pour situer le contexte de la thèse.
Chapitre III: Le troisième chapitre décrit la méthodologie utilisée dans ce travail. Les méthodes, les
matériaux et les équipements principaux sont détaillés. Quelques résultats préliminaires importants sont également présentés dans cette partie.
Chapitre I V: Dans les procédés de broyage en voie humide, les dispersions traitées contiennent
souvent des additifs ou des impuretés. Ce chapitre analyse les effets des impuretés sur la caractérisation de la taille des particules par spectroscopie acoustique. Les résultats présentés dans ce chapitre constituent donc une base pour l’analyse de la caractérisation de la taille de particules en suspension en présence d’additifs ou d’impuretés lors de procédés de broyage en voie humide. Le travail présenté dans ce chapitre a fait l’objet d’une publication dans la revue Journal of Powder Technology. Nous présentons dans ce chapitre le contenu de l’article sans modification. Toutefois, à la fin du manuscrit, quelques résultats complémentaires sont donnés dans les annexes A, B, C et D.
Chapitre V: Dans le cinquième chapitre nous analysons les effets de la concentration des dispersions
agité en utilisant les techniques de la spectroscopie acoustique et de la diffusion dynamique de la lumière. Dans ce chapitre nous comparons et nous avançons des hypothèses pour expliquer les différences de résultats entre les deux techniques. Le travail présenté dans ce chapitre a également été accepté pour publication dans une Journal of Powder Technology. Nous présentons le contenu de l’article sans modification par rapport à la version de l’article mais des résultats complémentaires qui nous ont servi à l’élaboration de la publication ont été rajoutés à la fin du manuscrit dans l’annexe E..
Chapitre V I: Le chapitre VI a trait à la discussion des effets de la caractérisation de taille et de
quelques paramètres sur la qualité du produit obtenu par broyage en voie humide. Ce chapitre a aussi été présenté sous la forme d’un article qui a été accepté et présenté lors d’une communication orale dans le congrès “The World Congress on Particle Technology” en avril 2010 à Nuremberg en Allemagne.
I. Introduction
I.1 Context
and
motivation
The demand for dispersions of fine and nano particles is increasing day by day. They have wide applications in many areas such as paints, pigments, paper coatings, adhesives, catalysts, absorbent materials, fillers, printing inks, carbonless copying papers, emulsions, micro emulsions, ointments, ceramics, cement, fiber, reinforcement of plastics, dairy products, water proofing materials, cleansing agents and cosmetics etc. Fine and nano particles, due to small size and high surface area-to-volume ratios, exhibit physicochemical properties that differ from those of the constituent atoms or molecules yet are also different from macroscopic material. They, generally, result in improvement of homogeneity, solubility, rheological properties, strength and reactivity etc. of the products formed with them.
There are two approaches for production of fine and nano particles: (i) bottom-up (in which fine and nano particles may be produced by a reaction, condensation or aggregation of molecules etc.) and (ii) top-down (in which fine and nano particles may be produced by physical processes such as grinding). This study is related to top-down approach. In top down approach, wet grinding and dry grinding are two possible options. This study takes into consideration the wet grinding process for production of fine and nano particles. The stirred media milling, that is a prospective technology in the domain of wet grinding because of many advantages such as relative low agglomeration tendency, low material losses, less possibility of oxidation, easy handling of toxic materials, elimination of need of employing a device for air cleaning, elimination of the problem of dust explosion and better heat transfer options, has been focused in this study.
In process of production of fine and nano particles, the particle sizing plays an important role. In the recent past, many modern techniques of particle sizing have been developed for the dispersions of fine and nano particles. Each technique has its own advantages, disadvantages and complications depending upon conditions of the application. There is a need to understand the potentials, limitations and complications of particle sizing techniques with reference to the processes and conditions of applications. This study attempts this by focusing on the wet grinding process. The knowledge obtained by this study will contribute in precising information of particle size of the product that will be helpful in improving the interpretation, control and optimization of various aspects of the wet grinding process.
I.2 Problems and opportunities
The particle sizing in production of fine and nanoparticles by means of wet grinding process is typical in many senses. The following paragraphs describe the typical problems and opportunities that have been addressed in this study.
The dispersions during wet grinding involve often impurities and additives etc. For example, in many industrial applications, dispersion of CaCO3 are prepared from raw CaCO3 that may contain impurities such as silica or MgCO3. Similarly, during wet grinding processes, it is a common practice to add additive(s) in the dispersion to control aggregation and dispersity of the particles. For particle sizing of such dispersions, there exists a lack of knowledge. It is less known how to treat particle sizing of such dispersions. Pointing out this lack, Franck Babick et al. (2000) write that only little experience has been gained in particle sizing under more real conditions, e.g. for the presence of contamination, for multi-component-systems or for the case that the knowledge of the involved phases is incomplete . Similarly, Povey (2006) has emphasized the importance of characterizing the surfactants in the solvent for successful particle sizing by means of acoustic attenuation spectroscopy. One of the objectives of this study is to the address this problem in order to find possible conditions in which dispersions with impurities may be studied by means of acoustic attenuation spectroscopy.
During wet grinding process, dispersions of different concentrations may be used. It is important to understand how different concentrations of the dispersions influence the grinding process. The problem with many techniques of particle sizing such as dynamic light scattering and laser diffraction technique is that they require the sample to be diluted before particle sizing. This step of dilution may change size of the particles by aggregation or de-aggregation. Thus, such techniques may not generate the right information of particle size that is important to interpret, control and optimize a process. The technique of acoustic attenuation spectroscopy is considered as a solution in such cases. However, there exists a lack of comprehensive studies on application of this technique into wet grinding process that take into consideration different aspects of particle sizing carried out with this technique with an emphasis on comparison of its results with the results obtained with other techniques. For a better control, designing, interpretation and optimization of a wet grinding process, it is inevitable to understand the reasons of differences in the results of particle sizing obtained through different techniques. One of the objectives of this study is to investigate the effects of concentration of dispersions on particle sizing during production of fine particles in wet grinding process.
The particle sizing in production of fine and nanoparticles is typical from particle sizing in other processes in the senses: (i) The change in average particle size of the product is rapid due to relatively fast breakage of particles. (ii) The degree of poly dispersity in product changes with
grinding time. (iii) The nature of interaction between particles is non-colloidal before grinding process; this interaction becomes colloidal after a certain grinding time. These conditions distinguish particle sizing in wet grinding process from particle sizing in case of simple dispersions and hence require a comprehensive study in order to understand the details of various aspects. In our work, we have addressed these issues.
There is a lack of knowledge to understand how quality of final ground product is influenced in stirred media milling. In this study we explore various aspects of particle sizing and some other operating parameters that may influence quality of the product.
I.3 Objectives of the study
The main objective of this study is to investigate the potentials, limitations and complications in process of particle sizing considering acoustic attenuation spectroscopy, dynamic light scattering and laser diffraction technique during production of fine and nanoparticles by means of wet grinding process. In particular, we aim to investigate:
Effects of impurities on particle sizing by acoustic attenuation spectroscopy with the intention to find the possible ways in which the technique may be applied to wet grinding processes that involve impurities and additives.
Effects of concentration of dispersions on particle sizing during production of fine particles in wet grinding process. Especially, we aim to compare the results of particle sizing of different techniques with the goal to find the reasons of differences in the results obtained through different techniques.
Effects of particle sizing and other operating parameters on product quality in stirred media milling.
I.4 Structure of the thesis
The study was carried out in different phases that have been discussed into different chapters of this thesis.
Chapter I: This chapter introduces this thesis. The context, motivation, problems and opportunities,
objectives, important terms and terminologies, and structure of the thesis have been presented in this chapter. This chapter provides an insight into originality, contribution and innovation of the work. It has been explained how and in which aspects this study is different from other studies.
Chapter II: This chapter reviews different aspects of the literature that are related to this thesis. The
theory, developments, approaches in applications and critics in particle sizing techniques, wet grinding process and colloidal stability have been thoroughly reviewed in this chapter. This chapter is important to understand the context of the work.
Chapter III: This chapter describes the research methodology adopted in this work. The chapter
discusses the details of methods, materials and main equipments employed in this study. Some important results of our preliminary work are equally part of this chapter.
Chapter IV: The dispersions in wet grinding process often involve additives and impurities. This
chapter analyses the effects of impurities on particle sizing by acoustic attenuation spectroscopy. The results presented in this chapter provide the basis for studying the particle sizing of dispersion with additives and impurities in wet grinding process. The work presented in this chapter has already been published in the journal of Powder Technology. We present the paper in this chapter without any technical changes. The supplementary results, however, are given in appendices A, B, C and D at the end of the manuscript.
Chapter V: This chapter investigates the effects of concentration of dispersions on particle sizing
during production of fine particles in a stirred media mill using the techniques of acoustic attenuation spectroscopy and dynamic light scattering. The chapter compares and investigates the differences in the results of two techniques. The work presented in this chapter has already been reviewed and accepted for publication in the journal of Powder Technology. We present the paper in this chapter without any technical changes in the text. . The supplementary results, however, are given in appendix E at the end of the manuscript.
Chapter VI: This chapter discusses the effects of particle sizing and operating parameters on product
quality in wet grinding process. This research work has been orally presented in an international conference “The World Congress on Particle Technology” held on 26-29 April 2010 in Nuremberg, Germany.
Chapter VII: This is the final chapter of this thesis and summarizes the conclusions drawn from this
study. The work that may be undertaken by prospective researchers has been highlighted equally in this chapter.
I.5 Important terms and terminologies
Basic terms and terminologies that are important to understand theme of the study are introduced below.
Dispersion: It is a finely distributed mixture of two or more insoluble (or slightly soluble) phases into
each other.
Disperse medium: It is the component of a dispersion that is lower in quantity. It is also known as
dispersed medium, internal medium or discontinuous medium. The word of “phase” is equally used as an alternative to the word of “medium”.
Dispersion medium: It is the component of a dispersion that is higher in quantity. It is also known as
dispersion medium, external medium or continuous medium. The word of “phase” is equally used as an alternative to the word of “medium”.
Particle: It is defined as a small object that behaves as a whole unit in terms of its transport and
properties.
Fine particle: A particle that has at least one dimension in the range of 100 to 2500 nm. Nano particle: A particle that has at least one dimension in the range of 1 to 100 nm. Colloidal particle: A particle that has at least one dimension in the range of 1 to 1000 nm. Colloid: A dispersion that involves colloidal particles is termed as colloid or colloidal dispersion. Aggregation: A process by which particles collect to form a cohesive mass or cluster, the resulting
structure is called aggregate.
De-aggregation: It is inverse process of the aggregation.
Wet grinding process: The grinding process in which grinding material is treated in liquid phase. Suspension: It is the dispersion formed by dispersing the solid particles in a liquid.
I.6 References
Babick F., Frank H., Ripperger S., Dependence of ultrasonic attenuation on the material properties, Colloids and Surfaces A, 172 (2000) 33-46.
Literature Review
CHAPTER II
*
*
As per requirements of the university, a preface in the beginning and concluding remarks at the end of the chapter have been given in French.
Préface en français
Avant de présenter le travail que nous avons mené dans le cadre de cette thèse, nous allons rappeler dans ce chapitre quelques éléments importants pour situer le contexte scientifique de l’étude.
Comme nous l’avons précisé en introduction, les dispersions solide-liquide traitées par broyage humide sont généralement des systèmes concentrés, contenant des impuretés ou des additifs et qui sous l’effet des forces mécaniques appliquées subissent des modifications de distribution de taille importantes. Les opérations de broyage ultrafin ou de nanobroyage permettent même l’obtention de particules colloïdales. Dans les milieux colloïdaux, les forces s’exerçant entre les particules conditionnent l’état de dispersion des suspensions. Au cours des procédés de broyage, il n’est pas rare que des additifs soient ajoutés aux suspensions traitées pendant ou après l’opération pour éviter la re-agrégation des fragments fins produits et assurer la stabilité des suspensions broyées. Aussi, dans une première partie, nous rappellerons les principales forces attractives et répulsives s’exerçant dans les milieux colloïdaux et nous évoquerons les méthodes usuelles permettant de garantir la stabilité des suspensions broyées.
Dans une deuxième partie, nous donnerons quelques généralités sur les techniques optiques et acoustiques que nous avons utilisées pour la caractérisation de la taille de particules en suspension. Nous développerons notamment les techniques par diffraction laser et par diffusion dynamique de la lumière, ainsi que la technique acoustique basée sur la mesure de l’atténuation d’une onde sonore. Enfin, la dernière partie de ce chapitre sera consacrée au procédé de broyage en voie humide et plus particulièrement aux procédés reposant sur la technologie des broyeurs à billes agités qui feront l’objet des chapitres V et VI.
II. Literature Review
A particle that has a linear dimension in the range 1nm to 1 µm is termed as colloidal particle and a dispersion of such particles is called a colloidal dispersion or a colloid (Schramm, 2004, Lagaly, 2005). Colloidal dispersions have wide applications in many areas such as paints, pigments, paper coatings, adhesives, catalysts, absorbent materials, fillers, printing inks, carbonless copying papers, emulsions, micro emulsions, ointments, ceramics, cement, fiber, reinforcement of plastics, dairy products, water proofing materials, cleansing agents and cosmetics etc. Colloidal particles, due to small size and high surface area-to-volume ratios, exhibit physicochemical properties that differ from those of the constituent atoms or molecules yet are also different from macroscopic material. This study deals with applications of particle sizing techniques in production of dispersions of fine and nano particles (colloidal dispersions) by means of wet grinding process. This chapter reviews three important issues addressed in this study: colloidal stability, particle sizing of colloids and production of colloids by means of wet grinding process.
II.1 Colloidal stability
II.1.1 Surface forces between colloidal particles
There exist many repulsive and attractive forces between colloidal particles and their mutual interaction play an important role in determining colloidal stability (Schramm 2004). In different studies, these forces have been termed differently leading to bit confusion. This is, probably, due to different context, nature of application or different names of contributing scientists etc.
II.1.1.1 London-van der waals forces
These are due to interaction between two dipoles which are either permanent or induced. In some cases, if the particles do not have a permanent dipole, fluctuations of the electron density gives rise to a temporary dipole in a particle. This temporary dipole induces a dipole in particles nearby. The temporary dipole and the induced dipoles are then attracted to each other. In the literature, many methods and approaches have been proposed in order to measure such forces. For example, Bown and Jenner (1995), Dzyaloshinskii et al. (1961), Hough and White (1980) and Niham and Parsegian (1997) have discussed different methods to calculate the London-van der Waals interaction energy. These methods may broadly be classified into: (1) microscopic approaches and (2) macroscopic approaches. In a microscopic approach, the work of London (1930) and Wang (1927), Margenau (1931), Hamaker (1937) and de Boer (1936) are important. In these studies, the Hamaker’s approach is not only easy in
understanding but also that it works over a wider range (Liang et al., 2007). He considered spherical bodies, assumed pairwise additivity of interatomic dispersion energies, and demonstrated the essential results that although the range of atomic forces was of the order of atomic dimensions, the sum of the dispersion energies resulted in an interaction range for colloidal bodies of the order of their dimensions (Liang et al., 2007). For two spheres of equal radius, a, at a surface to surface separation distance, D, apart along the centre to centre axis, the total interaction energy, VA , is given by:
2 2 2 2 2 2 ) 2 4 1 ln 2 2 4 2 6 ) ( a D a a D a aD D a A D V H AIf the Hamaker constant (AH) is known, it is possible to calculate the interaction energy between the
particles provided that the particle radius (a) and interparticle distance (D) are known. In a macroscopic approach, the problem of additivity is completely avoided in the Lifshitz theory (1956). In this theory, atomic structure is neglected and large bodies are treated as continuous media and forces are derived in terms of the bulk properties such as dielectric constants and refractive indices (Liang et al. 2007). However, all the aforementioned equations for the interaction energies remain valid even within the framework of continuum theories. The difference is that the Hamaker constant is to be calculated in a different way. The details on the techniques to calculate Hamaker constant under a range of situations may be studies in the work of Gregory (1970), Hom (1981), Israelachvili (1972), Mahanty and Ninham (1976), Prieve and Russel (1988). Knowing the interaction energy (VA) and
surface to surface separation distance between two spheres of equal radius (D), the attractive force (FA)
may be calculated as:
D V F A A d d
The literature review explains that despite availability of aforementioned equations, the determination of exact interaction energy is complicated. Hamaker constant may be influenced by number of factors such as retardation effect. Mahanty and Ninham (1976) have discussed some of such cases in detail.
II.1.1.2 Electrical double layer forces
Colloidal particles dispersed in water and any liquid of high dielectric constant usually develop a surface charge. Israelachvili (1992) discusses that the charging of a surface in a liquid can be brought about in two charging mechanisms: (i) by the ionization or dissociation of surface groups, which leaves behind a charged surface (e.g., the dissociation of protons from carboxylic groups, which leaves behind a negatively charged surface) and (ii) by the adsorption (binding) of ions from solution onto a previously uncharged surface. The adsorption of ions from solution can also occur onto oppositely charged sites, also known as ion exchange. Liang et al. (2007) explain that electrical neutrality of the system implies that the dispersing medium must contain an equivalent charge of the opposite sign. These charges are carried by ions, i.e., by an excess of ions of one sign on the particle surface and an
…… (2.2) …… (2.1)
excess of ions of the opposite sign in the solution. If we consider an individual particle immersed in the liquid, it is surrounded by an electric double layer. One of this double layer is formed by the charge in the surface of the particles. Another layer of the electrical double layer is formed by the excess of oppositely charged ions in the solution. As a result of their thermal motion the electric charge carried by this layer extends over a certain distance from the particle surface, and dies out gradually with increasing distance (diffuse layer) into the bulk liquid phase. Bell et al. (1970), Gregory (1975), Hogg and Healey (1966), Ohshima and Kondo (1988), Kar and Chander (1973) discuss the different means of determining sphere-sphere double layer interaction energy in detail. However, the work of Bell et al. (1970) that is based upon linear superposition approximation (LSA) provides a simple expression for determining sphere-sphere double layer interaction energy as below:
exp( ) 128 2 1 2 2 1 2 1 kh a a kT n a a VR
Where, h is the surface-surface separation between the particles, a the particle radius of different sizes, κ the Debye–Hückel parameter, n∞ the bulk density of ions and γ the reduced surface potential
kT
ze
4
tanh
The above equation is valid when both the conditions κ a > 5 and h << a are satisfied.
II.1.1.3 Steric forces
Steric forces between polymer-covered surfaces or in solutions containing non-adsorbing polymer can modulate interparticle forces, producing an additional steric repulsive force (which is predominantly entropic in origin) or an attractive depletion force between them. Theories of steric interaction are not well developed (Liang et al., 2007). However, the work of de Gennes (1987) and Milner et al. (1988) explain that the magnitude of the force between surfaces coated with polymers depends on three important factors:
The quantity or coverage of polymer on each surface.
On whether the polymer is simply adsorbed from solution (a reversible process) or irreversibly grafted onto the surfaces.
On the nature of the solvent.
Liang et al. (2007) explain that different components contribute to the force, and which component dominates the total force is situation specific.
…… (2.3)