To link to this article: DOI: 10.1016/j.powtec.2010.08.046
URL : :
http://dx.doi.org/10.1016/j.powtec.2010.08.046
This is an author-deposited version published in:
http://oatao.univ-toulouse.fr/
Eprints ID: 5549
To cite this version:
Fenech, Justine and Dalbin, Michel and Barnabé, Antoine and Bonino,
Jean-Pierre and Ansart, Florence Sol–gel processing and characterization
of (RE-Y)-zirconia powders for thermal barrier coatings. (2011) Powder
Technology, vol. 208 (n° 2). pp. 480-487. ISSN 0032-5910
O
pen
A
rchive
T
oulouse
A
rchive
O
uverte (
OATAO
)
OATAO is an open access repository that collects the work of Toulouse researchers
and makes it freely available over the web where possible.
Any correspondence concerning this service should be sent to the repository
administrator:
[email protected]
Sol–gel processing and characterization of (RE-Y)-zirconia powders for thermal
barrier coatings
J. Fenech
a,⁎
, M. Dalbin
b, A. Barnabe
a, J.P. Bonino
a, F. Ansart
aaUniversité de Toulouse UPS-INP-CNRS, Institut Carnot CIRIMAT, 118 route de Narbonne, 31062 Toulouse cedex 09, France bDGA-DGE-CEAT, 47 rue St Jean-BP93123, 31131 Balma Cedex, France
a b s t r a c t
The effect of doping on the structural, morphological and thermal properties of ZrO2–XO1.5(X = Y, La, Sm, Er)
solid solutions for thermal barrier (TBC) applications was investigated. Oxide powders of various compositions from 9.7 to 40 mol% XO1.5(X = Y, La, Sm, Er) were synthesised by the sol–gel route. The
structural analysis of the powders was performed using X-ray diffraction analysis coupled with Rietveld refinements and the measurement of their specific surface area with the BET method. For each rare earth dopant, the morphology of the powders varies from monoliths to agglomerates of thinner particles when the doping amount increases. In order to determine the specific heat, the thermal diffusivity at room temperature and the thermal expansion coefficient of some selected compositions, DSC, laser thermal diffusivity and high-temperature dilatometry measurements were performed on samples densified by Spark Plasma Sintering. Working thermal characterisation indicated that zirconia doped with 30 mol% SmO1.5and ErO1.5have better
insulation properties and a lower thermal expansion coefficient than our reference YSZ ceramic. These various compositions are very promising for the elaboration of multilayer TBCs by the sol–gel process.
1. Introduction
Nowadays, the increase of the operation temperature in turbines to get more powerful engines requires the need to decrease as much as possible the thermal conductivity of the thermal barrier coatings (TBCs) in order to protect and maintain superalloys' thermo-mechanical performance. The most widely used ceramic is yttria stabilised zirconium (YSZ) because this ceramic presents, in some conditions, the metastable tetragonal t′ phase, essential for the structural hardening during cooling[1]. Two physical-route processes, giving quite different microstructures of coatings, are largely used to elaborate YSZ TBCs. Plasma Sprayed (PS) coatings present a lamellar microstructure with a low thermal conductivity in the range of 0.7– 0.9 W m−1K− 1 [2]. In parallel, Electron Beam Physical Vapour
Deposition (EB-PVD) coatings [3] with columnar microstructure coatings present the best mechanical performance. But perpendicular orientation of the columns makes their thermal conductivity twice higher than PS coatings[4]. In order to further enhance thermal stability and decrease thermal conductivity of zirconia ceramics at elevated temperature, research is focused on developing lower thermal conductive TBC materials[5–8]. Promising ceramic materials are rare earth (RE) zirconia with a different doping content[9–12].
Zirconates with a general formula of Re2Zr2O7are reported to have
very low thermal conductivity[13]. The La2Zr2O7pyrochlore phase is
particularly interesting because of its low thermal conductivity[14]
and high melting point (2700 °C). Furthermore, no phase transfor-mation between room temperature and the operation temperature are expected occur[15]. However the major disadvantage is its low thermal expansion coefficient (9.1 × 10− 6K− 1) compared to the
metallic substrate one, which is not very interesting for shaping a monolayer TBC. Nevertheless, some studies present LaSm2Zr2O7
ceramic as a promising material due to a lower thermal conductivity compared to La2Zr2O7and a higher thermal expansion coefficient[16].
Progress has also been made in developing multilayer TBC systems in which each layer carries out a particular function [17–24]. The top layers have to limit the thermal transfer. The layer at the surface of the metallic substrate, generally the YSZ layer with a thermal expansion coefficient (10 · 10− 6K− 1to 12 · 10− 6K− 1) close to the nickel-based
superalloy (14 · 10− 6K− 1), facilitates thermal expansion matching
(cf.Fig. 1).
If the choice of new doping elements and new architectures are being considered, the type of coating process is also a parameter to take into account for optimising the isolating properties of TBCs. The classical EB-PVD and Plasma Spray are directional methods often requiring costly investments and complicated operations, while the chemical sol–gel route has been investigated for a few years as an alternative process to prepare, by suitable chemical modifications, nanocrystalline materials [25]. Combined with the dip-coating process, it is a versatile process able to produce either thin ceramic ⁎ Corresponding author.
E-mail addresses:[email protected](J. Fenech),[email protected] (M. Dalbin),[email protected](A. Barnabe),[email protected] (J.P. Bonino),[email protected](F. Ansart).
coatings or thick deposits. Moreover, as well as being a nondirectional deposition technique, the main advantage of the sol–gel method is to decrease the crystallisation temperature to a value much lower than conventional processes[25–27].
The shaping of sol–gel TBCs by dip-coating requires the formulation of stable composite sols composed by ceramic powders with controlled structures, morphologies and thermal properties. For this reason, the present study focuses on the elaboration and the characterisation of solid solutions of zirconia doped with yttrium, lanthanum, samarium and erbium. This paper investigates the influence of the doping content on the structural and morphological properties of the powders. Subse-quently, X-ray analyses and Rietveld refinements were performed to determine the crystallographic properties of the synthesised powders. Specific surface area measurements using the BET method, in association with a morphological study by SEM microscopy were investigated. Some of the different powders were selected for an intrinsic thermal characterisation. Thermal diffusivity and thermal dilatation measure-ments — two important properties for TBC applications — were performed on dense samples.
2. Experimental section
2.1. Synthesis of doped zirconia powders
Zirconia precursor gels with 9.7 mol% YO1.5 were synthesised
because the resulting powder presents the desired t′ phase and remains our reference material for sol–gel TBCs applications[28]. Then, zirconia gels with a range of 9.7–40 mol% LaO1.5, SmO1.5and
ErO1.5 were also prepared by the sol–gel process. As indicated
previously, the lower value corresponds to the reference and the upper value corresponds to a new investigated phase. In fact, the aim was to investigate the different crystallographic systems that can be formed in this large range of doping concentration. Compounds with 40 mol% doping content allow synthesis of the insulating pyrochlore phase, as it can be observed on the phase diagrams of ZrO2–La2O3and
ZrO2–Sm2O3. All syntheses have been done in 1-propanol (solvent,
Acros Organic, purity N 99%), acetylacetone (AcAc, Aldrich, purity N 99%) and water system. Nitrate hexahydrate salts, including yttrium (III), lanthanum (III), samarium (III) and erbium (III) salts (X(NO3),
6H2O (X = Y, La, Sm, Er), purity N 99%, Acros Organics), and zirconium
(IV) propoxide (Zr(OPr)4, Aldrich), were chosen as precursors. The
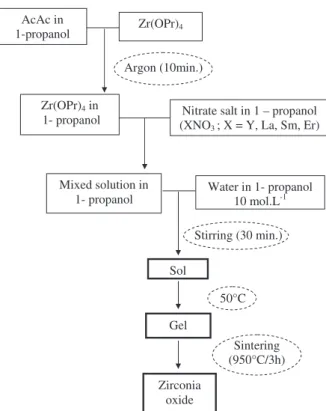
different reagents are introduced into the mixture in an order as presented on the flowchart in Fig. 2. Acetylacetone, used as a complexing agent, prevents the reaction of the alkoxide with water, which is an important procedure to ensure success of the synthesis. Furthermore, all the syntheses were performed under argon atmo-sphere to avoid the problem of fast hydrolysis of alkoxide with water. The molar ratios [AcAc]/[Zr(OPr)4] and [H2O]/[Zr(OPr)4] are 0.7 and
8.5 respectively; and the zirconium propoxide concentration is kept constant at 0.5 mol/L. The gelation reactions, hydrolysis and conden-sation reactions were carried out at room temperature in ambient atmosphere. Once ready, the sols are mechanically stirred for half an hour and then dried in an oven at 50 °C until they gelify after a few hours.
2.1.1. Annealing
After drying, xerogels were sintered at 950 °C for 3 h in air (heating rate: 100 °C/h) to obtain the desired oxide materials. Zirconium powders doped with yttrium, lanthanum, samarium, erbium are referred to as YSZ, LZ, SZ, EZ respectively. The number before YSZ, LZ, SZ and EZ corresponds to the molar percentage of dopant XO1.5(X = Y, La, Sm, Er).
2.1.2. Spark Plasma Sintering (SPS)
Spark Plasma Sintering (SPS) was used only for the thermal measurements. Powders with the required compositions were sintered using the SPS device (Dr. Sinter, SPS 2080) at the University of Toulouse (France), to obtain dense samples with 2 mm thickness and 15 mm diameter. The Spark Plasma Sintering is a new sintering technique used for rapid densifications at moderate temperature compared with conventional sinterings[29]. The powders were put into a graphite die in which both die wall and the surface of the powder were covered by graphite foils. The DC current density was kept equal to 200 A cm− 2
with 3 ms pulse sequences, and a vaccum level of 2–3 Pa was maintained during the sintering process. The samples were compacted at 1000 MPa and the treatment temperature is 1000 °C for 5 min and 1200 °C for 20 min for YSZ and RE zirconia respectively.
Thermal accomodation
Pyrochlore or tetragonal phase Thermal insulation
Yttria doped zirconia with t’ phase
Substrate
YSZ
Duplex system “ Zirconia + RareEarths”
Bond coat
Fig. 1. New architecture for thermal barrier coating systems.
Stirring (30 min.) Argon (10min.)
AcAc in
1-propanol Zr(OPr)4
Zr(OPr)4 in
1- propanol (XNONitrate salt in 1 – propanol
3 ; X = Y, La, Sm, Er) 50°C Sol Mixed solution in 1- propanol Water in 1- propanol 10 mol.L-1 Gel Zirconia oxide Sintering (950°C/3h)
2.2. Characterisation methods 2.2.1. Structural analysis by XRD
The structural analysis of the synthesised materials was performed using X-ray Diffraction coupled with Rietveld Refinement. The patterns were collected at room temperature in the range of 20°– 100° with a Brucker AXS D4 diffractometer. Copper radiation has been used as the X-ray source (λ(CuKα1) = 1.5406 Å; λ(CuKα2) = 1.5445 Å)
and filtered with Ni filter. The peak identification was conducted using the JCPDS database. For the tetragonal, fluorite and pyrochlore phases, the space group used for Rietveld refinement were P42/nmc (137) and
Fm3m (225), Fd3m (227 respectively).
2.2.2. Measurement of the specific surface area of the powders The specific surface area Sw(m2g− 1) of the powders calcined at 950 °C
was determined by the BET method using N2adsorption–desorption at
77 K. All powders were first degassed at 250 °C for 40 min before nitrogen adsorption.
2.2.3. Microstructure
The morphology of the samples was determined using a JEOL JSM-6400 SEM and a FEG 6700 F SEM with a field emission gun. 2.2.4. Measurement of thermal properties
Dense cylindric specimens of (RE-Y) zirconia powders with both 9.7 and 30 mol% doping content were prepared by Spark Plasma Sintering (SPS) for the investigation of their thermal diffusivity, heat specific capacity and thermal expansion coefficient. These three intrinsic thermal properties were determined on specific devices at the aeronautic test centre of Toulouse (C.E.A.T., Toulouse, France). 2.2.4.1. The specific heat capacity (cp). The specific heat capacity (cp)
was measured as a function of temperature between room temper-ature and 800 °C in argon atmosphere, using a differential scanning calorimeter DSC (Model SETARAM DSC111). Sapphire (Ref: SRM 720) is the reference material used for the calibration of the system. We processed by steps with a succession of 5 °C/min heating rate and isothermal stages every 30 °C.
2.2.4.2. Thermal diffusivity. Values for the thermal diffusivity (Dth) of
the samples were obtained at room temperature using the laser-flash method (SOPRA 2000). This method consists of heating the front face of the sample by a uniform laser beam in order to detect the temperature increase on its rear surface by an infrared detector. A graphite film was deposited on the two surfaces of the samples to guarantee the absorption and the detection of the IR radiation just on the sample surfaces; and measurements have been done under argon. The thermal conductivity λ of the selected compounds at room temperature was calculated using Eq.(1), where ρ is the bulk density of the sample measured by the Archimedes method. Each sample was measured four times at ambient temperature.
λ= DthðTÞcpðTÞρðTÞ: ð1Þ
0
25 35 45 55 65 75 85 95
2 Theta (°)
Intensity (Arb. U.)
0
25 35 45 55 65 75 85 95
2 Theta (°)
Intensity (Arb. U.)
(a)
- LZ powders
30 LZ 20 LZ 15 LZ 9.7 LZ 40 LZ * * * * * * * * * * ° ° ° ° ° ° ° ° ° ° ° * * *(b)
– SZ powders
• * * 30 SZ 20 SZ 15 SZ 9.7 SZ 40 SZ • ° * ° ° * * * • • • • • * * * * * * ° • • • * * * * • • • • • • • • • • • • 0 25 35 45 55 65 75 85 95 2 Theta (°) Intensity (Arb.U.)(c)
- EZ powders
30 EZ 20 EZ 15 EZ 9.7 EZ 40 EZ *
•
* *•
* * * * * *•
•
•
•
•
•
•
•
•
•
•
• •
•
•
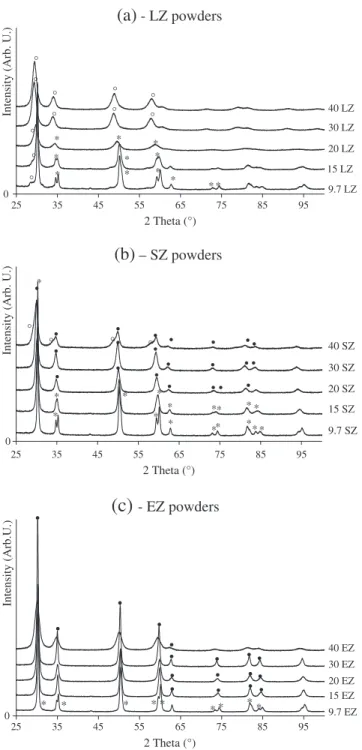
Fig. 3. XRD patterns of doped zirconia powders calcined at 950 °C. Nomenclature: * tetragonal phase ; ° pyrochlore phase;•fluorite phase.
Table 1
Summary of the structural analysis of the doped zirconia powders synthesised via sol– gel process.
Powders Phases Cell parameters (Å) c/af
9.7 YSZ t′ a = 3.6129(5); c = 5.162(2) 1.0101(6) 9.7 LZ t major phase a = 3.605(2); c = 5.195(3) 1.018(1) Pyr 15 LZ t major phase a = 3.6184(5); c = 5.198(1) 1.0158(3) Pyr 20 LZ t major phase a = 3.6242(7); c = 5.203(2) 1.0151(6) Pyr 30 LZ Pyr a = 10.601(4) 40 LZ Pyr a = 10.580(5) 9.7 SZ t a = 3.6132(2); c = 5.1838(4) 1.1447(1) 15 SZ C major phase a = 5.144(1) t′ 20 SZ C a = 5.163(8) 30 SZ C a = 5.177(2) 40 SZ C major phase a = 5.2090(8) Pyr 9.7 EZ t a = 3.6010(2); c = 5.1650(4) 1. 0142(1) 15 EZ C a = 5.1296(6) 20 EZ C a = 5.1341(4) 30 EZ C a = 5.142(1) 40 EZ C a = 5168(1)
Fig. 4. SEM micrographs of the (RE-Y) zirconia powders calcined at 950 °C: (a) YSZ powder — (b) influence of the doping content on the microstructure of LZ powders — (c) influence of the nature of the doping on the microstructure of RE zirconia powders.
In this study, the thermal diffusivity values were only determined at room temperature. We have to underline the fact that the aim of this work is to establish a rank of these selected materials according to their thermal conductivity, since we strongly expect the same hierarchy at higher temperatures in the range of 800 °C–1200 °C (operating temperatures of the turbomachines). In fact, the main interest of this study is to discriminate and to select, among these samples, the most interesting materials for shaping the future sol–gel TBCs, rather than studying the thermal conductivity as intrinsic values.
2.2.4.3. Thermal expansion coefficient. The measurement of the thermal expansion coefficient (TEC) of the selected compounds was performed using a high-temperature dilatometer (SETARAM DHT 2400) from room temperature to 1050 °C (heating rate: 5 °C/min) under argon. This characterisation consists of studying the temperature-dependent change of length of the material. The samples are parallelepipeds (5 mm× 10 mm) sawed in the cylindric samples densified by SPS.
3. Results and discussion
3.1. Structural analysis of the ceramic powders
YSZ powder elaborated via sol–gel route was previously studied
[28]. To sum up, 9.7 YSZ compound crystallises in the metastable tetragonal phase (t′ phase) with a tetragonality close to 1.010.
Fig. 3a presents the X-ray diffraction patterns relative to the LZ powders with a variable doping concentration. It clearly shows the evolution of the crystalline structure when the molar lanthanum content increases. Up to 20 LZ, the powders crystallise essentially in the tetragonal structure since the observed diffraction peaks relative to the pyrochlore La2Zr2O7phase are not well defined and have a low intensity. 30 LZ and 40
LZ powders change from a quadratic phase to a pure pyrochlore phase. The four main diffraction peaks identified with the JCPDS database (073– 444) are typical of this phase. Moreover, the shift of the (222) diffraction peak towards the higher angles is observed when the lanthanum content increases. This is indicative of a decrease in the cell parameters between 30 LZ (10.601(4)Å) and 40 LZ (10.580(5)Å).
SZ powders present 3 crystalline structures according to the doping content (seeFig. 3b). The tetragonal phase appears for 9.7 SZ. 15 SZ is composed by a minor tetragonal phase and a major cubic (c) phase. The pyrochlore phase Sm2Zr2O7is also appearing in the 40 SZ compound but
its proportion in the solid solution is very low compared to the cubic phase.
The values of tetragonality (Table 1) indicate that whatever the nature of doping (lanthanum or samarium), the ratio c/a ffiffiffi2p decreases when the amount of dopant increases. This result has been already noticed for YSZ
powders with various amounts of yttrium [28]. Powders doped with erbium present both tetragonal and cubic phases. 9.7 EZ powder is a pure tetragonal solid solution whereas for 15 EZ to 40 EZ the powders crystallise in the cubic form. The shift of the diffraction peaks towards the lower angles observed inFig. 3c with the increase of the erbium content indicates an increase in the unit cell parameters. This phenomenon is likely due to the expansion of the unit cell when increasing the substitution of Zr4+atoms by Er3+atoms, which has a higher ionic radius.
3.2. Morphological analysis of the ceramic powders
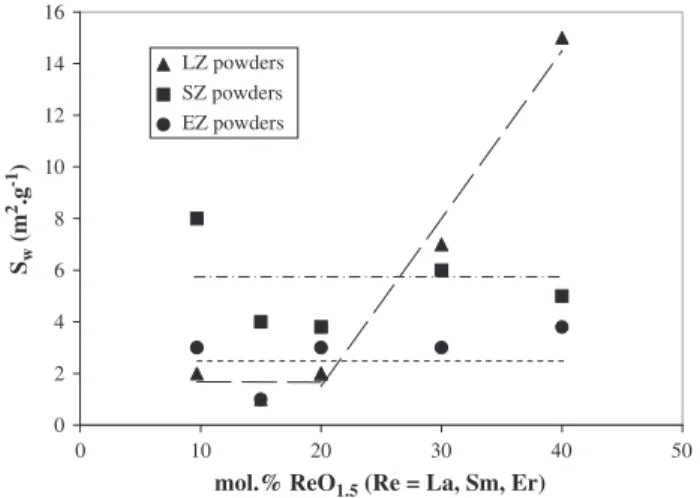
Fig. 4presents the different morphologies of the rare earth zirconia powders after heat treatment at 950 °C. The observation of the different compositions by scanning electronic microscopy suggests some identical microscopic characteristics between the three rare earths used (Fig. 4b,c). We can notice that for the lower doping content (9.7 mol%), powders exhibit hard particles whose size varies in the range of 20 μm–50 μm. The reference starting material 9.7 YSZ exhibits the same microstructure (Fig. 4a). With the increase of the substitution concentration of zirconia, these particles became much smaller as it is observed for 20 LZ. When the rare earth content increases above 20 mol%, the microstructure drastically changes, with powders presenting agglomerates of thinner particles and a more homogeneous granulometry. Moreover, the hard particle popula-tion has totally disappeared. The changing of the crystalline structure (t→Pyr for LZ powders or t→c for SZ powders) contributes to the morphological evolution in doped zirconia powders. In fact, after the identical heat treatment at 950 °C, the increase of the number of inserted rare earth atoms in the zirconia lattice improves the particle brittleness. The microstructure of the LZ powders can be correlated with the specific surface area measurements (Fig. 5) which shows that the Sw
values increase from 2–4 m2g− 1for 9.7 LZ–20 LZ to 14 m2g− 1for 40 LZ.
This evolution is directly linked to the increase in doping. However for the SZ and EZ powders, the variation of Swvalues is not significant since
whatever the doping content, Swvalues are inferior to 10 m2g− 1. The fact
that some porosity (cf.Fig. 4(b) (30 EZ powder)) are not accessible by the BET method may be an explanation.
0 0 10 20 30 40 50 2 4 6 8 10 12 14 16 LZ powders SZ powders EZ powders Sw (m 2.g -1)
mol.% ReO1.5 (Re = La, Sm, Er)
Fig. 5. Evolution of the specific surface area (Sw) of doped zirconia powders versus the
molar rate of rare earth. Two behaviours for LZ powders ( ); single behaviours for SZ ( ) and EZ powders ( ).
Table 2
Crystalline structure of the densified ceramic bulks.
Samples SPS compaction time and temperature Crystalline structure 9.7 YSZ 5 min at 1000 °C t′ 9.7 LZ t 9.7 SZ t 9.7 EZ C 20 min at 1200 °C 30 LZ Pyr 30 SZ C 30 EZ C * 30 LZ 30 SZ 30 EZ 0
25
35
45
55
65
2 Theta (°)Intensity (Arb. U.)
° • • • • • • °
Fig. 6. XRD patterns of 30 LZ, 30 SZ and 30 EZ bulk ceramics. Nomenclature: ° pyrochlore phase;•fluorite phase; * peak of the carbon graphite used for the densification of the bulk
3.3. Thermal properties of the selected compounds
Besides their thermal properties, the powders have to exhibit both interesting morphologies and specific surface area in order to facilitate the formulation of stable slurries for the dip-coating process. For this reason, the compositions 30 LZ, 30 SZ and 30 EZ have been selected because of their microstructure with soft agglomerates of small particles. 30 LZ has also been selected because the pyrochlore phase is known to present good thermal-insulation properties. In this study, the key point is to compare, for an identical doping content, the influence of the nature of the rare earth on the thermal conductivity and the thermal expansion. This study will be also done for the powders with a 9.7 mol% doping amount.
3.3.1. Thermal conductivity of the selected compounds
Densified samples were required for the measurement of the specific heat capacity, thermal diffusivity and thermal expansion of the zirconia
powders doped with 9.7 mol% and 30 mol% XO1.5(X=Y, La, Sm, Er). The
relative densities of these sintered ceramics, given inTable 2, are in the range of 90–96%. Apart from a compaction temperature of 1200 °C for the rare earth ceramics, no transformation phase has occurred. For example, the diffraction patterns of the 30 mol% RE-Z bulk ceramic after SPS sintering are presented inFig. 6. On these diagrams, we notice that the phases previously obtained at 950 °C are preserved after a thermal treatment and processing at 1200 °C. In parallel, a microstructural study has been performed on these three bulk ceramics and also on the same samples with 9.7 mol% doping content (Fig. 7). It reveals grains with a homogeneous size for each sample and also a grain growth for 30 mol% compared to 9.7 mol%. Some pores may appear for the two selected doping rates, but in general, the densification of the bulks due to the coalescence of the grains is sufficient to ensure good thermal diffusivity measurements. Moreover, for a doping rate of 30 mol%, it can be observed that the densification state depends on the substituting trivalent rare earth cation.
The specific heat capacity curves of the selected bulk ceramics as a function of temperature are plotted onFig. 8. For all of them, the specific heat increases with the increase of temperature under similar temperature conditions. Moreover, for each sample, the experimental
1µm
1µm
1µm
9.7 LZ
9.7 SZ
9.7 EZ
30 LZ
1µm
30 EZ
30 SZ
1µm
1µm
Fig. 7. Bulks of the rare earth zirconia samples densified by Spark Plasma Sintering (SEM-FEG micrographies).
400 200 300 400 500 600 700 800 900 1000 1100 450 500 550 600 650 Temperature (K) cp (J/(kg.K)) 9.7 YSZ 9.7 LZ 9.7 SZ 9.7 EZ 30 LZ 30 SZ 30 EZ
Fig. 8. Specific heat capacity of the selected compositions versus temperature.
Table 3
Comparison between the experimental and the theoretical values of the molar heat capacity (cpm(J.mol− 1K− 1)) calculated according to the Neumann–Kopp rules.
Samples Experimental values at 298 K Theoretical values at 298 K cp(J kg− 1K− 1) cpm(J mol− 1K− 1) cpm(J mol− 1K− 1) 9.7 YSZ 470 57.4 55.7 9.7 LZ 445 56.5 56.0 9.7 SZ 442 56.5 56.4 9.7 EZ 440 57.1 56.0 30 LZ 418 239 221 30 SZ 410 56.8 56.7 30 EZ 405 58.2 56.0
molar heat capacity cpm(J mol− 1K− 1) of the mixed oxides corresponds
to the contributions of the two individual ones, which is consistent with the Neumann–Kopp rule[30](cf.Table 3). Eqs.(2) and (3)presented below have been verified:
CpmðZrð1−xÞRexO2−x = 2Þ = ð1−xÞCpmðZrO2Þ + x = 2CpmðRe2O3Þ ð2Þ
CpmðLa2Zr2O7Þ = 2 CpmðZrO2Þ + CpmðLa2O3Þ ð3Þ
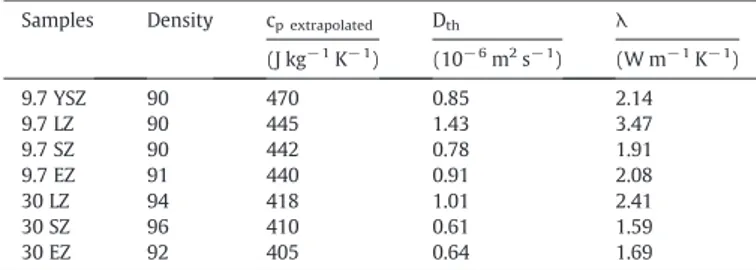
The thermal conductivities λ of the selected samples, calculated according to Eq.(1)with the thermal diffusivity values, specific heats and density, are presented inTable 4. The reported values are the arithmetic average of 4 measurements performed on each ceramic. According to the theory, the lattice thermal conductivity is proportional to the free path of phonons[31]. When substituting two Zr4+by two trivalent cations like Y3+, La3+, Sm3+, Er3+, one oxygen vacancy is created in the lattice to
maintain its electroneutrality. Moreover, the concentration of oxygen vacancies will increase with the content of X2O3(Re=La, Sm, Er). As a
consequence, the thermal conductivity of the ceramics will decrease when the doping content is increased due to the scattering of the phonon via these oxygen vacancies. The experimental results confirm the theory: for a same doping element, the thermal conductivity is decreasing when increasing the XO1.5content (X= La, Sm, Er). As a result, 30 LZ, 30 SZ and
30 EZ exhibit better insulating properties than 9.7 LZ, 9.7 SZ, 9.7 EZ respectively, which can be also correlated to the grain growth observed at higher doping concentration (Fig. 7). Moving on to the influence of the nature of the dopant for a given doping amount, we can observe that samarium doping gives a lower thermal conductivity than erbium. This can be explained by a higher ionic radius for the Sm3+ cations
(0.1079 nm) compared to the Er3+cations (0.1004 nm). The increase
of the ionic radius of the substituting atoms limits the mean free path of phonons and thus leads to a lower thermal conductivity.
From the values obtained inTable 4, samarium and erbium doped zirconia ceramics with a controlled stoichiometry are potential candidates for high-temperature and thermal-insulation applications since they already give interesting insulating values at room temperature, assuming that these values can be extrapolated at higher temperatures. This
speculation will have to be confirmed later. It is difficult to conclude for the doping with lanthanum. Except for 30 LZ, the thermal conductivity of the selected compounds at room temperature is located in the range of 1.52–2.41 W m− 1K− 1, which is lower than the fully dense ZrO
2–7wt.%
Y2O3(3.0 W m− 1K− 1) as reported by Wu et al.[13].
3.3.2. Thermal expansion characteristics of the selected samples
Fig. 9presents the thermal expansions of the selected compounds in the range of 20 °C–1050 °C. As it can be seen on the figure, 9.7 YSZ, 9.7 LZ, 9.7 SZ, 9.7 EZ, 30 SZ and 30 EZ exhibit the same behaviour: the linear thermal expansion increases with respect to temperature. When it increases, the average atomic distance increases too, so the linear thermal expansion becomes more important. The nature of the dopant does not seem to influence the behaviour under temperature: the curves relative to 9.7 YSZ, 9.7 SZ and 9.7 EZ are quite identical, giving rise to TEC constant at 11.24 × 10− 6K− 1, 11.31 × 10⁻⁶K− 1,
11.32 × 10⁻⁶K− 1 respectively. Furthermore, the TEC of 9.7 YSZ is
close to the TEC of 3YSZ (11.5 × 10⁻⁶K− 1) as reported by Cao et al.[6].
Fig. 9and the values inTable 5also indicate that the TEC of 30 SZ and 30 EZ are lower than 9.7 SZ and 9.7 EZ. LZ powders exhibit a quite different behaviour at the same temperature conditions. Actually, 9.7 LZ exhibits a lower TEC than 9.7 SZ and 9.7 EZ. Concerning the 30 LZ compound, the thermal expansion first increases linearly from 20 °C to 800 °C, then decreases from 800 °C to 900 °C, before finally increasing from 990 °C to 1050 °C. This phenomenon is atypical for this sample composed only by the pyrochlore phase which exhibits no transformation phase under temperature. However, this low expan-sion can be correlated to the pure pyrochlore phase that constitutes this sample. We notice that whatever the nature of the doping, the TEC of the selected ceramics decreases with the increasing XO1.5
doping content (X = La, Sm, Er). This can be explained by the effect of filling the lattice by cations with a bigger radius. This induces a limitation in the lattice displacement. But this hypothesis is not in agreement with the works of Liu et al. who showed that the TEC of SmxZr1 − xO2 − x/2(0.2 b × b 0.5) ceramics increases with the increasing
Sm2O3content under temperature conditions[32].
4. Conclusion
ZrO2–XO1.5(X = Y, La, Sm, Er) solid solutions with doping contents
in the range of 9.7–40 mol%. XO1.5were synthesised by the sol–gel
process for thermal barrier applications. For each compound, structural and microstructural analyses were performed. LZ powders moves from a pure tetragonal structure for a low doping concentra-tion, to a pure pyrochlore phase for 30 LZ. Samarium and erbium doped zirconia powders crystallise mainly in the cubic form. The microscopic study suggests quite a similar behaviour between these rare earth doping elements. For each of them, the microstructure moves from compact monoliths (20 μm–50 μm) with heterogeneous size to agglomerates of thinner particles for an average doping amount of 20 mol%. This new structure can explain the higher specific surface areas of the compounds when increasing the doping content. The ceramics (heat treated at 950 °C) with a doping amount of 9.7 and 30 mol% were hot-pressed using the Spark Plasma Sintering method Table 4
Summary of the characteristics at room temperature for the selected samples densified by Spark Plasma Sintering.
Samples Density cp extrapolated Dth λ
(J kg− 1K− 1) (10− 6m2s− 1) (W m− 1K− 1) 9.7 YSZ 90 470 0.85 2.14 9.7 LZ 90 445 1.43 3.47 9.7 SZ 90 442 0.78 1.91 9.7 EZ 91 440 0.91 2.08 30 LZ 94 418 1.01 2.41 30 SZ 96 410 0.61 1.59 30 EZ 92 405 0.64 1.69 0,0 0,2 0,4 0,6 0,8 1,0 1,2 200 300 400 500 600 700 800 900 1000 1100 1200 1300 Temperature (K) Specific expansion (%) 9.7 YSZ 9.7 LZ 30 EZ 30 SZ 9.7 EZ / 9.7 SZ 30 LZ
Fig. 9. Linear thermal expansion of the selected compounds between room temperature and 1300 K.
Table 5
Average thermal expansion coefficients (TEC) of the selected powders.
Samples TEC (10− 6K− 1) 9.7 YSZ 11.2 9.7 LZ 7.44 9.7 SZ 11.3 9.7 EZ 11.3 30 LZ 5.25 30 SZ 10.5 30 EZ 10.7
in order to investigate their thermal diffusivity, specific heat capacity and thermal dilatation. At room temperature, the RE powders exhibit a lower thermal conductivity than our reference YSZ ceramic. 30 SZ and 30 EZ have a lower TEC than YSZ. These powders with various compositions are promising for future thermal barrier coatings by the sol–gel process.
Acknowledgments
The authors would like to thank the French DGA and the CNRS for their financial support (DGA-CNRS grant).
References
[1] L. Lelait, S. Alpérine, C. Diot, M. Mévrel, Thermal barrier coatings: microstructural investigation after annealing, Mater. Sci. Eng. A 120–121 (1989) 475–482 Part 2. [2] F. Crabos, PhD Thesis, Institut National Polytechnique de Toulouse, 96 INPT0092,
France, (1996).
[3] R. Mevrel, C. Rio, M. Poulain, C. Diot, F. Nardou, Technical Report No. 28/2019M, ONERA, 1987.
[4] X. Jiang, C. Liu, F. Lin, Overwiew on the development of nanostructured thermal barrier coatings, J. Mater. Sci. Technol. 23 (2007) 449–456.
[5] P.G. Klemens, M. Gell, Thermal conductivity of thermal barrier coatings, Mater. Sci. Eng. A245 (1998) 143–149.
[6] X.Q. Cao, R. Vassen, D. Stover, Ceramic materials for thermal barrier coatings, J. Eur. Ceram. Soc. 24 (2004) 1–10.
[7] D. Zhu, R.A. Miller, Development of advanced low conductivity thermal barrier coatings, J. Appl. Ceram. Technol. 1 (2004) 86–94.
[8] D.R. Clarke, S.R. Phillpot, Thermal barrier coating materials, Mater. Today (2005) 22–29. [9] G. Suresh, G. Seenivasan, M.V. Krishnaiah, P. Srirama Murti, Investigation of the thermal conductivity of selected compounds of lanthanum, samarium and europium, J. Alloy Comp. 269 (1998) 9–12.
[10] Q. Xu, W. Pan, J. Wang, C. Wang, L. Qi, H. Miao, Rare earth zirconate ceramics with fluorite structure for thermal barrier coatings, J. Am. Ceram. Soc. 89 (2006) 340–342. [11] N.P. Bansal, D. Zhu, Effects of doping onthermal conductivity of pyrpchlore oxides for advanced thermal barrier coatings, Mater. Sci. Eng. A 459 (2007) 192–195. [12] H. Zhou, D. Yi, Effect of rare earth doping on thermo-physical properties of lanthanum
zirconate ceramic for thermal barrier coatings, J. Rare Earth 26 (2008) 770. [13] J. Wu, X.Z. Wei, N.P. Padture, P.G. Klemens, M. Gell, E. Garcia, P. Miranzo, M.I.
Osendi, Low thermal conductivity rare earth zirconates for potential thermal barrier coatings applications, J. Am. Soc. 85 (2002) 3031–3035.
[14] R. Vassen, X. Cao, F. Tietz, D. Basu, D. Stöver, Zirconates as new materials for thermal barrier coatings, J. Am. Ceram. Soc. 83 (2000) 2023–2028.
[15] H.M. Ondik, H.F. McMurie, Overview, Phase Diagrams for Zirconium and Zirconia Systems, Wiley, John & Sons, June 1998, ISBN:1574980556.
[16] X. Qiang, P. Wei, L.W. Chunlei, Q. Longhao, M. Hezhuo, W. Fuchi, A promising LaSmZr2O7ceramic with pyrochlore structure for thermal barrier coatings, Key.
Eng. Mat. 368–372 (2008) 1328–1330.
[17] J. Wilden, A. Wank, Application study on ceria based thermal barrier coatings, Mat. Wiss.u. Werkstofftech. 32 (2001) 654–659.
[18] A. Portinha, V. Teixeira, J. Carneiro, J. Martins, M.F. Costa, R. Vassen, D. Stoever, Characterization of thermal barrier coatings with a gradient in porosity, Surf. Coat. Technol. 195 (2005) 245–251.
[19] H. Dai, X. Zhong, J. Li, Y. Zhang, J. Meng, X. Cao, Thermal stability of double-ceramic-layer thermal barrier coatings with various coating thickness, Mater. Sci. Eng. 433 (2006) 1–7.
[20] X.Q. Cao, R. Vassen, F. Tietz, D. Stoever, New double-ceramic-layer thermal barrier coatings based on zirconoa-rare earth composite oxides, J. Eur. Ceram. Soc. 26 (2006) 247–251.
[21] X. Ma, F. Wu, J. Roth, M. Gell, E.H. Jordan, Low thermal conductivity thermal barrier coating deposited by the solution plasma spray process, Surf. Coat. Technol. 22 (2006) 4447–4452.
[22] Q. Wei, H. Guo, S. Gong, H. Xu, Novel microstructure of EB-PVD double ceramic layered thermal barrier coatings, Thin Solid Films 516 (2008) 5736–5739. [23] R. Vassen, X. Cao, D. Stöver, Improvement of new thermal barrier coating systems
using a layered or graded structure, 25th Annual Conference on Composites, Advanced Ceramics, Materials, and Structures: B: Ceramic Engineering and Science Proceedings, 22, 2008, pp. 435–442.
[24] Y. Liu, Y.F. Gao, S.Y. Tao, X.M. Zhou, H.J. Luo, La2O3-modified YSZ coatings:
high-temperature stability and improved thermal barrier properties, Surf. Coat. Technol. 203 (2009) 1014–1019.
[25] C. Viazzi, J.-P. Bonino, F. Ansart, Synthesis by sol–gel route and characterization of yttria stabilized zirconium coatings for thermal barrier applications, Surf. Coat. Technol. 201 (2006) 3889–3893.
[26] C. Viazzi, A. Deboni, J.Z. Ferreira, J.P. Bonino, F. Ansart, Synthesis by sol–gel route and characterization of yttria stabilized zirconium coatings for thermal barrier applications, Solid State Sci. 8 (2006) 1023–1028.
[27] C. Viazzi, R. Wellman, D. Oquab, J. Nicholls, D. Monceau, J. -Bonino, F. Ansart, Proceedings of the 7th International Symposium on High Temperature Corrosion and Protection of Materials, Les Embiez, 2008, p. 21.
[28] C. Viazzi, J.-P. Bonino, F. Ansart, A. Barnabé, Structural study of metastable tetragonal YSZ powders produced via a sol–gel route, J. Alloy Comp. 452 (2008) 377–383.
[29] C. Estournes, Mise en forme de matériaux par frittage flash, Techniques de l'ingénieur, IN56 (2006).
[30] J. Leitner, P. Chuchvalec, D. Sedmidubsky, A. Strejc, P. Abrman, Estimation of heat capacities of solid mixed oxides, Thermoch. Acta 395 (2003) 27–46.
[31] P.G. Klemens, Theory of thermal conductivity in solids, in: R.P. Tye (Ed.), Thermal Conductivity, vol. 1, Academic Press, London, 1969, pp. 1–68.
[32] Z.G. Liu, J.H. Ouyang, B.H. Wang, Y. Zhou, J. Li, Thermal expansion and thermal conductivity of SmxZr1 − xO2 − x/2(0.1 b × b 0.5), Ceram. Int. 35 (2009) 791–796.