HAL Id: hal-02014465
https://hal.univ-grenoble-alpes.fr/hal-02014465
Submitted on 24 Oct 2019HAL is a multi-disciplinary open access archive for the deposit and dissemination of sci-entific research documents, whether they are pub-lished or not. The documents may come from teaching and research institutions in France or abroad, or from public or private research centers.
L’archive ouverte pluridisciplinaire HAL, est destinée au dépôt et à la diffusion de documents scientifiques de niveau recherche, publiés ou non, émanant des établissements d’enseignement et de recherche français ou étrangers, des laboratoires publics ou privés.
Behavior of Granular Materials Affected by Grain
Breakage
Christophe Dano, Carlos Ovalle, Zhen-Yu Yin, Ali Daouadji, Pierre-Yves
Hicher
To cite this version:
Christophe Dano, Carlos Ovalle, Zhen-Yu Yin, Ali Daouadji, Pierre-Yves Hicher. Behavior of Granular Materials Affected by Grain Breakage. Advances in Multi-Physics and Multi-Scale Couplings in Geo-Environmental Mechanics, Elsevier, pp.95-132, 2018, �10.1016/B978-1-78548-278-6.50004-9�. �hal-02014465�
Behavior of Granular Materials
Affected by Grain Breakage
14.1. Introduction
In geotechnical and particularly in dam engineering, observations in the field and, in some cases, dramatic failures of structures have often incited research and increased knowledge. For instance, the first rockfill dams were elevated without any prior knowledge of the mechanical capacities of the rockfill mass. As natural and local resources are usually preferred for economic and environmental issues, their non-optimal properties can lead to potential severe damage to the hydraulic structure. Similarly, a basic principle of construction of rockfill dams or embankments consists in sluicing rockfill after deposition and before compaction: this recommendation has been adopted for a long time [CLE 81, HUN 02]. However, the beneficial effects of such a practice have been understood only in light of recent studies on unsaturated soil and multi-scale analyses.
Extensive research on the mechanical behavior of rockfills was initiated in North America, in the 1960s and 1970s, with the simultaneous development of high Concrete Face Rockfill Dams (CFRD) for which a better estimation of both stiffness and shear strength properties and optimized design was required. Researchers faced technical challenges related to the size of the testing apparatus, in proportion to the maximum size of rockfill particles close to 200 mm [MAR 72, MAR 73]. Their experimental databases still constitute a reference in geotechnical literature, since the main features of rockfill behavior were clearly highlighted. Particle crushing has thus been identified as a key mechanism of their behavior, inducing a decrease of
Chapter written by Christophe DANO, Carlos OVALLE, Zhen-Yu YIN, Ali DAOUADJI and Pierre-Yves HICHER.
both the secant stiffness and the shear strength, associated with an increase of the compressibility. Subsequent research [CHA 80, COO 04, DAO 01, DAO 10, HAR 85, LAD 96, LEP 70, MCD 02, NAK 01a, NAK 01b, VES 68] showed that grain breakage is favored by higher stress levels, weak, large, elongated and angular particles, uniform and loose grain packings, as well as by the presence of water. The amount of grain breakage also depends on the stress path and degree of humidity [CLE 81, OLD 07]. In this way, shearing paths (triaxial more than oedometric paths) and cyclic drained loadings induce a greater amount of particle crushing.
It becomes quite obvious that a better prediction of the behavior of crushable soils and rockfills requires a deep understanding of the local mechanisms at the grain scale: interactions between grains through the distribution of local forces, mode of degradation of the grains and interactions between solid and liquid phases. It is also necessary to take into account the size effect, currently associated with failure of brittle elements.
Experimental and numerical advances relative to the behavior of crushable soils will be addressed here. The chapter has been divided into three sections: the first deals with the prediction of scale effects through a scale transition approach, the second presents numerical developments, particularly to better describe the evolution of the grain size distribution upon loading and the final one discusses the influence of water on the behavior of crushable soils.
4.2. Size effects in rockfill materials
4.2.1. Micro and macro-scale effects
Typical sizes of particles deposited in rockfill dams range from a few centimeters up to about 100 centimeters. Some difficulties then arise. The estimation of the mechanical properties of a rockfill mass would require testing set-ups involving huge experimental samples, of at least 10 times the maximum grain size. In the absence of such huge devices (the largest triaxial or oedometer cells nowadays allow gradations to be tested with a maximum grain size less than 200mm), alternative strategies must be developed to estimate useful engineering parameters, for instance friction angle and stiffness. Whatever this strategy may be, it implies working on a reduced grain size distribution compatible with available devices using an appropriate reduction method from among the different methods as summarized
by WU et al. [WU 14]. Among these, the most commonly adopted, the similar
as closely parallel as possible to the original one (referred to as the prototype); that is, to divide all the sizes in a homothetic way. Some assumptions must be strictly respected: the two homothetic particle masses must have, as minimal conditions, the same mineralogy, angularity and (relative) density, so that the tested reduced sample is the exact replica of the original material at a smaller scale.
Nevertheless, once test results are obtained, the model stress-strain relationship cannot be extrapolated directly to the original material, since the model and prototype materials may behave differently because of size effects on grain breakage. Size effect is generally described as the dependence of a material property (strength) on a characteristic geometrical dimension (particle diameter), as a result of fracture mechanics. In the present case, size effects occur at both the micro-scale (grain level) as well as at the macro-scale (sample). On the one hand, experimental results through Franklin point load tests or Protodyakonov tests on individual particles [MAR 72, MIU 79, NAK 99] outline how, statistically, the resistance to failure of an individual particle decreases as the grain size increases. Marsal [MAR 73] states that the average force fg required to break a particle of mean size dg follows:
g g
f = ×k dζ [4.1]
Where k and ζ are experimentally identified. In accordance with [JAE 67], the
crushing stress σg inducing grain breakage is calculated as follows: 2 2 g g g g f k d d ζ σ = = × − [4.2]
Typical values for ζ are close to 1.5 for a large variety of rocks and, at the grain scale, brittle heterogeneous materials. Assuming that crack propagation in a brittle
grain is a volumetric process, the survival probability Ps of a particle of volume V
under a stress σ is assumed to obey a Weibull distribution:
(
)
0 0 0 0 , exp exp d m n m s V d P V V d σ σ σ σ σ = − × = − × [4.3]Where m is the Weibull modulus, nd is the geometric similarity coefficient (usually assumed to be equal to 3 for volumetric similarities) and σ0, V0 and d0 are the characteristic strength, volume and size respectively. Equations [4.2] and [4.3]
can be connected in order to relate the representative failure parameters ζ and m. For a given survival probability, m is then related to ζ by:
2 nd
m
ζ = − [4.4]
With a central value of ζ close to 1.5, a typical value for the Weibull modulus m
is about 6 if nd= 3.
On the other hand, the literature provides many examples in which the friction angle of a soil mass decreases when the maximum grain size is increased. The latter can be seen as the consequence of the former process: particle breakage induces more contractancy due to the rearrangement of the fragments and, consequently, less shear strength resistance of the grain assembly. The challenge has then been to establish the extrapolation rules and their conditions of applicability. Based on an
in-depth review of past experimental results,Frossard et al. [FRO 12] proposed such a
predictive method and applied it to parabolic failure envelopes representative of crushable materials [DEM 77].
4.2.2. Theoretical developments
In the following, consider two homothetic gradations, the coarser P (for prototype) and the finer M (for model). Macroscopic stresses σij applied at the boundaries of a given volume of soil induce a network of local forces f( )n p exerted by particle n on particle p at their common contact point. Following the Love-Weber approach of stress averaging, the macroscopic stress results from the integration of contact forces and branch vectors l( )n p
for all contacts [CHR 81, LOV 27, ROT 81, WEB 66]: ( / ) (/ ) 1 n p n p n p N t f l V σ < ≤ =
⊗ [4.5]Where N is the total number of particles in the volume Vt.
Under the same stress condition, the amount of particle breakage is higher in the coarser material. Inversely, the breakage ratio is similar in both fractions, assuming that Marsal’s equation is suitable for a large range of grain sizes (similar k and ζ values), only if the force magnitude on the prototype is lower than in the finer fraction.
In order to obtain the same probability of particle rupture in both fine and coarse fractions, the crushing forces fM and fP of individual particles must be related as:
P P M M d f f d ζ = × [4.6]
The homologous contact forces in the granular assemblies should be in proportion to the crushing resistances of homologous particles, so that:
( ) ( ) 2 / / d n m P P n p M n p M d f f d − = × [4.7]
As the scaling ratio is the same for all contact forces, this relation, valid locally for each contact force, also holds globally for the complete sets of contact forces. Introducing this scaling law in equation [4.5], also considering the geometrical scaling laws on distances and volumes, it gives:
( ) ( ) M m n M P p n M N p n M n p M m n M P P d d d d l f V d d σ ⋅ = ⊗ = σ − ≤ < −
/ / 1 [4.8] Standard shear tests may allow the identification of the shear strength envelope of the model material, expressed as a parabolic function [DEM 77]:(
',)
Mb M AM n M
τ = ⋅ σ [4.9]
where τ is the peak shear stress, σ’n the normal effective stress and A and b two material constants. Then the application of the previous scaling laws leads to the estimation of the shear strength envelope for the prototype coarse material, such as:
( )
(
)
1 , ' d d M M n m n b m b P P P M M n P M M d d A d d τ τ σ − − − = ⋅ = ⋅ ⋅ [4.10] 4.2.3. Experimental validationThe methodology requires performing crushing tests on individual particles of
distribution to identify AM and bM, and then calibrating the shear strength envelope of the prototype material. Two materials were selected, namely a calcareous limestone (subsequently referred to as CP) exhibiting porosity of about 10% and sub-angular grains, from Préfontaines (100 km south of Paris, France) and a quartzite shale (STV), with angular and flattened particles, from Sainte Honorine La Chardonne (250 km west of Paris, France).
More than 100 crushing tests on individual particles of each material were carried out following Protodyakonov conditions, that is to say splitting between two stiff steel parallel plates, at a constant velocity of 0.1 mm/min. The load- displacement curves show a quasi-brittle behavior, whatever the particle size may be. The crushing strength σg is therefore calculated from the load peak. The experimental data were statistically analyzed by size fractions. More details about the parameters identification can be found in Ovalle et al. [OVA 14]. The identified
values were, respectively, m = 2.18 and nd = 0.63 for CP and m = 1.54 and nd = 0.81
for STV. The geometric similarity coefficient nd is far from the usual assumed value
of 3, and the physical notion in Weibull’s theory is no longer valid for the current heterogeneous and randomly shaped rock particles.
Afterwards, drained triaxial compression tests were performed on dry specimens
of CP and STV with two homothetic grain size distributions of dmax = 40 mm for the
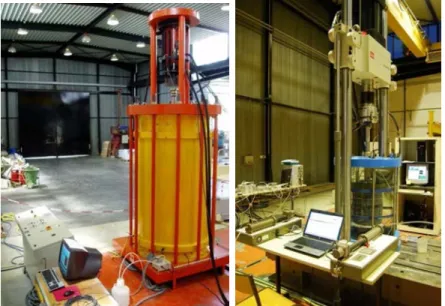
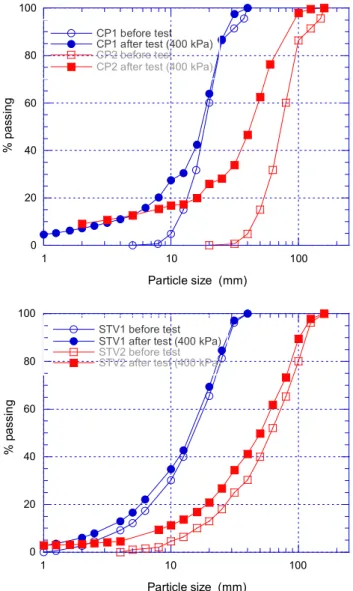
smallest samples CP1 and STV1 of 250 mm in diameter and 375 mm in height (model specimen) and dmax = 160 mm for the largest samples CP2 and STV2 of 1000 mm in diameter and 1500 mm in height (prototype specimen) (Figure 4.1) [HUW 11a]. The initial uniformity coefficients were, respectively, 2 for CP and 5 for STV. Grain size distributions before and after shearing up to an axial strain of 20% are presented in Figure 4.2. For a dry sample preparation, granular soils were
compacted by vibration in several layers. The average initial void ratios were 0.85 ±
0.03 for CP and 0.53 ± 0.04 for STV. Three confining pressures were used: 100 kPa,
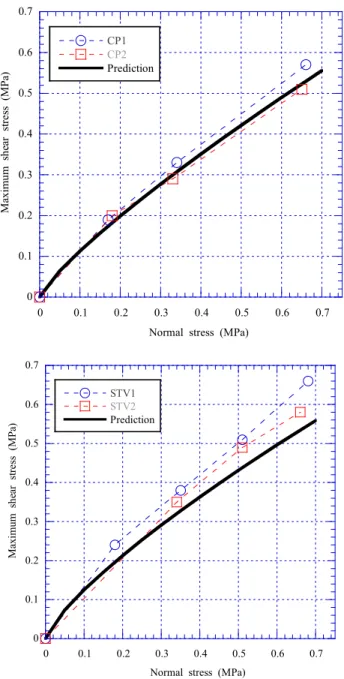
200 kPa and 400 kPa. Friction angles (Figure 4.3) were then calculated from stress- strain curves, not shown here but presented in Ovalle et al. [OVA 14]. Size effects affect both rockfills with (a) a higher Marsal’s breakage ratio [MAR 67] and (b) a slightly lower maximum friction angle for the larger specimens, for example the coarser specimens.
As previously suggested, the shear envelopes were fitted to the De Mello’s parabolic criterion (equation [4.9]), characterized by coefficients A and b. The
fitting for the model grain size distributions give (AM = 0.80; bM = 0.82) for CP1
and (AM = 0.87; bM = 0.77) for STV1. By introducing these parameters in equation
aforementioned values of m and nd with the shear strength envelopes of the coarser (prototype) specimens, characterized by (AP = 0.68; bP = 0.72) for CP2 and (AP = 0.81; bP = 0.78) for STV2. The comparison is shown in Figure 4.4, indicating a reasonable good prediction of size effects for both rockfills, even if it appears to fall on the safe side for STV. This could be explained because the method takes into account neither the magnitude of particle strength, nor the effect of the initial grain size distribution.
Figure 4.1. Large triaxial cells Φ1000 mm (left) and Φ250 mm (right). For a color version of the figure, see www.iste.co.uk/millet/advances.zip
4.3. Challenges in modeling rockfill behavior
The methodology exposed in the previous section can be coupled with the stability analysis of dams for which the friction angle is the key factor, as developed by Frossard et al. [FRO 12]. A second way to describe dam behavior is to model their existence, from the construction stages to the serviceability conditions in the long term. In that case, constitutive models able to simulate the specific features of rockfills are required in numerical computations. One of these features is the dependence of the mechanical properties with the change in the grain size distribution. For about twenty years, many valuable models have appeared in the geotechnical literature.
Figure 4.2. Grain size distributions before and after tests for CP (top) and STV
(bottom). For a color version of the figure, see www.iste.co.uk/millet/advances.zip
0 20 40 60 80 100 1 10 100 CP1 before test CP1 after test (400 kPa)
CP2 before test CP2 after test (400 kPa)
% pas si n g Particle size (mm) 0 20 40 60 80 100 1 10 100 STV1 before test STV1 after test (400 kPa)
STV2 before test STV2 after test (400 kPa)
% pa ss in g Particle size (mm)
Figure 4.3. Evolution of the breakage ratio (top) and maximum friction angle
(bottom). For a color version of the figure, see www.iste.co.uk/millet/advances.zip
0 10 20 30 40 50 0 100 200 300 400 500 CP1 CP2 STV1 STV2 Break ag e rat io (% )
Confining pressure (kPa)
35 40 45 50 55 0 100 200 300 400 500 CP1 CP2 STV1 STV2 Ma ximum fr ict io n an gl e (d eg rees)
Figure 4.4. Shear failure envelopes for CP (top) and STV (bottom). For a color
version of the figure, see www.iste.co.uk/millet/advances.zip
0 0.1 0.2 0.3 0.4 0.5 0.6 0.7 0 0.1 0.2 0.3 0.4 0.5 0.6 0.7 CP1 CP2 Prediction M axi mu m s he ar s tr ess (M Pa)
Normal stress (MPa)
0 0.1 0.2 0.3 0.4 0.5 0.6 0.7 0 0.1 0.2 0.3 0.4 0.5 0.6 0.7 STV1 STV2 Prediction M ax imum s he ar st re ss (M Pa )
The first models dedicated to crushable soils were developed in the framework of plasticity theories (in a non-exhaustive list: [BAU 09, DAO 01, DAO 10, LIL 16, MUI 08]). Critical state-based elastoplastic models will be more extensively discussed later. Among the plasticity models, it is worth noting the capabilities offered by the hypoplastic model by Bauer and co-workers (see for instance, [LIL 16]) whose central concept is the solid hardness, a measurement of the degree of weathering of rock particles. By relating the solid hardness to density, the degree of humidity and time, Bauer’s model is also able to capture time-dependent mechanisms occurring in weathered and moisture-sensitive coarse-grained materials (creep or relaxation due to progressive grain crushing).
A second family of models has gained in popularity. It follows a thermodynamics approach (also called hyperplasticity by some authors) to derive constitutive equations from energy considerations (free energy and dissipation functions). One can cite the pioneering Continuum Breakage Mechanics by Einav
and co-workers [EIN 07a, EIN 07b], and new developments by Wang andArson
[WAN 16] or Salami [SAL 16]. These models also introduced the partitioning
between the consumed energy due to the creation of new surfaces related to the propagation of a crack in a grain and the consumed energy by friction due to the local re-organization of the granular skeleton when breakage occurs.
Also note that many recent contributions to the behavior of crushable soils use the discrete element method (DEM). However, because of huge computational time demands, this method is not operative for geotechnical projects such as dams. Moreover, the description of the breakage of a grain is usually biased in the sense that the size and shape of fragments are pre-determined [OVA 16]. However, DEM can provide valuable information to validate some assumptions on the behavior of granular materials.
In particular, it has been postulated that grain crushing inducing a change in the grain size distribution also affects the critical state. This key point has surprisingly not been investigated so much in terms of modeling.
4.3.1. Experimental investigation on critical state characteristics
Biarez and Hicher [BIA 97], Daouadji et al. [DAO 01] andHu et al. [HUW 11b]
suggested that, as the amount of grain breakage increases, the critical state line (CSL) shifts downwards in the e – p’ plane, where e is the void ratio and p’ the mean effective stress. Based on 2D DEM simulations, Muir-Wood and Maeda [MUI 08] confirmed that the critical state line of a well-graded material lies below that of a poorly graded material. Yan and Dong [YAN 11], through 3D DEM simulations, suggested a linear relationship between the critical state parameters and the coefficient
of uniformity Cu. However, their study focused on small values of Cu limited to 2.2. Liu et al. [LIU 14] and Li et al. [LI 15] extended the study to larger Cu (up to 20) and mainly investigated the effect of the soil uniformity on the CSL position from an experimental point of view.
However, the standard definition of the critical state (constant stress ratio, null volumetric strain rate) must be completed by an additional condition: no evolution of the grain size distribution. That condition is achieved at very large strains (more than 100%), as shown during ring shear tests [COO 04]. So the identification of the critical state parameters for crushable soils, at relatively small strain levels (usually 20%), constitutes a great, even impossible, challenge. Liu et al. [LIU 14] and Li
et al. [LI 15] chose to depict qualitatively the evolution of the CSL parameters
through tests on uncrushable sands of different coefficients of uniformity, also supported by 3D DEM computations, and to extrapolate the findings to crushable soils.
Figure 4.5. Grain size distributions for glass
beads and Hostun sand specimens
All specimens were prepared with the moist tamping method [ISH 93] to obtain very loose specimens, so as to avoid early strain localization as much as possible.
0
20
40
60
80
100
0.01
0.1
1
10
Passing
(%)
Grain size (mm)
Cu=1.1 Cu=1.4 Cu=2.5 Cu=5.0 Cu=10 Cu=20Glass beads
Hostun sand
Specimens (100 mm in diameter and about 200 mm in height) of angular Hostun sand mixtures and spherical glass bead mixtures were subjected to isotropically consolidated drained triaxial compression tests, with confining pressures of 100, 200 and 400 kPa, so that no particle breakage can occur. The grain size distributions, similar for glass beads and Hostun sand specimens, are shown in Figure 4.5. First, the tested specimens exhibit a unique critical stress ratio M = q/p’ upon compression regardless of Cu (M=0.81 for glass beads and M = 1.13 for Hostun sand). The uniqueness of the critical stress ratio confirms that the shear resistance is not influenced by the change in GSD.
The critical state lines in the e – p’ plot are represented in Figure 4.6. It is confirmed by experiments that the location of the CSL varies as Cu changes, the
higher the Cu value, the lower the CSL location in the e – p’ plot. In the range of
confining stresses tested, it seems that all the critical state lines are almost parallel. In other words, a well-graded material has a smaller void ratio at critical state than does a more uniform material under the same stress level. Then, it is assumed that the void ratio at critical state ec is related to the mean effective stress, as follows:
' p c ref at p e e p ξ λ = − [4.11]
where eref is a reference void ratio that allocates the position of the CSL, λ controls the slope of the CSL, ξp is a material constant fixed here at 0.9, as proposed
by Yan and Dong [YAN 11] and pat the normalizing atmospheric pressure
(101.3 kPa).
The evolution of the two parameters eref and λ of equation [4.11] is plotted in Figure 4.7 and the following fitting curves are calibrated:
( , )
, ,
e ref u
c C ref e ref e ref
e =a +b ⋅e− ⋅ [4.12]
( c Cu)
a b e λ
λ λ
λ= + ⋅ − ⋅ [4.13]
where ae,ref,, be,ref,, ce,ref,, aλ,, bλ and cλ are fitting parameters. Table 4.1 provides the
constant values of these parameters for glass beads and Hostun sand specimens, respectively.
Figure 4.6. Evolution of the CSL with the coefficient of uniformity Cu 0.3 0.4 0.5 0.6 0.7 0.8 0 100 200 300 400 500 600 700 800 Cu=1.1 Cu=1.4 Cu=2.5 Cu=5 Cu=10 Cu=20 V oid r at io e c
Mean effective stress p' (kPa)
(a) GLASS BEADS 0.55 0.6 0.65 0.7 0.75 0.8 0.85 0 100 200 300 400 500 600 700 800 Cu=1.1 Cu=1.4 Cu=2.5 Cu=5 Cu=10 Cu=20 V oi d r ati o e c
Mean effective stress p' (kPa)
(b)
HOSTUN SAND
Figure 4.7. Parameters of the critical state lines
ae,ref be,ref ce,ref aλ bλ cλ
Glass beads 0.338 0.42 0.201 4.82E-4 2.04E-3 0.265 Hostun sand 0.590 0.181 0.123 4.62E-3 5.79E-3 0.139
Table 4.1. Fitted parameters
4.3.2. Elasto-plastic models with an implicit description of GSD
evolution
A constitutive model for rockfills must describe the main features of the behavior of granular materials, namely nonlinear elasticity, shear strength due to intergranular friction, strain hardening and dilatancy, as well as peculiar features of rockfills (size effects, cap yield, evolution of the critical state line due to the change in the grain size distribution). Most of the models presented in the literature are structured in a similar way and differ only in the assumed equations for the yield surfaces, flow rule and evolution of the critical state. In this section, we present one of these models, in which grain breakage affects both the elastic stiffness and shear strength of the granular material.
The nonlinear elasticity involves both the bulk modulus K and shear modulus G, dependent on the mean effective stress p’, void ratio e, as well as grain breakage through the breakage index Br by Yin et al. [YIN 16] according to experimental
observations byIwasaki and Tatsuoka [IWA 77]:
(
)
2(
)
0 2.97 ' exp 1 p n at r at e p K K p B e p θ − = ⋅ ⋅ − + [4.14] 0.2 0.4 0.6 0.8 1 1 6 11 16 21 eref Cu fitting-curve fitting-curve Hostun sand Glass beads (a) 0 0.003 0.006 0.009 0.012 0.015 1 6 11 16 21 λ Cu fitting-curve fitting-curve Hostun sand Glass beads (b)(
)
2(
)
0 2.97 ' exp 1 p n at r at e p G G p B e p θ − = ⋅ ⋅ − + [4.15]Where K0, G0 and np are material constants. The parameter θ controls the degradation rate and also the final degradation amplitude of the stiffness when
Br = 1. It also leads to the degradation of the plastic stiffness, in agreement with experimental observations.
The model is also composed of two yield surfaces: the first – associated for simplicity – yield surface fcomp deals with the compression behavior. For η ≤ Mp:
(
)
3 1 ' ' exp 2 comp m r p f p p p b B M η = + − ⋅ − ⋅ [4.16a] 0 0 1 exp p m m v p e e p p ε λ κ + = ⋅ − [4.16b](
1 0)
' e e p K κ = + ⋅ [4.16c]where pm is the hardening variable controlling the size of the yield surface (initially at pm0), depending on the volumetric plastic strain εpv and Mp is the mobilized peak
strength (stress ratio η = q/p’ at peak, related to the Mohr-Coulomb peak friction
angle ϕp). λp and κe are the plastic and elastic compressibility factors respectively. A
degradation effect is introduced through the breakage amount Br [YIN 16].
The second yield function deals with the shear sliding behavior:
(
') (
)
0 p p d shear p p pR d M f M p G G ε η ε ⋅ = − = + [4.17]The hardening rule depends on the deviatoric plastic strain εp
d and the hardening rate variable GpR. The plastic potential function needed to compute the plastic strains, causing the model to be non-associated, is defined by:
pt q g Ln M η η = + [4.18]
With Mpt as the phase transformation stress ratio. An alternative to these two yield surfaces may consist of adopting an egg-shaped yield surface, as done by Alonso et al. [ALO 16], which presents the advantage of possibly more easily integrating anisotropic features.
It is well-known that the volumetric behavior of a granular mass upon shearing depends on the stress state and the relative distance between the void ratio e and the critical void ratio ec. In the present model, the assumption is:
tan c tan p e e β μ φ = φ [4.19] 6 sin 3 sin M φ φ ⋅ = − [4.20] tan c tan pt e e β μ φ φ − = [4.21]
Where ϕμ is the friction angle at critical state and β a material constant. The critical void ratio ec depends on the amount of grain breakage through equation [4.11]. A variant version can be found in Yin [YIN 16].
As a last ingredient of the model, the evolution of the GSD or the amount of grain crushing that depends on stresses and strains must be related to the mechanical loading. This relationship is usually implicit, since the precise measurement of the
GSD is optional. Daouadjiet al.[DAO 01] and Hu et al. [HUW 11b] for instance
have considered the amount of grain breakage as a function of the plastic work Wp*,
such as:
(
)
* ' p p p v d W =
p dε + ⋅q dε [4.22] * * p r p W B a W = + [4.23]where a is a fitting parameter. The MacCauley brackets in equation [4.22] imply that the shear dilation (dεdp<0) is not accounted for in the expression of the plastic work. An equivalent function has been proposed by Muir-Wood and Maeda
predicted, an additional relation between the breakage ratio Br and the GSD must be established, as has been done for instance by Einav [EIN 07a, EIN 07b] in assuming the existence of an ultimate fractal GSD, enabling the calculation of the equation F(d) of the GSD as:
( )
(
1 r Einav,)
0( )
r Einav, ult( )
F d = −B ⋅F d +B ⋅F d [4.24]
Where F0(d) is the initial GSD, Fult(d) the ultimate one defined as Fult(d) = (d/dmax)0.3 and Br,Einav the breakage ratio defined by Einav [EIN 07a]. Some comparisons between experimental and numerical stress-strain curves and GSDs are detailed in Yin [YIN 16].
4.3.3. Explicit description of GSD evolution
The implicit description of the GSD suffers from some shortcomings. It requires the choice of a specific form F(d) for the GSD. It also assumes an ultimate GSD which is experimentally difficult to identify since it can be obtained only at very large strains. Moreover, it doesn’t contain any information about the hardness of the grains themselves. A strategy, called confined comminution (CC), has therefore been developed to circumvent the aforementioned assumptions [OVA 13a]. Based on stronger physical considerations, it inherently integrates size effects and relates micromechanics at the grain level to macro properties of the grain assemblies. The CC model found inspiration from grinding theories commonly encountered in mining engineering problems for which the optimization of particle fragmentation processes represents a key concern.
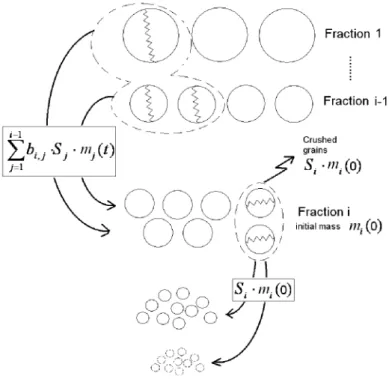
The basic principle of this CC model is a population balance, where the rate of mass accumulation in the ith size fraction is equal to the rate of the ith size production
from all coarser size fractions j, reduced by the rate of breakage in the ith fraction
[REI 65] (Figure 4.8). The change in each size fraction can be described by the following discrete population balance:
i ij i i dm A m dξ = i n i i n f f ξ = [4.25]
where fni is the intergranular normal contact force, <fni> the mean value for the ith size fraction and the matrix Aij is defined as:
0 ij j ij i b S i j A S if i j i j < = − = > [4.26]
Si is the breakage probability of grains in the ith size fraction and bij the fragmentation function that describes the mass contribution to the ith fraction of fragments generated by the crushing of a coarser particle in the jth size fraction.
Figure 4.8. Principle of confined comminution
The fragmentation function bij should be related to the mineralogical and petrographic properties of the particles, but also to any factor influencing the state of tensile or shear stress inside a particle (degree of weathering, grain angularity, coordination number or orientation of contact forces). Unfortunately, no simple mathematical expression can capture the complexity of the fragmentation process.
A self-similar distribution for the retained mass between two successive size fractions (i and i+1) is therefore assumed:
3 3 1 b b D D i i ij j j d d b d d − − − = − [4.27]
and is characterized by the fractal dimension Db.
From a physical point of view, particle crushing develops because the intergranular contact forces induce a tensile (mode I) or a shear stress (mode II) that
exceeds particle strength. Therefore, the probability of breakage Si must combine, on
the one hand, statistics on particle strength (function of their size in particular) and, on the other hand, the distribution of contact forces in better and better graded
granular packings, as proposed by Marketos and Bolton [MAR 07]. In terms of
probability, these two events are assumed to be independent.
The particle strength statistics have already been introduced in Section 4.2.1. Considering that the particles behave according to the linear elastic brittle mechanics theory, assuming that the breakage is mainly due to tensile stresses within particles induced by normal intergranular contact forces (fracture in mode I prevailing on mode II, which justifies the use of Brazilian-type tests to characterize the load at failure), then the survival probability of a grain of size d subjected to a tensile stress σ follows a Weibull distribution (equation [4.3]) where nd = 3.
Due to the lack of experimental evidence on the contact force distributions, the use of DEM computations becomes almost indispensable. Then, to obtain a genuine description of the force network, 3D DEM simulations of isotropic compression of dense polydisperse frictionless uncrushable sphere packings were performed with
the Contact Dynamics Method [MOR 04].Silbert et al. [SIL 02] showed that the
friction coefficient has a small influence on the statistical distribution of contact forces. Furthermore, to avoid boundary effects, periodic boundary conditions without gravity were used [VOI 09]. The size of the smallest particle is constant (dmin = 1 mm) and the maximum grain size dmax increases with the size span R =
dmax/dmin, which varies from 1.5 for almost monodisperse samples to 50 for highly
polydisperse samples. The grain size distribution of numerical specimens is specified assuming a power law distribution:
( )
1 1min 1 1 max min DEM d d F d d d δ δ δ δ − − − − − = − [4.28]Where δ is in the range 2–3. Details on the numerical protocol, in particular the method to obtain a dense initial state, can be found in Radjai and Voivret [RAD 11], Voivret [VOI 13] and Ovalle et al. [OVA 16].
In order to take into account the size effects arising from particle strength and cushioning effects (to be discussed subsequently), the distribution of normal forces is analyzed for each size fraction i. A size fraction of characteristic size di is thus
characterized by a span factor Ri = di/dmax in a given sample of span R. Numerical
results show that the force distribution becomes narrower as Ri increases [OVA 16].
This can be explained by the fact that the cushioning effect on coarse grains becomes more and more important when polydispersity increases. In other words, during confined comminution, small particles are more likely to break than would the larger ones due to the so-called ‘cushioning” effect [TSO 99], since large particles tend to have a higher coordination number and to be submitted to a nearly isotropic compressive stress preventative of crushing due to tensile stresses. This cushioning effect can also be highlighted through the anisotropy of the normal force directions: numerical simulations indeed reveal that the anisotropy for coarse grains decreases with Ri, whereas it is relatively high for small particles. This finding allows the contact force network to be described regardless of i and R and the use of
the probability density function pN(ξ) as proposed byRadjaï et al. [RAD 96]:
( )
expr(
(
1)
)
11 N r r k p if k α ξ ξ ξ ξ β ξ − ⋅ < = > ⋅ − [4.29]where α and βr are empirical parameters, ξ = fn/<fn> and kr a normalizing constant (1/kr = 1/(1-α) + 1/βr). The continuity of the function imposes that βr² = (1-α)(2-α). Moreover, computations give that, for ξi> 1:
( )
0.365 1.1149r Ri
β = ⋅ [4.30]
The anisotropy of normal forces is injected into the comminution model by using the maximal mean normal force in the ith size fraction defined for the principal direction at the particle scale, such as:
(
)
max 1 2
i i i
n n n
f = f ⋅ + ⋅a [4.31]
where the anisotropy of the normal contact forces in the ith size fraction is given by:
(
1 3)
5 / 2 i i i i n n a = χ χ− f [4.32]where χ1 and χ3 refer to the eigenvalues of the fabric tensor, following the definition
byBathurst and Rothenburg [BAT 88].
Finally, the cumulated probability for a contact force to be higher than the statistical value at breakage fbi is:
(
)
( )
, , i b N i i b N i i P p d ξ ξ ξ> =+∞
ξ ⋅ ξ [4.33] with , max i i i b fb fnξ = . Accordingly, the higher the normal force anisotropy is, the
higher the maximal mean normal force will be; therefore, a higher breakage probability will be computed with equation [4.33].
We finally assume that the force network during comminution (as well as the grading) evolves in the same way as it does in different uncrushable samples when polydispersity increases. Therefore, the breakage probability Si for the ith size fraction results from the combination of the two independent events: breakage probability of a particle, described by the Weibull distribution, and the probability to
have a normalized normal contact force higher than the failure force fbi
corresponding to the threshold stress σI,b:
(
,)
(
,)
1 ,
i S i i b N i i b i
S = − P d σ ⋅P ξ ξ>
[4.34]
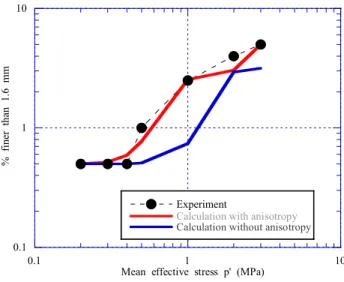
This predictive model for the evolution of the GSD has been confronted with well-documented experimental data: oedometer tests by Nakata et al. [NAK 01b] and isotropic compression tests by Ezaoui et al. [EZA 10]. The latter will be detailed here. The crushable granular materials are made of spherical grains fabricated by mineral powder agglomeration, with a diameter from 1.6 to 4.0 mm. Ezaoui et al. [EZA 10] carried out 124 crushing tests on individual particles and isotropic quasi-static compression tests on granular assemblies, with an isotropic effective stress p’ varying between 0.2 and 3.0 MPa. They compared the fine content (% finer than 1.6 mm) before and after tests. The initial GSD and the evolution of fine contents are presented in Figure 4.9. Analysis of crushing tests
on grains gives the following parameters for the Weibull distribution: d0 = 3mm,
m = 6.5 and σ0 = 0.91 MPa (nd is fixed at a value of 3). The parameter Db of the
fragmentation function is assumed to be equal to 2. Combining equations [4.26], [4.27] and [4.34], and adopting the results of DEM computations for the distribution of normal forces [OVA 16], the fine content can be predicted. Figure 4.10 shows the comparison between experimental data by Ezaoui et al. [EZA 10] and the comminution model predictions. A good agreement is obtained.
sensitivity analysis on the effect of Db should be made. However, the physical
values for Db seem to fall within a narrow range of values, between 2.0 and 2.6.
Figure 4.9. Initial GSD and fine content after testing [EZA 10]. For a color
version of the figure, see www.iste.co.uk/millet/advances.zip
Figure 4.10. Comparison of the fine contents between experiments and predictions.
For a color version of the figure, see www.iste.co.uk/millet/advances.zip
0.1 1 10 100 0.5 0.6 0.7 0.8 0.9 1 2 3 4 5 Initial GSD p' = 0,5 MPa p' = 1 MPa p' = 2 MPa p' = 3 MPa % pas si ng b y ma ss Particle size (mm) 0.1 1 10 0.1 1 10 Experiment
Calculation with anisotropy
Calculation without anisotropy
% f in er th an 1 .6 m m
The implementation of this explicit model for the GSD evolution into a mechanical model has not yet been realized. As the comminution model involves a scalar stress in the Weibull distribution, some further analysis is needed to choose which stress definition from the mechanical stress tensor is the most appropriate. In the previous example, the mean effective stress was considered, but the level of deviatoric stress should be more significant for most engineering applications. The comminution model presents certain advantages: a physical basis of the characteristic equations, no assumption on an ultimate or fractal grain size distribution, and flexibility, since new ingredients such as the effect of water could be introduced.
4.4. Detrimental effect of humid conditions on grain breakage
Much evidence of the influence of humid conditions on the behavior of crushable soils can be found in the field or in the literature. Research by Alonso et
al. [ALO 05, ALO 16], Oldecop and Alonso [OLD 03], Oldecop and Alonso
[OLD 13] and Ovalle et al. [OVA 15] on rockfills tested in different relative humidity conditions illustrate this detrimental effect of the interactions between the granular skeleton and the pore fluid. Detrimental means here that humidity favors grain breakage, as it will be shown later, and can induce unexpected settlements during the serviceability life of rockfill dams or embankments. Let’s cite for instance:
– The case of Cogswell 85m high dam in California (1934, USA): the rockfill mass, of good quality, was dumped and compacted without any prior sluicing, which resulted in a greater susceptibility to water flooding. Indeed, after a severe rainy episode, an immediate settlement of 1.8 m at the dam crest observable in just one night reached 4.1 m 6 months later.
– Case histories of Aguamilpa dam (187m, Mexico, 1995), Campos Novos dam (202m, Brazil, 2006) or Mohale dam (145m, Lesotho, 2006): all exhibited concrete face damage due to excessive rockfill deformation during reservoir filling (due not only to the change in total stress) or after rains, in spite of sluicing during construction.
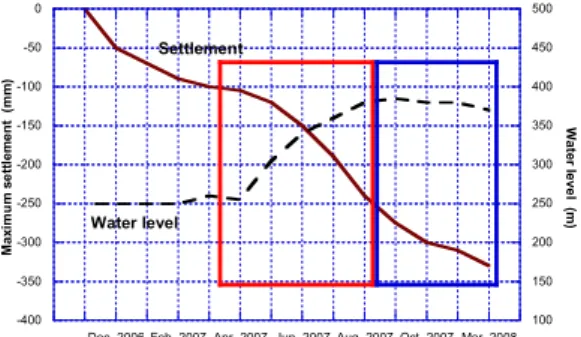
– The long-term monitoring of Shuibuya dam (233m, China, 2008) [ZHO 11] allows the reporting of the observed settlements and water levels during the construction and first filling stages, as well as during serviceability conditions (Figure 4.11). In Figure 4.11, the red frame indicates the first filling of the reservoir, accompanied by a faster rate of settlement, whereas the blue frame marks the operational conditions with an almost constant water level in the reservoir. At that stage, time-delayed deformations are still measurable, at a lower rate.
deformations. From a modeling point of view, few models are able to take the water/skeleton interactions into account, except the hypoplastic model by Li et al. [LI 16] through the evolution of the solid hardness. Some attempts in the elasto-plastic framework [ANT 99, SAL 16] should however be mentioned.
Experimental tests in the laboratory, on smaller size fractions of a granular soil, have attempted to replicate those field observations. 1D compression tests by Nobari and Duncan [NOB 72] in dry or saturated conditions or 1D compression in controlled relative humidity conditions [OLD 01] and triaxial tests [ALO 16, LAD 10] gave a consistent framework of the behavior of crushable soils in humid environments. Figure 4.12 shows typical experimental results of compression on crushable soils, similar to previous findings by Nobari and Duncan [NOB 72]. The upper blue curves, represented in an axial (vertical) strain vs. axial (vertical) stress plot, correspond to the material compression in dry conditions. The lower red curves are the compression curve of the same material that was initially imbibed by water, which reveals a larger compressibility. If an initially dry material is flooded (arrow in Figure 4.12) under a constant vertical stress, as illustrated by black lines in Figure 4.12, the specimen showed a significant settlement until its stress-strain behavior almost reached the compressibility curve of initially wet samples. Oldecop and Alonso [OLD 07] added the fact that there are intermediate compressibility curves related to intermediate relative humidity or suction levels.
Are these mechanisms related to grain crushing? Similar compression tests on uncrushable soils (glass beads, 1 to 2 mm in diameter to avoid capillary effects, in a certain range of stress, typically below 2 MPa) do not show any collapse of the granular structure when water is added. The most convincing evidence comes from comparing the grain size distributions of the tested materials, before loading and after complete unloading.
Figure 4.11. Core and crest settlements of Shuibuya dam (redrawn from data
by Zhou et al. [ZHO 11]). For a color version of the figure, see www.iste.co.uk/millet/advances.zip -400 -350 -300 -250 -200 -150 -100 -50 0 100 150 200 250 300 350 400 450 500
Dec, 2006 Feb, 2007 Apr, 2007 Jun, 2007 Aug, 2007 Oct, 2007 Mar, 2008
M axi m u m se tt le me n t ( m m ) Wat er leve l (m ) Time (month) Water level Settlement
The uniaxial compression tests shown in Figure 4.12 have been performed on cylindrical specimens (19 mm high and 70 mm in diameter) with a uniform distribution of angular grains of STV quartzite shale already presented in this chapter. Particle size ranges from 2.0 to 2.5 mm. In order to avoid any breakage during specimen preparation, loose samples of the dry material were prepared at an initial void ratio e0 of 1.019 ± 0.046. 23 stress controlled compression tests were carried out at similar stress levels (0.15 MPa, 0.4 MPa, 0.8 MPa, 1.3 MPa and 2.1 MPa), each of them maintained for 24 hours. As shown in Table 4.2, three test conditions were implemented: (1) dry, (2) saturated after the preparation and (3) initially dry then flooded with demineralized water at a certain vertical stress. Note that the saturation degree was not measured but the added volume of water was enough to fill the voids. The flooding process took about one minute. No chemical reactions of dissolution occurred between water and grains (constant dry mass of grains before and after test). After unloading, samples were slowly dried in order to avoid any additional breakage due to heating, then sieved.
Figure 4.12. Compressibility curves for quartzite shale specimens. For a color
version of the figure, see www.iste.co.uk/millet/advances.zip
0.6 0.7 0.8 0.9 1 1.1 0 500 1000 1500 2000 2500 Dry Test 7 Dry Test 8 Sat. Test 15 Sat. Test 16 Test 17 Test 18 Test 19 Test 20 Test 22 Void r at io
Vertical effective stress (kPa) Flooding
Test Condition e0 Max σ’v Wptot Δ(SSA) [-] [MPa] [MPa] [10-3*m²/g] 1 dry 0.998 0.15 0.003 0.52 2 dry 1.010 0.4 0.013 1.03 3 dry 1.034 0.8 0.035 1.51 4 dry 1.065 0.8 0.041 1.80 5 dry 1.014 1.3 0.074 2.04 6 dry 1.011 1.3 0.076 2.06 7 dry 1.037 2.1 0.140 2.47 8 dry 1.010 2.1 0.127 2.90 9 saturated 0.994 0.15 0.004 0.82 10 saturated 1.005 0.4 0.016 1.93 11 saturated 1.010 0.4 0.017 2.40 12 saturated 1.026 0.8 0.045 3.25 13 saturated 1.016 1.3 0.099 4.35 14 saturated 1.020 1.3 0.103 3.97 15 saturated 0.994 2.1 0.188 6.02 16 saturated 0.995 2.1 0.186 5.65 17 flooded 1.010 0.15 0.005 – 18 flooded 1.007 0.4 0.020 2.40 19 flooded 1.036 0.8 0.062 3.25 20 flooded 1.006 1.3 0.116 4.67 21 flooded 1.045 2.1 0.283 6.53 22 flooded 1.062 2.1 0.253 6.05 23 flooded 1.029 2.1 0.245 5.78
0.1 1 10 100 0.1 1 10 Initial GSD Test 1 Test 2 Test 3 Test 4 Test 5 Test 6 Test 7 Test 8 % f in er b y m ass Particle size (mm) 0.1 1 10 100 0.1 1 10 Initial GSD Test 9 Test 10 Test 11 Test 12 Test 13 Test 14 Test 15 Test 16 % fi ne r b y m ass Particle size (mm) 0.1 1 10 100 0.1 1 10 Initial GSD Test 18 Test 19 Test 20 Test 21 Test 22 Test 23 % fi ne r b y m ass Particle size (mm)
Grain size distributions are shown in Figure 4.13. Grain breakage obviously occurred, due to the mechanical loading and due to the interactions between water and grains. An outstanding result is that initially saturated and flooded samples present similar final GSD, which can be correlated to the increase in specimen compressibility. To better highlight the differences in the final gradings, the increase of the surface area of grains due to crushing was estimated through Blaine tests according to the standard ASTM C204-11 [AST 11]. This test is suitable for particles smaller than 0.125 mm, but it is worth noting that the major contribution to
the change in surface area Δ(SSA) comes from fine particles [MIU 79]. Δ(SSA) is
plotted against the plastic work Wp, where the plastic work is the sum of all the
increments ΔWp = Δσ’
v*(ε-εe) in which εe is the elastic strain recovered after unloading. As shown in Figure 4.14, saturated and flooded samples follow a unique curve, separately from dry samples which have experienced less crushing. Consequently, the fact that saturated and flooded samples present a unique compression curve can be explained by the same final GSD.
Figure 4.14. Increase in surface area vs. plastic work. For a color
version of the figure, see www.iste.co.uk/millet/advances.zip
From a physical point of view, the reason why water enhances grain breakage is
still not well established. However, Atkinson [ATK 79, ATK 82], Oldecop and
Alonso [OLD 07] integrate the concept of stress corrosion (water is seen as a corrosive fluid in contact with solid grains) to explain how the energy barrier
0 10 20 30 40 50 60 70 0.001 0.01 0.1 1 Dry Initially saturated Flooded Δ SS A * 10 4 ( m 2 /g )
required to propagate a crack is weakened in humid conditions (subcritical crack
growth lower than the critical threshold in dry environment). Hu [HU 07a,
HU 07b] gave an appropriate modeling approach to this mechanism, coupling mechanics and chemical interactions (local dissolution of the solid that induces crack propagation) between the corrosive fluid and the solid material at the crack tip. The previous experimental data have been analyzed more thoroughly to identify a micro-characteristic of the grains. Let’s assume that the increment of plastic work δWp is the sum of the dissipations by friction δΦ
friction and by breakage δΦB. The
latter dissipation can be distributed into the energy required to create new surfaces, by an increment δS, by grain breakage in a given volume as well as into kinetic energy of the fragments and surrounding grains due to breakage.McDowell et al. [MCD 96] proposed:
(
1) (
1)
c B s S R V e δ δΦ = Γ ⋅ ⋅ + ⋅ + [4.35]Where Vs is the volume of solids, e is the void ratio and Γc the specific surface energy from Griffith’s theory [GRI 21]. The variable R represents the fraction of energy consumed in kinetic energy and contact redistribution triggered by crushing [NGU 09, NIE 11, RUS 11]. Russell [RUS 11] predicted values of R around 13 to 15. Note that plastic dissipation due to inelastic deformation around the crack or dissipation by heat production, even if, in some cases, significant [SAL 16], are therefore neglected.
By measuring the difference between the grain size distributions after a dry test and after a flooded one at the same maximal vertical effective stress, the surface area
increment simultaneous to the collapse δS can be computed. Using equation [4.35],
the quantity Γc.(1+R) can be identified, as shown in Figure 4.15. When the plastic
work increment tends to 0 (at low stress), the R value is assumed to become negligible: at low stresses, inter-particle contact forces on a broken grain can be redirected to nearby grains with small amount of redistribution. Therefore, the surface fracture energy Γc can be determined. It is close to a value of about 2.5 N/m, in the same order of magnitude of surface fracture energies found in the literature for the similar rock properties [ASH 86]. On the other hand, at high stress levels, surrounding grains are not able to sustain the redistributed forces and an overall rearrangement of the granular skeleton should take place with significant collapse, which induces high values of R, of about 10, in accordance with Russell’s estimation [OVA 13b, RUS 11].
Figure 4.15. Identification of ΓC.(1+R) after collapse due to flooding
During compression experiments, it was also observed that settlements do not completely stabilize, presenting then a sort of creep as observed in real dams. It has been decided to conduct preliminary long-term (more than 2 years) compression tests, one in dry conditions (e0 = 0.895), one in saturated conditions (e0 = 0.924 before saturation), at the same vertical stress (1.145 MPa). The soil was made of a calcareous crushable uniform sand (particle size between 2 and 2.5 mm) placed in a cylindrical mold 70 mm in diameter and about 20 mm high. Figure 4.16 represents the time-delayed settlement after the initial consolidation stage from a vertical stress of some kPa to 1.145 MPa. Although less important in the dry case, creep does occur in both cases. Mechanisms at the origin of this time-dependent behavior have not been clearly identified until now, but recent experiments on grain-to-grain creep
tests byMichalowski and Nadukuru [MIC 15] suggest plasticization and creep of
stressed surface asperities.
Figure 4.16. Long-term settlement of a crushable calcareous soil. For a
color version of the figure, see www.iste.co.uk/millet/advances.zip
0 5 10 15 20 25 0.001 0.01 0.1 1 Γc *( 1+ R ) ( N/m )
Increment of plastic work during collapse (MPa)
0 200 400 600 800 1000 1200 0.65 0.7 0.75 0.8 0.85 0.9 0.95 10 100 1000 104 105 106 E ffe cti ve ve rt ic al s tr es s σv ( kP a) V oid r ati o e Time (min) σv e
Red lines : DRY Blue lines : WET
4.5. Conclusion
Crushable soils behave as granular soils usually do; that is to say, friction is the main dissipative process when subjected to compression or shearing. However, they also dissipate energy in other forms, in particular through the energy consumed to create new surfaces when fragments are generated. Grain breakage also results in more compressibility, a shift of the critical state line in the void ratio-mean effective stress plane with a relatively constant maximum friction angle provided that particle shape remains relatively unchanged (angular) and consequently in a decrease of the shear strength. For engineering purposes, the decrease of the material strength is of importance in assessing the stability of hydraulic structures (dams, embankments).
The behavior of crushable soils also highlights the role of micro-mechanics in the macroscopic behavior. Hence, size effects observed at the macro-scale on relatively initially uniform granular material, which are materialized by a decrease of both stiffness and shear strength for coarse samples compared to specimens with a finer homothetic grain size distribution and similar density, find their origin in the probability of failure more important for large grains than small ones. Nevertheless, once crushing is fully activated, for example when grain size distribution becomes better and better graded, the DEM simulations show that the cushioning effect protects the larger grains from breakage and a combination of the probability of grain breakage and the distribution of contact forces must then be considered to account for this effect.
Humid environmental conditions (relative humidity) also affect the behavior of crushable soils: they emphasize the mechanisms observed in dry conditions, since water favors the propagation of cracks. Integration of the chemo-mechanical interactions at the crack tip, following a scale transition approach, represents a challenge for modeling but, in the long run, it could help time-delayed deformation of granular materials to be better predicted.
4.6. Acknowledgements
The authors would like to thank the valuable contributions of students (M. Cisternas, G. Colombo, P. Duan, W. Hu, X. Jing, G. Li, Y. Salami, E. Tinubi) involved in the research projects related to grain crushing. Most experimental developments and tests were carried out during the ECHO project, managed by E. Frossard from Tractebel Engineering (formerly Coyne-et-Bellier) and granted by the French National Research Agency: we would like to acknowledge their confidence and financial support.
4.7. Bibliography
[ALO 05] ALONSO E.E., OLIVELLA S., PINYOL N.M., “A review of Beliche dam”,
Geotechnique, vol. 55, no. 4, pp. 267–285, 2005.
[ALO 16] ALONSO E.E., ROMERO E.E., ORTEGA E., “Yielding of rockfill in relative humidity-controlled triaxial experiments”, Acta Geotechnica, vol. 11, no. 3, pp. 455–477, 2016. [ANT 99] ANTHINIAC P., Modélisation hydroplastique des enrochements de barrage en
éléments finis, PhD Thesis, Aix-Marseille II, 1999.
[ASH 86] ASHBY M.F., JONES D.R.H., Engineering Materials, Pergamon Press, Oxford, 1986.
[AST 11] ASTM C204 – 11, Standard Test Methods for Fineness of Hydraulic Cement by Air-Permeability Apparatus, 2011.
[ATK 79] ATKINSON B., “A fracture mechanics study of subcritical tensile cracking of quartz in wet environments”, Pure and Applied Geophysics, vol. 117, no. 5, pp. 1011–1024, 1979. [ATK 82] ATKINSON B., “Subcritical crack propagation in rocks: theory, experimental results
and applications”, Journal of Structural Geology, vol. 4, no. 1, pp. 41–56, 1982.
[BAT 88] BATHURST R.J., ROTHENBURG L., “Micromechanical aspects of isotropic granular assemblies with linear contact interactions”, Journal of Applied Mechanics, vol. 55, no. 1, pp. 17–23, 1988.
[BAU 09] BAUER E., “Hypoplastic modelling of moisture-sensitive weathered rockfill materials”, Acta Geotechnica, vol. 4, no. 4, pp. 261–272, 2009.
[BIA 97] BIAREZ J., HICHER P.Y., “Influence de la granulométrie et de son évolution par ruptures de grains sur le comportement mécanique de matériaux granulaires”, Revue
Française de Génie Civil, vol. 1, no. 4, pp. 607–631, 1997.
[CHA 80] CHARLES J.A., WATTS K.S., “The influence of confining pressure on the shear strength of compacted rockfill”, Geotechnique, vol. 30, no. 4, pp. 353–367, 1980. [CHR 81] CHRISTOFFERSON J., MEHRABADI M.M., NEMAT-NASSAR S., “A micromechanical
description on granular material behavior”, Journal of Applied Mechanics ASME, vol. 48, no. 2, pp. 339–344, 1981.
[CLE 81] CLEMENTS R.P., The deformation of rockfill: inter-particle behaviour, bulk properties and behaviour in dams, PhD Thesis, King’s College, University of London, 1981.
[COO 04] COOP M.R., SORENSEN K.K., BODAS FREITAS T. et al., “Particle breakage during shearing of a carbonate sand”, Geotechnique, vol. 54, no. 3, pp. 157–163, 2004.
[DAO 01] DAOUADJI A., HICHER P.Y., RAHMA A., “An elastoplastic model for granular materials taking into account grain breakage”, European Journal of Mechanics – A/Solids, vol. 20, no. 1, pp. 113–137, 2001.
[DAO 10] DAOUADJI A., HICHER P.-Y., “An enhanced constitutive model for crushable granular materials”, International Journal for Numerical and Analytical Methods in
Geomechanics, vol. 34, no. 6, pp. 555–580, 2010.
[DEM 77] DE MELLO V.F.B., “Reflections on design decisions of practical significance to embankment dams”, Geotechnique, vol. 27, no. 3, pp. 281–355, 1977.
[EIN 07a] EINAV I.,“Breakage mechanics–Part I: Theory”, Journal of the Mechanics and
Physics of Solids, vol. 55, no. 6, pp. 1274–1297, 2007.
[EIN 07b] EINAV I., “Breakage mechanics–Part II: Modelling granular materials”, Journal of
the Mechanics and Physics of Solids, vol. 55, no. 6, pp. 1298–1320, 2007.
[EZA 10] EZAOUI A., LECOMPTE T., DI BENEDETTO H. et al., “Effects of various loading stress paths on the stress-strain properties and on crushability of an industrial soft granular material”, Granular Matter, vol. 13, pp. 283–301, 2010.
[FRO 12] FROSSARD E., HU W., DANO C. et al., “Rockfill shear strength evaluation: a rational
method based on size effects”, Geotechnique, vol. 62, no. 5, pp. 415–428, 2012.
[GRI 21] GRIFFITH A.A., “The phenomena of rupture and flow in solids”, Philosophical
Translations of the Royal Society of London A, vol. 221, pp. 163–198, 1921.
[HAR 85] HARDIN B.O., “Crushing of soil particles”, Journal of Geotechnical Engineering, vol. 111, no. 10, pp. 1177–1192, 1985.
[HU 07a] HU L.B., HUECKEL T.,“Coupled chemo-mechanics of intergranular contact: towards a three-scale model”, Computers and Geotechnics, vol. 34, pp. 306–327, 2007.
[HU 07b] HU L.B., HUECKEL T., “Creep of saturated materials as a chemically enhanced rate-dependent damage process”, International Journal for Numerical and Analytical Methods
in Geomechanics, vol. 31, pp. 1537–1565, 2007.
[HU 11a] HU W., DANO C., HICHER P.-Y. et al., “Effect of sample size on the behavior of granular materials”, Geotechnical Testing Journal, vol. 34, no. 3, pp. 186–197, 2011. [HU 11b] HU W., YIN Z., DANO C. et al.,“A constitutive model for granular materials
considering grain breakage”, Science in China Series E - Technological Sciences, vol. 54, pp. 1–9, 2011.
[HUN 02] HUNTER G., FELL R., The deformation behaviour of rockfill. UniCiv Report NoR-405, The University of New South Wales, Sydney, 2002.
[ISH 93] ISHIHARA K., “Liquefaction and flow failure during earthquakes”, Geotechnique, vol. 43, no. 3, pp. 351–451, 1993.
[IWA 77] IWASAKI T., TATSUOKA F., “Effects of grain size and grading on dynamic shear moduli of sands”, Soils and Foundations, vol. 17, no. 3, pp. 19–35, 1977.
[JAE 67] JAEGER J.C., “Failure of rocks under tensile conditions”, International Journal of
[LAD 10] LADE P., KARIMPOUR H., “Static fatigue controls particle crushing and time effects in granular materials”, Soils and Foundations, vol. 50, no. 5, pp. 573–583, 2010.
[LEP 70] LEPS T.M., “Review of shearing strength of Rockfill”, Journal of the Soil Mechanics
and Foundation Division ASCE, vol. 96, no. 4, pp. 1159–1170, 1970.
[LI 15] LI G., LIU Y.-J., DANO C. et al., “Grading-dependent behavior of granular materials:
from discrete to continuous modeling”, Journal of Engineering Mechanics ASCE, vol. 141, no. 6, 2015.
[LI 16] LI L., WANG Z., LIU S. et al., “Calibration and performance of two different constitutive models for rockfill materials”, Water Science and Engineering, vol. 9, no. 3, pp. 227–239, 2016.
[LIU 14] LIU Y.J., LI G., YIN Z.-Y. et al.,“Influence of grading on undrained behavior of granular materials”, Comptes-rendus de Mécanique, vol. 342, pp. 85–95, 2014.
[LOV 27] LOVE A.E.H., A Treatise of Mathematical Theory of Elasticity, Cambridge
University Press, Cambridge, 1927.
[MAR 67] MARSAL R., “Large-scale testing of rockfill materials”, Journal of the Soil
Mechanics and Foundation Division ASCE, vol. 93, no. SM2, pp. 27–44, 1967.
[MAR 72] MARACHI N.D., CHAN C.K., SEED H.B., “Evaluation of properties of rockfill materials”, Journal of the Soil Mechanics and Foundation Division ASCE, vol. 98, no. SMI, pp. 95–114, 1972.
[MAR 73] MARSAL R., “Mechanical properties of rockfill dams”, in HIRSCHFELD R.C., POULOS S.J. (eds), Embankment-dam Engineering, John Wiley and Sons, Hoboken, 1973. [MAR 07] MARKETOS G., BOLTON M.D., “Quantifying the extent of crushing in granular
materials: a probability-based predictive method”, Journal of Mechanics and Physics in
Solids, vol. 55, pp. 2142–2156, 2007.
[MCD 96] MCDOWELL G.R., BOLTON M.D., ROBERSTON D., “The fractal crushing of granular materials”, Journal of Mechanics and Physics in Solids, vol. 44, no. 12, pp. 2079–2102, 1996.
[MCD 02] MCDOWELL G.R., “On the Yielding and Plastic Compression of Sand”, Soils and
Foundations, vol. 42, no. 1, pp. 139–145, 2002.
[MIC 15] MICHALOWSKI R.L., NADUKURU S.S., “Contact fatigue: a key mechanism of time effects in silica sand”, in SOGA K., KUMAR K., BISCONTIN G. et al. (eds), International
Symposium on Geomechanics from micro to macro, CRC Press, Boca Raton, 2015.
[MIU 79] MIURA N., O-HARA S., “Particle-crushing of a decomposed granite soil under shear stresses”, Soils and Foundations, vol. 19, no. 3, pp. l–14, 1979.
[MOR 04] MOREAU J.J., “An introduction to unilateral dynamics”, FREMOND M., MACERI F. (eds), Novel Approaches in Civil Engineering, vol. 14, Springer-Verlag, Berlin, pp. 1–46, 2004.