ADVOCATE bulletin
AB 7
(January 2015)CL
:
AIRE
1. IntroductionAn important challenge faced by environmental practitioners is the estimation of the impact of contamination that is transported from the source of contamination to soil and groundwater at industrial sites. Specifically, quantification of contaminant flux in the vadose zone is challenging due partly to the heterogeneity of the complex porous medium and the preferential flow. Contaminant flux estimations are essential to better establish risk assessment of soil and groundwater as well as to support the selection of remedial measures.
Several methods have been developed for contaminant flux estimations in the vadose zone. These methodologies are either based on modelling, on experimental approaches, or on the combination of both, and have been developed principally in the context of agricultural purposes. However, the applicability of such techniques is questioned when it comes to their application to industrial sites, due to differences in depth of investigation, soil origin, contamination and sources.
An overview of contaminant flux measurement techniques, together with a potential alternative for improving characterisation techniques and contaminant flux measurement in the vadose zone is presented in this bulletin. The vadose zone experimental setup consists of the combination of the Vadose Zone Monitoring System (VMS) and cross-hole geophysics.
2. Background
In the last decades, soils and groundwater at industrial sites have been at risk from contaminant discharges, inducing a major risk to the environment and to humans. At many industrial sites, a vadose or unsaturated soil zone separates the source area at the soil surface from the target groundwater body in the subsoil. This vadose zone largely controls contaminant release to the groundwater body. Therefore, it is important to understand the processes that govern the transport and fate of contaminants in this area, especially for designing protection and remediation measures (Govindaraju, 2002). In order to understand the distribution and the transport of pollutants to groundwater, contaminant fluxes through the vadose zone must be quantified (Bloem et al., 2010; Mertens et al., 2008; Govindaraju, 2002). However, as stated by Mertens et al. (2005) and
Wöhling et al. (2009), assessing contaminant fluxes in the vadose zone has proven to be a challenge. One of the principal causes of such difficulties relates to the heterogeneity of the vadose zone. Measuring fluxes within the vadose zone is difficult, as heterogeneities produce marked variations in water contents and pollutant movement (Bloem et al., 2010). Additional challenges arise from the non-linear character of the transport features and of the reactivity of the contaminants in the subsurface. Changes in vadose zone properties and water content affect contaminant velocities as well as dispersion and speciation of contaminants. The latter enhances chemical reactions such as sorption or precipitation and produces variations in the distribution and partitioning of contaminants in the subsurface. Therefore, monitoring fluxes in long-term experiments may be extremely difficult to achieve. In order to overcome these challenges, there is a need to develop methods that can measure fluxes under high temporal and spatial resolutions (Wöhling et al., 2009).
3. Techniques to Estimate Contaminant Flux
Mathematically, the mass flux of a water dissolved contaminant (i.e. a solute), is defined by equation 1 (Parker et al., 1984):
J = qCf (1)
Where J is the contaminant mass flux [ML-2T-1], q is the water flux
[LT-1] and C
f the flux averaged concentrations [ML-3]
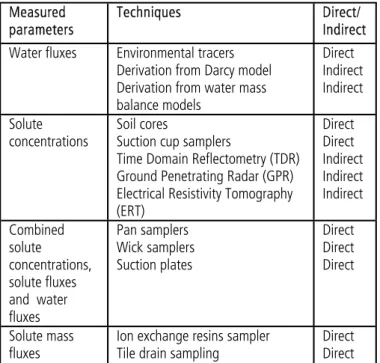
Several techniques have been applied to estimate solute fluxes. Methodological approaches can be classified as direct and indirect. According to Vanclooster et al. (2007), direct methods measure properties that can be entered directly into a transport model, whereas the latter calculates a “proxy” of the former property. In the latter case measurement of soil variables which indirectly are related to the solute transport process are combined with a theoretical model to obtain a calculated flux. For instance, according to equation 1, knowledge of water fluxes and solute concentrations can be used to calculate solute fluxes in the vadose zone (Gee et al., 2003), and these properties can be estimated with indirect methods. Yet, a clear cut distinction between direct and indirect methods does not really exist. Table 1 summarises solute mass flux estimation techniques, based on the parameters that they can measure and the indirect or direct character of the methodological approach.
Copyright © CL:AIRE (Contaminated Land: Applications in Real Environments).
CL:AIRE’s ADVOCATE bulletins describe practical aspects of research which have direct application to the
characterisation, monitoring or remediation of contaminated soil or groundwater. This bulletin describes a method for
improving site characterisation and measuring contaminant flux in the vadose zone at industrial contaminated sites.
Vadose zone characterisation at industrial
contaminated sites
This bulletin was written by Natalia Fernandez de Vera, Department Hydrogeology and Environmental Geology, University of Liège, Chemin des chevreuils 1, B52/3, 4000, Liège, Belgium. The assistance of the following co-authors is gratefully acknowledged: Ofer Dahan, Alain Dassargues, Marnik Vanclooster, Frédéric Nguyen, and Serge Brouyère. For further information please email: [email protected]
ADVOCATE bulletin
AB 7 page 2
4. Limitations of Flux Measurement Techniques in Relation to Industrial Contaminated Sites
Overall, there is no definitive method to estimate contaminant fluxes. All techniques have advantages and disadvantages, and cannot be applied under all circumstances. Of particular note is that these techniques have been developed in the context of agricultural soils. Industrial soils differ significantly from agricultural soils in terms of their origin, age and composition. In addition, the pollutants are more varied, have larger volumes, and can come from point sources of a diverse nature. Thus the complexity of pollutants in industrial settings is higher than in agricultural settings.
Another important limitation is the fact that the majority of the agricultural-based techniques are applied to the first metres of the soils. The intermediate vadose zone, located beneath the crop rooting zone, is often not characterised due to the lack of data at such depths (Spalding and Kitchen, 1988). At greater depths, the unsaturated zone might not be affected by processes occurring in the near-surface environment (Hubbel et al., 2004). Therefore, the applicability of the discussed techniques in intermediate unsaturated zone areas might not be representative for industrial sites. There is therefore a need to improve flux estimation technologies.
5. Application of the Research
The vadose zone monitoring system (VMS) (Fig. 1) developed during this research consists of a sleeve which is inserted in an uncased inclined borehole. Assuming vertical flow in the vadose zone, inclination in the borehole allows the monitoring units to face an undisturbed sediment column, avoiding typical disturbances, such as preferential flow paths, caused by vertical drilling operations (Dahan et al., 2009). The sleeve contains monitoring units along its depth (Fig. 2), allowing continuous measurements of soil water contents and water sampling at different depths of the vadose zone (Dahan et al., 2009). Such monitoring units are the time domain transmissometry probes (TDT), vadose sampling ports (VSP) and fracture samplers (FS). TDTs continuously monitor water content.
They are made of stainless steel waveguides, which are attached over a flexible sleeve that can be installed in vertical or slanted boreholes (Rimon et al., 2007; Dahan et al., 2007; Dahan et al., 2008; Amiaz et al., 2011). VSP and FS are used for sampling water from the vadose zone, in the pore matrix and in fractures respectively. This system has the advantages that it can be applied to deep vadose zones (from 16 m to 45 m depth) and it allows continuous monitoring through the entire vadose zone.
The VMS is combined with vertical boreholes containing electrodes for ERT measurements, providing geophysical imaging of the subsurface (Fig. 3). The 3D inversion of such images, calibrated with the information provided by the VMS, allows monitoring of water and contaminant distributions together with imaging of the distribution of heterogeneities in the subsurface.
Table 1: Contaminant flux estimation techniques
Measured parameters
Techniques Direct/ Indirect Water fluxes Environmental tracers
Derivation from Darcy model Derivation from water mass balance models Direct Indirect Indirect Solute concentrations Soil cores
Suction cup samplers
Time Domain Reflectometry (TDR) Ground Penetrating Radar (GPR) Electrical Resistivity Tomography (ERT) Direct Direct Indirect Indirect Indirect Combined solute concentrations, solute fluxes and water fluxes Pan samplers Wick samplers Suction plates Direct Direct Direct Solute mass fluxes
Ion exchange resins sampler Tile drain sampling
Direct Direct
Figure 1: The vadose zone monitoring system (VMS)
Figure 2: Flexible sleeve containing monitoring units
ADVOCATE bulletin
AB 7 page 3
The system has been installed at a former industrial site in Belgium. The legacy of industrial activities has resulted in soil and groundwater contamination with benzene, toluene, ethylbenzene, xylene (BTEX), cyanide, polycyclic aromatic hydrocarbons (PAH) and heavy metals. The first metre of soil is composed of backfill, followed by 3 m of alternating chalk, sand and loam deposits. From 4 m to 11 m depth, the lithology is essentially composed of silex and chalk. The water level is located at 8 m depth, showing a seasonal variation of 3 m. Two VMS (comprising TDTs, VSP and FS) have been installed on site along with four boreholes equipped with 24 electrodes each for cross-hole geophysical measurements. The site has been monitored under natural recharge conditions. So far, results have provided important information about the dynamics of water and chemical compounds in the vadose zone.
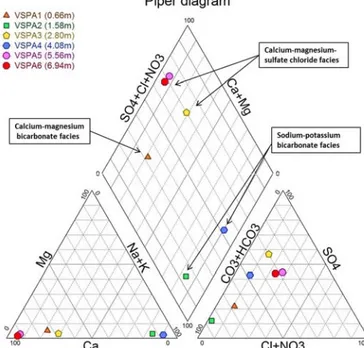
Fig. 4 shows the monitoring results under natural recharge conditions from 01/11/2013 to 01/12/2013. The upper diagram represents the daily cumulative rainfall measured on site, together with evapotranspiration rates. The next five diagrams represent water contents registered continuously by the TDTs at different depths. Finally, groundwater level variations are presented in the lowest part of the graph. The TDT located at 0.2 m shows rapid wetting and draining reactions to rainfall events, whereas the TDT located at 1.12 m shows water contents increasing gradually. Once infiltration water has saturated the soil/rock matrix, water transport in fractures is activated. Such activation triggered abrupt increases of water content at deeper areas of the unsaturated zone, as is observed in TDT3 (2.34 m depth) on 8/11/2013. The Piper diagram (Fig. 5) shows chemical facies from water samples obtained from VSP at different depths of the vadose zone (samples taken on the 26/11/2013). Results show a relatively continuous evolution of water chemistry and facies with depth, from calcium-magnesium bicarbonate to calcium-magnesium sulphate chloride, through
sodium-potassium bicarbonate facies. Such changes are enhanced in the shallowest part of the vadose zone because of the stronger disequilibrium between infiltrated rain water and hydrochemical conditions prevailing in the unsaturated zone. Metal analyses were carried out in order to detect contamination. Arsenic concentrations over reference values were found at 1.58 m and 4.08 m depth. Chromium concentrations exceeded reference values at 1.58 m. High concentrations of nickel were found in all samples, indicating contamination from the surface to a depth of 7 m.
Figure 4: Cross-hole geophysics
ADVOCATE bulletin
AB 7 page 4
Fig. 6 shows the results obtained from ERT cross-hole geophysical imaging (geophysical measurement made on December 2013). Such images allow the structure and heterogeneity of the subsurface to be characterised. The highly conductive subsurface is in agreement with the high mineralisation of soil water as measured in the samples collected with the VSP. In addition, from 4 m to 5m depth, a more resistive area can be identified, corresponding to a layer of silex.
All these results, obtained at a scale representative of the underground heterogeneity, show that recharge mechanisms for water and transported contaminants are very complex and can be attributed to prevailing hydrological conditions and subsurface structures and flowpaths. Subsequent experiments will consist of tracer tests under different recharge conditions, using saline tracers monitored with ERT and VSP sampling. Further research will also focus on the interactions between the vadose and saturated zone, on contaminant mixing and dilution in groundwater.
6. Acknowledgements
The research leading to these results has received funding from the European Community's Seventh Framework Programme (FP7/2007-2013 under grant agreement n°265063).
7. References
Amiaz, Y., Sorek, S., Enzel, Y., Dahan, O. 2011. Solute transport in the vadose zone and groundwater during flash floods. Water Resources, 47(April), 1-10. doi:10.1029/2011WR010747 Bloem, E., Hogervorst, F.a.N., de Rooij, G.H., Stagnitti, F. 2010.
Variable-suction multicompartment samplers to measure spatiotemporal unsaturated water and solute fluxes. Vadose Zone Journal, 9(1), 148.
Dahan, O., Shani, Y., Enzel, Y., Yechieli, Y., Yakirevich, A. 2007. Direct measurements of floodwater infiltration into shallow alluvial aquifers. J. Hydrol. 344, 157-170. doi:10.1016/ j.jhydrol.2007.06.033
Dahan, O., Talby, R., Yechieli, Y., Adar, E., Enzel, Y. 2009. In situ monitoring of water percolation and solute transport using a vadose zone monitoring system. Vadose Zone Journal, 8(4). doi:10.2136/vzj2008.0134
Dahan, O., Tatarsky, B., Enzel, Y., Kulls, C., Seely, M., Benito, G. 2008. Dynamics of flood water infiltration and ground water recharge in hyperarid desert. Ground Water, 46(3), 450-461. doi:10.1111/j.1745-6584.2007.00414.x
Flury, M. 1996. Experimental evidence of transport of pesticides through field soils - A review. J. Environ. Qual. 25:25–45
Gee, G.W., Zhang, Z.F., Ward, A.L. 2003. A modified vadose zone fluxmeter with solution collection capability. Vadose Zone Journal, 2: 627-632.
Govindaraju, R.S. (ed.), 2002. Stochastic Methods in Subsurface Contaminant Hydrology, American Society of Civil Engineers, 410p.
Hubbell, J.M., Sisson, J.B. 1998. Advanced Tensiometer for shallow or deep soil water pressure measurements. Soil Sci. 163: 271–277.
Kung, K.-J.S., E. Kladivko, E., Gish, T.J., Steenhuis, T.S., Bubenzer, G., Helling, C.S. 2000a. Quantifying preferential flow by breakthrough of sequentially-applied tracers: Silt loam soil. Soil Sci. Soc.Am. J. 64:1296–1304.
Mertens, J., Barkle, G.F., Stenger, R. 2005. Numerical analysis to investigate the effects of the design and installation of equilibrium tension plate lysimeters on leachate volume. Vadose Zone Journal, 4(3), 488.
Parker, J.C., van Genuchten, M.Th. 1984. Flux-averaged and volume-averaged concentrations in continuum approaches to solute transport, Water Resour. Res., 20(7), 866–872.
Rimon, Y., Dahan, O., Nativ, R., Geyer, S. 2007. Water percolation through the deep vadose zone and groundwater recharge: Preliminary results based on a new vadose zone monitoring system. Water Resources, 43, 1-12. doi:10.1029/2006WR004855
Spalding, R.F., Kitchen, L.A. 1988. Nitrate in the intermediate vadose zone beneath irrigated cropland: Ground Water Monitoring Review, v. 8, p. 89–95
Vanclooster, M., Javaux, M., Lambot, S. 2007. Recent advances in characterizing flow and transport in unsaturated soil at the core and field scale. Estudios de la Zona no Saturada del Suelo Vol. VIII. Giraldez Cervera y F.J. Hornero.
Weihermüller, L., Siemens, J., Deurer, M., Knoblauch, S., Rupp, H., Göttlein, A., Pütz, T. (n.d.) 2007. In situ soil water extraction: a review. Journal of Environmental Quality, 36(6), 1735-48. Wells, R., Steenhuis, T.S., Geohring, L.D., Wallach, R., Kung,
K.-J.S. 1998. Predicting fast transport of agri-chemicals in agricul- tural tile lines in heterogeneous field soils. p. 544–550. In L.C. Brown (ed.) Drainage in the 21st century: Food production and the environment. Proc. 7th Annual Drainage Symp., Orlando, FL. 8–10 Mar. 1998. Am. Soc. Agric. Eng., St. Joseph, MI.
Wöhling, T., Schütze, N., Heinrich, B., Šimůnek, J., Barkle, G. F. 2009. Three-dimensional modeling of multiple automated equilibrium tension lysimeters to measure vadose zone fluxes. Vadose Zone Journal, 8(4), 1051.
For more information on the ADVOCATE Project, please visit: www.theadvocateproject.eu
If you have any questions about this bulletin or would like further information about other CL:AIRE publications please contact us at: Email: [email protected] Website: www.claire.co.uk