Weighing
nearby stars
with
GAIA?
S.Dibl'r,
J. Surdej2'*, J.-F. Claeskens2' **lMax
Planck Institut ftr Astronomie, Kônigstuhl L7,69\17 Heidelberg, Germany
2lnstitut
d'Astrophysique et de Géophysique, Avenue de Cointe 5,4000 Liège, Belgium
+ Directeur de Recherches du FNRS (Belgium) ** Chargé de Recherches du FNRS (Belgium)
Ï E-mail: [email protected]
Abstract.
Microlensing consists of two major effects: (1) variation in the apparentposition of the background sources (astrometric component) and (2) flux variations of
the background sources (photometric component). While the Iatter has been extensively
used in the search for dark objects in the Galactic disk and halo (projects like MACHO
(Alcock et aI. 1997), EROS (Derue et al. 1999), OGLE (Paczyriski et al. 1994)), thefust
effect has not yet been part of a systematic observational program, simply because the
observations of very slight displacements in the positions of background sources require
an astrometric accuracy which current telescopes do not yet provide. We investigate here
whether the astrometric accuracy of GAIA could enable such measurements and, as a
consequence, enable new, direct and original measurements of the mass of nearby stars.
Exploiting the astrometric microlensing effect has been discussed in the last decade by
several authors like Hosokawa et
al.
(1993), Miralda-Escudé (1996), Paczyriski (1998),Gould (2000) and many others.
1.
Introduction
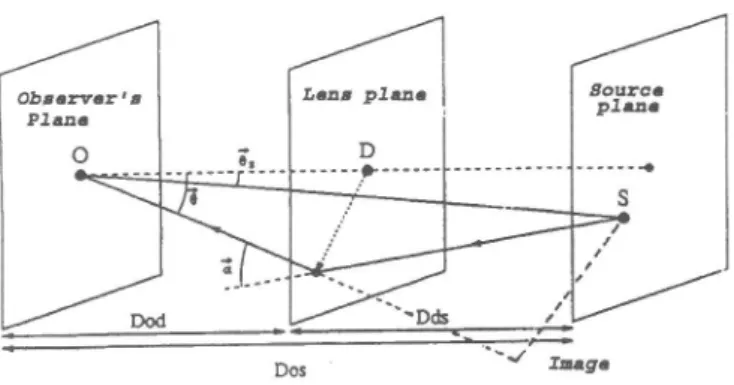
When a nearby star (the lens) passes in front of a distant background source, the Iuminous ray coming from the source is deflected in the vicinity of the lens by its gravitational potential, and two distinct images of the source are produced. Only
one of them (called the main image) is amplified and can be observed. A schematic
description of a microlensing system is given
in
Figure 1, where O represents theobserver, D the deflector and S the background source.
A
simple equation, calledthe lens equation links the position of the source d", the position of the image
I
and the deflection anglea.
When the lens is described by the simple Point Massmodel (see Refsdal and Surdej 1994), the lens equation is a simple second order eouation:
0-0s
=
4G
c2
M
0
I
D6s
Dos
Dsp'
where
Dpg, Dp5
andD6p
are respectively the lens-source, observer-source and observer-lens distances and M the mass of the lens. The right hand term of Equa-tion 1 is proportional to the deflection anglea.
For a nearby star the ratio betweenDps
andD6s
is closeto
unity and the Einstein angular radius simplifies to:(1)
(r\
T4G
M
H--^l_
obtafraÊt t PIù.
o D
-J rntge
Figure 1: Schematic geometrical configuration of a microlensing system.
The positive root of Equation 1 provides the position of the main image
da.
The difference between0a
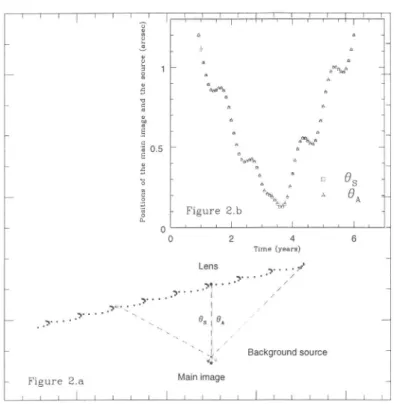
and ds reflects the signature of the microlensing effect. In order to quantify this effect, we artificially place a 1.5 Mo lens, which has a proper motionof
0.4" fyear,at
a distanceof
10 parsec and a background sourceat
aninitial
angular separation of 1.2 arcsec from the lens. In Figure 2.a we display the trajectory of the lens projected on the sky, the background source and the main image which is formed due to microlensing. Whenever the difference between the position of the source ds and the position of the main image 0a can be resolved (hereofthe
order 10-3-10-2 arcsec), a lensing event is registered and astrometric lensing effects measured. The physical quantity that is extracted from thefitting
of the positions of the lensed background sources as displayed in Figure 2.b, is not directly the mass of the lens but its Einstein angular radius ds which does not onlydepend on the mass of the lens but also on its distance. Thus, large uncertainties
on the distance will control those on the mass. Another point is that the lens must
have a proper motion high enough, typically ofthe order
-
(Q.3"-1"/Iear), so that its detection zone (see below)will
cover a part of the sky sufficiently large during a time spanthat
is short enough for observationsto
be carriedout.
This is why the method is ideally suited for weighing nearby stars.2.
Application
of
the
method
to
GAIA
A lensing event is detectable whenever
l0A(t)-0s(t)l à
d,*h"r"
/
represents someastrometric accuracy. This leads
to
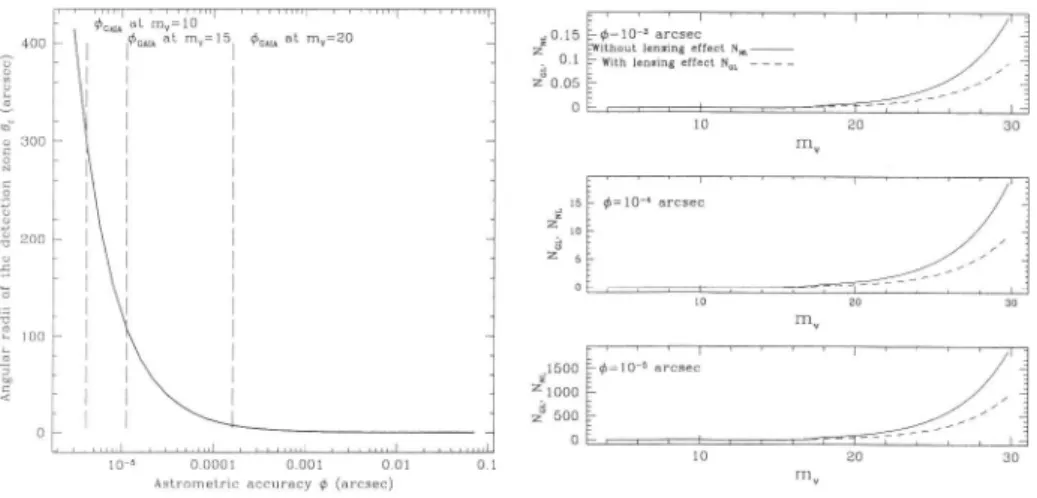
the concept of a circularly shaped detectionzone centered on the lens. Figure 3 displays the radii of the detection zone dy for the above considered lens as a function of the astrometric accuracy. The three vertical dashed lines
in
Figure 3 correspondto
three different expectedaccura-cies for GAIA at three different limiting magnitudes, see Lindegren and Perryman
(1996). The
ratio of
the areaof
the astrometric detection zoneto
the area of the photometric detection zoneat
the magnitudesof
10, 15 and 20 is given by0r(^,:
10, 15,20)l0E which yields respectively the values of 7.5x
107, 1x
107 and 5x
104. Based on the Bahcall&
Soneira star counting models (1981), weFigure 2.a Main image
Figure 2: a) Moving microlens as projected on the sky and b) Astrometric microlensing effects.
background of the lens (in the direction of the Galactic Center, i.e. along the opti-mai direction to detect microlensing events). The number of stars in the detection zone when microlensing effects are or not taken into account are represented by
1y'67, and ,fy'1r;, respectively. Iy'6r; and 1y'1,'1, are calculated as a function of the
Iimiting magnitude
m,.
These are displayed in Figure 4 for three different valuesof the astrometric accuracy. Table 1 summarizes the expected number of source
stars in the background of the lens for the three specific GAIA angular accuracies
indicated
in
Figure3
alongwith
the valueof
the corresponding detection zoneradii. A
minimum criterion for the application of this method is to haveat
least one background sourcein
the detection zone of the lens (following the conditionthat
the detection zone should be crossed by the lens during a span of time shortenough
to
carry out the observations). Ideally, more than one background sourceshould be present
in
the detection zoneto
allowfor
a statistical treatment andto
reduce uncertainties. The numbersly'ç;
displayedin
Table 1 are quite small aithough the corresponding detection zones are quite large. This compromises the observation of complete curves such as the one displayed in Figure 2.b. Ideally,if
an astrometric accuracy of 4 p,as v/as available at the limiting magnitude rrr,
:
14,the number ,^y'çr, would be equal to 2 and equal
to
17 atm, =
t$.,0.u.t -'=t:, dcru ôi m!=20
10 6 0.oo0l 0.001 0.01 0.1 Asiromel.ic accu.acy C (arcec)
l.ndn8 .lt.cl ll{lth lênriDg .tfêct Nq! -to zo 30 mv m" 10 20 30 mv .0.15 = 0.1 z 0_05 o z.* rl5oo z looo 0 ;200
:
P roo 0Figure 3: Angular radii of the astrometric ae- Figure
4:
Number of stars in the detectiontection zone as a function of the astrometric ac- zone as a function ol ô and m,
curacy.
ly'.nru Nn, dy (arcsec)
ô=4p'as,mr=I0
4.62x
70- 2.03x 10-'
305ô:
Ll pas, mu=
l$
1.68 0.84 111d
:
160 pas, rnu:
)Q u.ù I 0.185 7.63Table 1: Summary of the expected number of stars in the detection zone of the test star for
three specific GAIA angular accuracies.
Due to the low background surface density of stars at optical wavelengths, GAIA presents too limited capabilities
in
orderto
detect microlensing eventsthat
aresuitabie for weighing nearby stars. Better astrometric accuracies of future space
missions as well as operating these at longer wavelengths could provide the
neces-sàry improvements to achieve this goal.
References
Alcock C. et aI. 1997, ApJ. vol. 491, 436
Bahcall J. N. & Soneira R. M. 1980, ApJ. Suppl. Ser. vol. 44, 73
Derue ef o,l. 1999, EROS collaboration, A&4. voi. 351, 87
Gould A. 2000, ApJ. vol. 532, 936
Hosokawa M. et al. 1993, A&A 278, L27-L30
Lindegren L. & Perryman M. A. C. 1996, A&4. Suppl. Ser. vol. 116, 579
Miralda-Escudé J. 1996, ApJ. 470, L1i3
Paczyriski B. 1998, ApJ. Letters 494, L23
Paczyriski B. et al,. 1994, ApJ. Part2-Letters vol. 435, nr2 L113