Faculté de génie
Département de génie civil
Modelling strategy to implement the local buckling and
the non-linear behaviour of bolted connections in the
analysis of steel lattice transmission towers
Stratégie de modélisation pour intégrer le flambement local
et le comportement non linéaire des connexions boulonnées
dans l’analyse des pylônes à treillis en acier de lignes de
transport d’énergie
Thèse de doctorat
Spécialité : Génie Civil
Farshad POURSHARGH
Sherbrooke (Québec) Canada
April 2021
MEMBRES DU JURY
Sébastien Langlois, Prof. Directeur
Frederic Legeron, Prof. Co-Directeur
Charles-Philippe Lamarche, Prof. Rapporteur et Évaluateur
Ghyslaine McClure, Prof. Évaluateur
Simon Prud’homme, Ph.D Évaluateur
ABSTRACT
The development of finite element method with the aid of powerful software has made it possible to analyze and design complicated civil engineering structures with more accuracy and reliability. Among these, electricity transmission line structures play an important role in our economy. Current practice in transmission line steel lattice tower design has many simplifying assumptions and cannot cover the real behaviour of towers under various loading conditions. Meanwhile, to qualify the design, a full-scale tower test has to be performed which is expensive and time consuming. Advanced numerical models have been developed in the past to simulate with more precision the behaviour of lattice towers. These models can limit and optimize the use of full-scale tests. However, some aspects of the non-linear structural behaviour of towers is still not efficiently taken into account in those advanced numerical methods.
In this research, an advanced numerical modelling and analysis procedure using the finite element method and predicting the behaviour up to failure of lattice towers made of steel angles is proposed. Two main subjects for non-linear modelling of towers are considered. Firstly, the local buckling failure of members using 1D beam elements is addressed by providing a new method to modify the material behaviour of the member. Secondly, a method is presented to predict the behaviour of various configurations of bolted steel member connections. The predicted behaviour then can be applied as a non-linear spring element to model the connections in the full tower. Using these methods less modelling effort, complication and time will be needed for tower projects and full-scale modelling. In addition, more accurate results are expected as we cover more non-linear aspects of the structure behaviour.
Keywords: Lattice steel tower, Angle section, Local buckling, Non-linear behaviour, Fiber
RÉSUMÉ
L’évolution de la méthode des éléments finis et l’utilisation de puissants logiciels ont rendu possibles l’analyse et la conception des structures complexes de génie civil avec plus de précision et de fiabilité. Parmi ces dernières, les structures du réseau de transport électrique jouent un rôle important dans notre économie.
La pratique courante pour la conception des pylônes en treillis acier contient beaucoup d’hypothèses simplificatrices, et ne reproduit pas adéquatement le comportement réel des pylônes soumis à différents cas de chargement. Entre temps, pour qualifier la conception, un test à grande échelle est généralement réalisé, ce qui est très coûteux et long. Des modèles numériques avancés ont été développés dans le passé pour simuler avec plus de précision le comportement des pylônes en treillis. Ces modèles peuvent limiter et optimiser l’usage d’un test à grande échelle. Néanmoins, certains aspects du comportement structural non linéaire des pylônes ne sont pas considérés dans ces méthodes numériques avancées.
Ces travaux de recherche proposent une modélisation numérique avancée, une procédure d’analyse en utilisant la méthode des éléments finis et la prédiction du comportement à la rupture des pylônes à treillis composés de cornière d’acier. Deux sujets majeurs pour la modélisation non linéaire des pylônes sont considérés. Premièrement, la rupture en voilement local des membrures en utilisant un élément de poutre 1D est traité en fournissant une nouvelle méthode pour modifier le comportement du matériau de l’élément. Deuxièmement, une méthode est présentée afin de prédire le comportement des différentes configurations des connexions boulonnées dans les éléments en acier. Le comportement prédit peut être appliqué en tant qu’élément ressort non linéaire afin de modéliser les assemblages dans le pylône. L’utilisation de ces méthodes diminuera l’effort de modélisation, les complications et le temps nécessaire pour des projets de pylône et
permettra la modélisation à grande échelle. En outre, des résultats plus précis sont attendus étant donné que le comportement non linéaire des structures est davantage pris en compte.
Mot clé : Pylônes à treillis en acier, profilé de cornière, voilement local, comportement non
Acknowledgments
I would like to first thank my supervisors Prof. Sebastien Langlois and Prof. Frederic Legeron, for their continuous support and guidance along this way. Without their support and advices to improve this study, it would be impossible for me to achieve this success. My sincere gratitude to Prof. Langlois, who helped me on reviewing this thesis and related articles.
This study is conducted based on research fund from RTE/Hydro-Quebec and Natural Sciences and Engineering Research Council of Canada (NSERC), so I acknowledge all the financial support from these organizations to conclude this program.
Immense experience and knowledge of Dr. Marc Demers, on designing the experimental specimens and testing procedure as well as his comments and encouragement is also highly appreciated. In addition, my special thanks to Dr. Kahina Sad-Saoud, for helping me with experimental results, modeling of specimens and her help on improving the articles.
Finally, my special thanks goes to my Father, Mother and Wife. Words cannot describe what you have provided and sacrificed for me during this journey.
TABLE OF CONTENTS
ABSTRACT ... I RÉSUMÉ ... III ACKNOWLEDGMENTS... V TABLE OF CONTENTS ... VI LIST OF TABLES... XI LIST OF FIGURES... XIIICHAPTER 1 INTRODUCTION ... 1
1.1. ANALYSIS AND DESIGN OF TRANSMISSION LINE STRUCTURES ... 1
1.2. CURRENT DESIGN RECOMMENDATIONS ... 2
1.3. VALIDATION OF DESIGN RESULTS ... 3
1.4. LOCAL BUCKLING FAILURE FOR ANGLES ... 3
1.5. CONNECTION BEHAVIOUR ... 4
1.6. OBJECTIVES IF THIS STUDY ... 5
1.7. CONTRIBUTION TO INDUSTRY ... 5
1.8. ORGANIZATION OF THE DISSERTATION ... 6
CHAPTER 2 LITERATURE REVIEW... 7
2.1. ADVANCED MODELLING TECHNIQUES OF TRANSMISSION TOWERS ... 7
2.2. CONSIDERATION OF NON-LINEAR BEHAVIOUR ... 10
2.3. CONNECTIONS AND BOLT SLIPPAGE... 10
2.4. TOWER CONFIGURATION AND ELEMENTS ... 15
2.5. TOWER CAPACITY PREDICTION ... 16
2.7. LOCAL BUCKLING OF SECTIONS ... 22
2.8. TYPES OF ELEMENTS TO MODEL LATTICE TOWERS ... 25
2.9. MESH DENSITY ... 30
2.10. CONCLUSION ... 31
CHAPTER 3 MODELLING STRATEGY ... 33
3.1. CONNECTION DETAILING ... 34
3.2. METHODOLOGY ... 37
3.2.1. Element type selection ... 37
3.2.2. Material behaviour ... 38
3.2.3. Local buckling of members ... 39
3.2.4. Non-linear behaviour of connection ... 41
3.2.5. Initial imperfections ... 45
3.2.6. Evaluation of the presented methods with experimental data ... 46
CHAPTER 4 LOCAL BUCKLING FAILURE ... 49
ABSTRACT ... 50
4.1. INTRODUCTION ... 51
4.2. SHORT ANGLE SPECIMENS ... 54
4.2.1. Local buckling slenderness ... 54
4.2.2. Experimental program ... 55
4.2.3. Material property tests ... 58
4.3. DEFINITION OF MATERIAL STRESS-STRAIN BEHAVIOUR ... 59
4.4. EVALUATING THE METHOD WITH EXPERIMENTAL RESULTS ... 66
4.4.1. Experimental program ... 66
4.4.2. Test specimens ... 68
4.4.3. Finite element modelling of specimens ... 69
4.4.4. Comparison of results and discussion ... 71
4.6. ACKNOWLEDGMENTS ... 74
CHAPTER 5 NON-LINEAR BEHAVIOUR OF CONNECTIONS ... 75
ABSTRACT ... 76
5.1. INTRODUCTION ... 77
5.2. MODELLING AND PREDICTION OF THE NON-LINEAR BEHAVIOUR OF BOLTED CONNECTIONS ... 80
5.2.1. Prediction method for one-bolt connections ... 82
5.2.2. Prediction method for multi-bolt connections ... 84
5.3. EXPERIMENTAL PROGRAM ... 87
5.3.1. Specimens ... 88
5.3.2. Test set-up ... 89
5.3.3. Material property tests... 91
5.4. RESULTS AND DISCUSSION ... 91
5.4.1. Analysis of configurations involving one bolt ... 91
5.4.2. Analysis of configurations involving two bolts ... 94
5.4.3. Analysis of configurations involving four bolts ... 97
5.4.4. Potential application of the proposed method in modelling of a steel lattice tower ... 99
5.5. CONCLUDING REMARKS ... 100
CHAPTER 6 APPLICATION OF THE PROPOSED METHOD ... 103
6.1. NUMERICAL ANALYSIS METHOD... 103
6.2. BEHAVIOUR OF THE BOLTED CONNECTIONS ... 105
6.3. REDUCED-SCALE TOWER SECTION TEST ... 107
6.4. TEST PROCEDURE AND INSTRUMENTS ... 111
6.5. RESULTS COMPARISON ... 113
CHAPTER 7 CONCLUSIONS AND FUTURE WORK ... 117
7.1. SUMMARY AND CONCLUSIONS ... 117
7.2. LIMITATIONS OF THIS RESEARCH ... 120
7.4. CONCLUSIONS ... 121
7.5. LIMITATIONS DE CETTE RECHERCHE ... 125
7.6. RECOMMANDATIONS POUR DES TRAVAUX FUTURS ... 126
LIST OF TABLES
Table 3-1: Properties of 1-bolt test specimens ... 44
Table 3-2: Properties of 2-bolt test specimens ... 45
Table 4-1: Properties of short angle test specimens ... 57
Table 4-2: Results of short angle tests ... 60
Table 4-3: Calculated values of parameters for equation (4-6) ... 64
Table 4-4: Comparison of parameters calculated with Equation (4-6) to test values for parameters 𝜺𝑨, 𝝈𝑨, 𝝈𝑩 ... 65
Table 4-5: Details of X-bracing test specimens ... 69
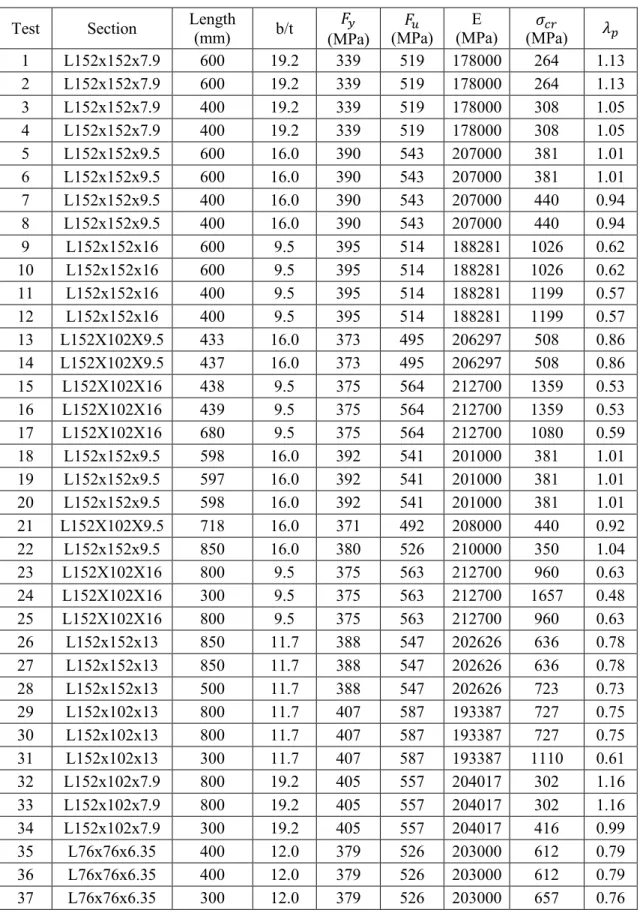
Table 4-6: Calculated 𝝈𝒄𝒓 and 𝝀𝒑 values for test specimens ... 71
Table 4-7: Accuracy of the analysis with and without including the presented method ... 73
Table 5-1: Properties of four-bolt specimens [54] ... 81
Table 5-2: Properties of one-bolt test specimens ... 81
Table 5-3: Two-bolt test specimens ... 89
Table 5-4: Comparison of predicted and experimental ultimate capacity for one-bolt specimens ... 94
Table 5-5: Comparison of predicted and experimental ultimate capacity for two-bolt specimens ... 97
Table 5-6: Comparison of predicted and experimental ultimate capacity for four-bolt specimens ... 98
Table 5-8: Parameters to calibrate the non-linear spring (four-bolt) ... 100 Table 6-1: Material properties of the angle sections [65] ... 104 Table 6-2: Stiffness values to define the discrete elements [65] ... 106 Table 6-3: Parameters defining the non-linear behaviour law of the bolted connections . 107 Table 6-4: Full-scale and reduced tower angles ... 109
LIST OF FIGURES
Figure 2-1: Local Buckling of cross-arm member and shell element modelling members [5]
... 8
Figure 2-2: Combination of Beam and Shell elements [13] ... 9
Figure 2-3. Joint eccentricities [5] ... 11
Figure 2-4. Bolted joint slippage effects [17] ... 12
Figure 2-5. Load-Deformation diagram for joints [21] ... 13
Figure 2-6: Deformed shapes in the bending (left) and flexure-torsion (right) cases [11] .. 17
Figure 2-7: Load-Displacement curves of bending case [11] ... 18
Figure 2-8: Load-Displacement curves of flexure-torsion case [11] ... 19
Figure 2-9: Failure modelling using plate elements [35] ... 19
Figure 2-10: Comparison of load capacities for leg members [35] (Note: FEM : Finite Element Model; ASCE [32]; BS [31]; IS [33]) ... 20
Figure 2-11: Comparison of load capacities for bracing members [35] (Note: FEM : Finite Element Model; ASCE [32]; BS [31]; IS [33]) ... 20
Figure 2-12: An angle section modeled by Truss, Beam, Fibre beam and Shell elements . 25 Figure 2-13: Modelling of a tower section by 1D and 2D elements ... 26
Figure 2-14: An angle member meshed in no, 1 and 2 end hole configuration ... 27
Figure 2-15: Buckling of an angle member inside the frame ... 27
Figure 2-16: SHELL 3D elements in Code-Aster (Left: TRIA7, Right: QUAD9) ... 28
Figure 2-18: Local deformation of angles [45] ... 30
Figure 3-1: Joint slippage behaviour in Code-Aster ... 34
Figure 3-2: Behaviour of a simple connection analyzed by Code-Aster ... 35
Figure 3-3: Joint types in towers ... 37
Figure 3-4: Non-linear material modelling (Left: bilinear relation, Right: real behaviour) 39 Figure 3-5: Local yielding and local buckling failures [46] ... 39
Figure 3-6: Finite element modelling of a connection by contact analysis ... 42
Figure 3-7: Experiment layout for 1-bolt and 2-bolt connections ... 43
Figure 3-8: Single and double bracing configurations used by Morrisette [51] ... 46
Figure 3-9: Reduced scale tower test [55] ... 47
Figure 4-1: Calculated curve to relate 𝝈𝒄𝒓 and (b/t) values ... 55
Figure 4-2: Adjustment plate in the supports ... 56
Figure 4-3: Test set-up and displacement transducer ... 58
Figure 4-4: Measured stress-strain behaviour of six test specimens ... 59
Figure 4-5: Equations (4-3) to (4-5) and distribution of test points ... 61
Figure 4-6: Comparison of stress-strain relationship between test results and equation (4-6) ... 63
Figure 4-7: Schematics of the test set-up [52] ... 67
Figure 4-8: X-bracing test set-up [52] ... 67
Figure 4-9: Geometry of the end plates and location of strain gauges (dimensions in millimeters) [52] ... 68
Figure 4-10: Lateral support of the angles in middle [52] ... 69
Figure 4-11: Local buckling mode of specimen (Test-3) ... 71
Figure 4-13: Comparison of failure stress results ... 73
Figure 5-1: Behaviour of connection under axial load ... 83
Figure 5-2: Comparison of different mesh refinement and sizes ... 85
Figure 5-3: 2D modelling of a two-bolt connection using a plate and spring elements ... 86
Figure 5-4: FE modelling of a connection involving four bolts ... 87
Figure 5-5: Configuration of four-bolt specimens [54] ... 87
Figure 5-6: Configuration of the tested specimens ... 88
Figure 5-7: Layout of experimental set-up ... 89
Figure 5-8: Final setup and transducer location ... 90
Figure 5-9a: Comparison of prediction and experimental behaviour of single-bolt connections ... 92
Figure 5-10: Numerical model of the two-bolt tests using 3D solid elements ... 96
Figure 5-11: Comparison of two-bolt connections ... 97
Figure 5-12: Deformed configuration of a two-bolt connection (specimen S20) ... 97
Figure 5-13: Comparison of four-bolt Specimens ... 98
Figure 6-1: Dimensions used to predict the connection behaviour (units in mm) ... 107
Figure 6-2: Reduced-scale test pylon [55] ... 108
Figure 6-3: Details of the tested structure [55] ... 109
Figure 6-4: Details of the tested structure (units mm) [55] ... 110
Figure 6-5: Tower section [55] ... 111
Figure 6-6: Transfer Beam to apply the forces [55] ... 112
Figure 6-7: Failure of the structure due to buckling of legs [55] ... 112
Figure 6-8: Comparison between the results of the experimental tests to predicted behaviour based on FE analysis ... 113
CHAPTER 1 INTRODUCTION
1.1. Analysis and design of transmission line structures
Transmission lines are important elements of the power systems of modern countries such as Canada. To maintain economic activities, transmission lines must be reliable. At the same time, the geometry of towers should be optimized to control the cost of these very long constructions.
Lattice steel towers are widely used all over the world to support conductors. The structural integrity of towers is a key factor in the reliability of a transmission system. To minimize the risk of disruption to the power supply as a result of tower failure, the reliability of towers needs to be properly evaluated.
A lattice transmission tower is a complex structure, and its design is characterized by the special requirements from electrical and structural points of view. The former determines the general shape of tower in terms of the height and the length of its cross-arms that carry the conductors.
The towers can also be classified according to their location in the line and the way the conductors are attached to the support regardless of the number of wires and circuits. Conductors can be either anchored to the supports or suspended depending on the configuration of the insulator chains. The tangent tower which is primarily designed to be located on straight lines, and normally uses suspension insulators. Typically, 90% of the transmission line is made of tangent towers with suspended supports in flat terrains. Thus, optimized design of tangent towers would minimize the total weight of the steel required in the project. If the line is deviated at a small angle, another type of tower, named angle tower, should be used. Angle towers are designed to resist the permanent transverse load induced from the deviation angle and light angle towers are typically in suspension. In some
conditions the angle of deviation in line can be about 30 to 60 degrees. Dead-end is another type of tower which can be utilized. In such towers, the conductor is discontinued and anchored on both sides of the tower, they are typically the strongest among all types of towers. The construction of each transmission line project is an engineering challenge, and, in certain conditions, the design of unusual towers such as river-crossing towers or highway crossing towers may be necessary. These types of tower are known as special towers.
1.2. Current design recommendations
There are different modelling assumptions in the standard method of analysis and design. There is not a general agreement on the way elements are modelled. One assumption is to consider members as linear structural elements which are connected to each other by frictionless joints acting like hinges. Thus, the tower is idealised as a space truss. Moreover, the influence of end bending moments in members is ignored in the structural analysis, and the leg members, which are continuous, are assumed to be hinged at nodal points. The other common way is to model the tower as a frame-truss type, so the main members can also transfer moments.
Current design recommendations address some of the above issues by making corrections on the slenderness ratio of members. In this regard, members are designed under compression or tension, and flexural effects in compression are applied as modifications to L/r ratio. Although such assumptions simplify the analysis and design procedures, they do not account for the real behaviour of the tower under loading or failure. For example, according to ECCS39 [1] the capacity of legs is derived from a basic buckling curve according to the equivalent slenderness ratio of member. The equivalent slenderness ratio is defined according to formation of bracing. ECCS39 [1] mentions that the effect of eccentricity of axial loads transmitted from the bracing to the leg members cannot be disregarded, but it does not present a method to include the eccentricity in design.
For the design of bracing members, ECCS39 [1] modifies the slenderness ratios to include the effects of framing eccentricity and the number of bolts at the connections, then the
designer should, again, refer to buckling curves and extract the brace capacity. Regarding the design of redundant members, the code recommends a percentage of load which is acting on main member. This percentage varies with the slenderness ratio of main member being stabilized by redundant.
1.3. Validation of design results
To validate the design results and to verify that the stresses in the members are in accordance with the analysis assumptions, a full-scale testing is typically required in the transmission line industry. The test is generally performed on the full constructed prototype of tower before fabrication.
Although the full-scale test provides a real insight to the designer about actual stress distribution, fit-up verification, behaviour of tower in deflected positions, and adequacy of connections, it is unable to confirm how the structure will react under dynamic loads, foundation settlement, and other loading or tower configuration than the one tested. This procedure is also very costly and time consuming.
1.4. Local buckling failure for angles
Slender steel sections are widely used in construction of different steel structures such as lattice structures for transmission line and telecommunication towers. Mainly two different types of instability can occur in the members. The first type is global buckling of member along its length which is based on member slenderness value and support conditions. Secondly, local buckling failure which is based on slenderness of the section and plate buckling behaviour. Both of these instabilities can be categorized as pure elastic or elasto-plastic buckling due to value of the stress developed in the member and slenderness values. In addition, the global buckling can be accompanied with local buckling which can make the analysis and design more complicated for these types of members. The global buckling behaviour is studied mostly in the literature and based on theoretical formulas, although the main challenge is evaluation of the member under elasto-plastic buckling and post-buckling capacity for local buckling.
All the steel design codes include equations to account for local buckling. In numerical models, local buckling can be reproduced using 2D shell or 3D elements. Non-linear numerical models have been developed in the last decades that can capture the complex behaviour of lattice structures up to failure. These models normally use beam elements which properly consider the global buckling and yielding of sections, but do not consider local buckling of angles due to geometrical limitations.
To address the local buckling, the ECCS39 [1] document adopts a reduction on the yielding stress of members, which is directly related to the b/t (width to thickness) ratio of sections. Other practical design codes such as ASCE 10-97 [2], Eurocode 3 [3] and CAN/CSA S16 [4] present similar recommendations with minor differences in coefficients for the equivalent slenderness. Unfortunately, the design standards provide the recommendations only for individual members and connections, so load distribution and reactions between members in the overall structure are not considered.
1.5. Connection behaviour
Leg members in towers are connected via lap spliced bolted joints and the bracing members are connected to legs or to intermediate gusset plates via single leg bolted joints. The assumption of hinged joint does not represent the real joint behaviour and modelling connections as rigid is also inadequate as compared to real joint behaviour. The exact modelling of real joint behaviour is very difficult but there are some simplified methods available such as modelling the connection by a small beam element or spring, keeping in mind that the non-linear behaviour of connection starts from the early stages of the loading up to failure load.
The properties that make the behaviour of bolted joints complex can be split in several phenomena: eccentricity, rotational stiffness, joint slippage and local yielding. The tower connections are different from ordinary steel connections in other types of steel structures. In lattice transmission towers, the members are mostly connected directly via their flange or through the gusset plates which provide a connection flexibility. The slippage effect should be included in the numerical model, because lattice towers are constructed by bearing type
connections instead of friction type ones. Also, the post slippage behaviour as hole elongation should be also considered in the connection behaviour. Therefore, an efficient method is needed to include this phenomenon in the numerical model of full scale structures [5].
1.6. Objectives if this study
Although advanced numerical models have been proposed, they are not used in design and have rarely been used as an intermediate step between the design output and full-scale testing, or as a tool to help understand test results. Difficulties to precisely represent the local buckling behaviour of angles and the non-linear behaviour of connections have notably restricted their use in practice.
The aim of this project is therefore to define a workable analysis strategy for transmission line towers that considers the local buckling of angles and the non-linear behaviour of connections. In this research, a modelling strategy is developed and its ability to predict the failure loads and failure modes of lattice transmission towers is investigated. Model calibrations are performed by using data from recent tests and results of experiments on tower parts.
1.7. Contribution to industry
New method to include local buckling
Currently, local buckling behaviour can only be modelled using 2D elements which is complicated and long for modelling and analysis. In this study a new method is proposed to incorporate the local buckling behaviour in the finite element model of structures using fiber beam element by means of developing a stress-strain behaviour curve of steel.
A model to incorporate the connection behaviour
At this moment, there is not a simplified and robust method to include the non-linear behaviour and slippage effect in the finite element modelling of towers. In this study, a method is provided to simply predict the full force-displacement curve of complex
connections. This curve can then be integrated as a non-linear spring element in global finite element models of lattice towers.
1.8. Organization of the dissertation
CHAPTER 2 covers a comprehensive review on the background and past studies conducted to investigate the non-linear behaviour of lattice towers and predict their failure modes due to local buckling and connection modelling.
CHAPTER 3 presents the modelling methods used in this research such as defining the geometry and FE meshing process. Also, methods to properly model connections and fibre beam elements are investigated.
CHAPTER 4 (1st article) proposes a method to incorporate the local buckling
behaviour in the finite element model of structures using fiber beam element by means of developing a stress-strain behaviour curve of steel. In order to take into account this phenomenon, the stress-strain material behaviour of the member is modified in the finite element model. A stress-strain curve formula is provided for each class-4 member based on the local buckling slenderness value (𝜆𝑝) of the member.
CHAPTER 5 (2nd article) a simple method is developed, which represents the
complete behaviour of bolted connections. The method can be implemented in an efficient beam element model of a complete lattice tower with the aim to evaluate precisely their complex structural behaviour. The method is easy to implement for a large number of complex joint configurations. Hence, the behaviour of multi-bolt connections is obtained from the behaviour of one-bolt joints.
CHAPTER 6 implements the features of chapter 5 for the modelling of joint behaviour in the modelling of a lattice tower section and compares the predictions of the proposed strategy with experimental results of a tower section.
CHAPTER 7 presents the summary of this study, conclusions, and recommendation for future research.
CHAPTER 2 LITERATURE REVIEW
2.1. Advanced modelling techniques of transmission towers
In conventional design, transmission towers are modelled as a truss element [6] and in most of the cases, secondary braces are omitted from the analysis since they are assumed as redundant elements to reduce unbraced length of main members. In the majority of cases the members are assumed with pinned connections, such that tower models can be analysed as a 3D truss.
Lu et al. [7] summarized the results of the literature pertaining to the research findings on lattice transmission towers and line systems. The authors discussed the structural modelling and failure mode prediction for connection joints, individual members as well as structural systems subjected to static and dynamic loads. They also elaborated on steel lattice transmission tower models, and the pros and cons of different numerical modelling techniques. One of the main findings of the study was the need for development of specific modelling methods for lattice transmission towers and line systems. Moreover, they pointed out that more research needs to be done on advanced FEM techniques with the ability of modelling the behaviour of bolted connections and predicting their failure mode.
Using the truss elements can affect the accuracy of analysis [8,9], as this type of element cannot consider the bending stresses and moments resulting from the real end connections. Lattice transmission towers are constructed using angle section members which are eccentrically connected. Therefore, secondary stresses arise due to eccentricity, joint rigidity and member continuity. One of the best known techniques is to utilize Beam-Column elements instead of Bar elements [10], which can incorporate most of the structural characteristics of lattice towers such as member continuity, asymmetric section properties, geometric and material non-linearity, as well as eccentric connections [11].
Another type of beam element that can be used to model the behaviour of angle section is the fibre beam element. In this case, the cross section of the beam column is subdivided into a finite number of elementary areas and the coordinates of the sub areas are determined with reference to the local principal coordinate system. The fibre beam element simplifies the number of degrees of freedom by assuming that Euler-Bernoulli hypothesis is respected (plane section before loading remains plane during loading). This type of element has the ability to provide the stresses in cross section [12].
In order to increase the accuracy of results and to perform more detailed analysis, some researchers used shell elements to model the members [5]. Shell elements allow calculating the stress and strain at every location of the tower and provide more detailing to modeled connections and eccentricities. A major drawback is the extensive time-consuming calculations with this type of element. Figure 2-1 shows the local buckling of a 220 kV bottom cross-arm in test and shell element modelling at failure.
Figure 2-1: Local Buckling of cross-arm member and shell element modelling members [5]
Utilization of solid elements to model towers is another possibility, however, due to high number of degrees of freedom and required elements, this type of modelling generally is not practical. Solid elements are mostly used in mechanical parts where shell elements cannot cover the exact behaviour of the model through its third dimension, for instance the stress analysis of the part along the thickness. Nevertheless, there might be cases where solid elements need to be used such as local buckling and failure modelling in connections.
To benefit from both 1D and 2D elements, a combination of these elements can be used in models [13]. Figure 2-2 shows an angle member which is mostly modelled by beam elements, but over a short length in the middle shell elements were used. By the aid of this combination, it is possible to take into account local buckling or local plasticisation in certain parts of the model.
Figure 2-2: Combination of Beam and Shell elements [13]
Despite the use of beam elements which causes a faster and more economical modelling and analysis process, researchers [13] concluded that the accuracy of combined modelling is not as high as full shell modelling.
Recently another method to model large structures was proposed: the multi-scale approach. In this method the local connections and joints are simulated using shell or plate elements to cover more details and failure modes. The other components of the structure are modelled using truss or beam elements. Then all of these different scale modelling are coupled to form a multi scale FE model. The issue of multi-scale modelling is coupling of mixed-dimensional elements into one analysis model. As well the modelling effort to create these models is more extensive than a full beam or truss 3D model. Wang et al.[14] , used this method on a physical model of a transmission line tower. Solid elements were used to model connections including angle sections. They reported that, this method has great advantages to improve accuracy of local responses for this type of structures.
Langlois et al. [15] reported the techniques available to model the behaviour of steel lattice towers and recent presented advancements in knowledge. In addition, they recommended that the modelling technique and hypotheses for numerical analysis of lattice towers need to be carefully selected, despite availability of several options for improving modelling of the complex behaviour of steel lattice towers. Moreover, they pointed out that any unnecessary complexity of model can increase model uncertainties and thus need to be avoided if possible. In addition, they noted that complex models need to be validated by simplified models or performing experimental tests. They have also suggested that inevitable tolerances involved in fabrication and erection could influence the tower behaviour, and thus need to be considered when interpreting the results.
2.2. Consideration of non-linear behaviour
Comparing data from full scale tests with predicted results of linear analysis indicates that the behaviour of transmission towers under complex loading cannot be estimated using the linear analysis [16]. Electric Power Research Institute (EPRI) [17] showed that almost 23% of towers tested, failed below the design loads and often at unexpected locations. Moreover, available test data confirmed considerable discrepancies between member forces computed from linear elastic analysis and the measured values from full scale tests. To overcome this issue different types of non-linearity are defined in analysis such as geometric non-linearity, material non-linearity, joint behaviour and bolt slippage [18].
By including the Geometric non-linearity in the analysis, the effect of continuing changes in geometry of model and large deformations can be covered as the applied load is increased. The material non-linearity accounts for the effect of combined stresses on the elasto-plastic behaviour of member cross section. In most of the cases the material is defined by a bi-linear stress-strain relation, although definition of full behaviour is possible [5].
2.3. Connections and bolt slippage
The assumption of hinged joint does not represent the real joint behaviour and modelling connections as rigid is also inadequate as compared to real joint behaviour. On the other hand, in practice, angle members in towers are usually loaded eccentrically through one leg;
which causes a biaxial bending in addition to axial load (Figure 2-3). The combined action of axial and bending forces may cause a plastic hinge in cross-section. Furthermore the bolted leg of the angle can undergo a local deformation under the bearing force of bolts, causing displacement and rotation in connection and shear lag in member [5].
Figure 2-3. Joint eccentricities [5]
The exact modelling of this behaviour is very difficult, however there are some simplified methods available in the literature to model the connection behaviour such as modelling the connection by a small beam element or spring, considering that the non-linear behaviour of connection starts from the early stages of the loading up to failure load. One issue to model the connections is the rotational stiffness. To take into account the joint stiffness, Kang [19] showed that the connection rigidity has a considerable effect on the ultimate horizontal load capacity. The rigid connection increases the buckling capacity, so assumption of connection rigidity must be realistic, otherwise the buckling capacity of the structure may be over or underestimated.
Joint slippage is another aspect of the joint behaviour which has received a lot of attention, although a full model to predict the behaviour for multi-bolt connections and how to define the parameters to include it in a 3D model is not provided. Most of the bolt holes are larger than bolts to provide erection tolerance which makes the slippage inevitable. The slippage
may happen gradually or at a specific level of loading and it depends on different parameters such as: structural loading, workmanship, the constitutive properties of the bolts and connections including, corrosion, nature of the faying surfaces and bolt torqueing. Figure 2-4 depicts a joint before and after slippage.
Figure 2-4. Bolted joint slippage effects [17]
Due to the lack of sufficiently reliable experimental data and the complexity of describing actual slippage in a real structure, very simplified models must be used. For example, in a study by Kitipornchai [20] the slippage is modelled as a random process. It was concluded that, joint slippage does not have a significant influence on the ultimate strength of the structure, but it has some effects on deflections. The slippage behaviour of some specific connections is studied by Ungkurapinan et al. [21], in this study the complete load-deformation curves of one to four bolt connections is reported (Figure 2-5). Unfortunately, there is not an extensive database of slippage parameters for angle member connections. A limited number of tests on specific angle sections and bolt arrangements could be found in the literature.
Figure 2-5. Load-Deformation diagram for joints [21]
Knight et al. [22] concluded that joint effects cause the premature failure in towers and they must be considered in analysis. Results showed a good correlation with experiments when joint effects are considered.
Comparing numerical predictions with experimental results, Jiang et al. [23] described the effect of joints on structural analysis model. The results of the study showed that in predicting the tower sway displacement, joint slippage must be considered, this would dramatically increase the predicted tower deformation but would not affect its failure load, failure mode and sequence.
Ahmed et al. [24] numerically investigated the behaviour of transmission towers under working loads using the FEM by integrating the actual slippage behaviour of bolted joints reported by Ungkurupanian [25] into their non-linear joint model. They concluded that the slippage of tower-leg joint and bracing member joints can adversely influence the overall tower performance by either decreasing the ultimate capacity or increasing the vertical and lateral deflections under working loads. However, they have used a special loading scenario to model the frost-heave effect by applying axial forces directly under one leg which is
different than regular tower self weight or conductor forces. They pointed out that the joint slippage can favourably influence the tower performance when subjected to frost-heave induced displacements. This conclusion was justified by stating that the corresponding axial forces induced in the member are much lower than those corresponding to rigid joints (i.e. with no slippage). Moreover, based on their analytical results they concluded that incorporating bolted-joint slippage in the analysis of towers is important and it will affect the accuracy of the model.
Zhang et al. [26] considered the joint slippage and developed a finite-element model to predict the structural response of lattice steel structures. The efficiency of the model was compared against experimental results and a conventional model. They have shown that their proposed model can accurately predicts the structural response of lattice steel structures with joint slippage. They concluded that considering joint slippage can increase the displacement of lattice structures because of reduction in stiffness. Nonetheless, they noted that considering the effect of joint slippage had minor effect on the load-carrying capacity and failure mode. They also pointed out that the conventional model crucially overestimates the stiffness, underestimating the lateral displacement of lattice structures, because the effect of joint slippage is not considered in this model.
Tower capacity is also affected by joint slippage due to geometric non-linearity (global P-Delta effects). Therefore, the legs may experience additional bending and it would reduce the ultimate load bearing capacity of tower.
At this moment, there are some methods to include the non-linear behaviour and slippage effect in the finite element modelling of towers. Although the main problem is, these methods are difficult and time consuming to be implemented and they are not efficient enough for a large array of connection configurations. Also, the stiffness of connections in these methods needs to be evaluated by prototype specimens before implementing them in the models.
2.4. Tower configuration and elements
Finite element modelling of towers is not only implemented to address the needs of full-scale tower testing and failure analysis for the industry. There are other types of research which also benefit from a well defined and accurate numerical model. For example, the modelling of corrosion in the tower members using finite element analysis. Also, optimisation of geometry of towers helps the industry to save resources on construction and erection time. An accurate numerical model can help to improve these kinds of needs as well. Since in these cases, an efficient and more reliable numerical model can help for the assessment of structural behaviour of the modified or proposed geometry.
Li et al. [27] studied, the safety of transmission tower structure under corrosion damages by developing a simplified method. This model took into consideration the safety status of a single component and was able to scrutinize the safety index of the structure. Li et al. [27] have also shown that their model could anticipate the trend of safety reduction of the structural components and the layer structures, considering the corrosion characteristic of the tower site. Their model could also distinguish the structural components that have reached the dangerous state using numerical analysis.
Transmission line towers are mass produced and the policy of configuration design for them is based on the minimum weight philosophy [28]. There are limited numbers of studies to monitor the effect of tower configuration on its structural behaviour. For example, Kang [19] reported that cross bracing configuration in secondary bracing instead of single bracing, enhances the ultimate load capacity of structure.
Different bracing configurations are used in the tower design, the efficiency of the bracing system is studied by Prasad Rao et al. [29]. Five towers are tested and modelled by finite element method. Results showed that failures of towers are caused by buckling of compression bracing and legs. The effect of non-triangulated hip bracing pattern and isolated hip bracing connected to elevation redundant in "K" and "X" braced panels on tower behaviour are considered. Non-triangulated hip bracing caused the geometric instability in
the structure and leaded to premature failure. The authors concluded that, detailing deficiencies may have a significant influence on the behaviour of the structure, and introduction of force fitting construction deficiencies, imperfections, bolt hole clearances, etc. is difficult to be modelled.
2.5. Tower capacity prediction
The main controlling parameter in designing angle members in compression is the slenderness ratio of the members. Generally, leg members are designed with slenderness ratios ranging from 40 to 60. In this range the compression capacity is approximately equal to net tension capacity of the member, and they may fail by inelastic buckling [30]. Bracing members are designed with slenderness ratio lower than 200 that generally varies from 60 to 170.
The British Standards Institute [31], the American Society of Civil Engineers [32] and the bureau of Indian Standards [33] specify essentially the same method for evaluating the compressive strength of angle members in lattice towers, accounting for the effects of residual stresses, imperfections and end conditions. This method modifies the effective slenderness ratio of the member, depending upon the location of the member in the tower and the eccentricity of connection.
The modelling strategy should consider these factors and parameters in order to help the engineer and to facilitate the design of different tower configurations. Moreover, despite the advantages of finite element modelling, its adoption to investigate the steel towers should be carefully evaluated [8].
The non-linear finite element analysis methods are effective for evaluating the strength of compression members and space structures. The beam element [34] which is used widely in this area is a 1D element with the ability of defining cross-section of the member from which the stresses can be obtained at different locations. Moreover, this method accounts for geometric and material non-linearity and it can predict the pre-ultimate behaviour and the limit loads. In this approach, loading is applied in small increments. At each loading level,
several iterations are performed to satisfy the equilibrium while the structural geometry is constantly updated. Consequently, the method can easily predict the buckling and post buckling behaviour of members as well as any instability.
Phill-Seung Lee [11] reported a comparison of large deformation analysis of a lattice steel tower with full scale tests. They tested two loading cases: (i) bending, (ii) flexure-torsion (Figure 2-6) and considered three connection models. Model-1, pin joints for one bolt connections and rigid joints for multi-bolt ones considering the eccentricity. Model-2, same as Model-1 but without connection eccentricity. Model-3, same as Model-1 but using all rigid connections.
Figure 2-6: Deformed shapes in the bending (left) and flexure-torsion (right) cases
[11]
In the bending case, the tower fails due to elastoplastic buckling, while in the flexure-torsion case, the tower collapses because of buckling of diagonal bracing members. In the bending case, the geometry and loading of tower is symmetric therefore the numerical model shows a symmetric failure, however the unknown imperfections caused the experimental results to have non-symmetric failure behaviour. The authors also mentioned that the
load-displacement curves have a good agreement in the linear elastic range, but they show high discrepancy when increasing the load (Figure 2-7 and Figure 2-8).
The following points were reported as the main reasons for the differences between the experimental and numerical results:
The movement of foundation in experiments which is not modelled in numerical analysis.
The presence of unknown geometric imperfections in the real tower.
The behaviour of connections is very hard to be accurately modeled since they are neither perfectly rigid nor perfectly pinned.
The effects of some local failures of the members cannot be predicted due to limitations of beam elements used in numerical model.
Some dynamic effects were inevitably involved in the experimental results while the numerical results were obtained using static analysis
Figure 2-8: Load-Displacement curves of flexure-torsion case [11]
Prasad et al. [35] reported that 32 out of 138 full-scale tower tests at the Structural Engineering Research centre [CSIR-SERC] experienced different type of premature failures. To study the failure in detail, three towers were modelled and analysed by NE-Nastran non-linear finite element software. The entire tower was modelled using beam-column elements, however, to capture more details the failed compression bracings were modelled as plate elements (Figure 2-9).
The test failure pattern coincides with analysis failure pattern for both beam and plate modelling. Figure 2-10 and Figure 2-11 show the comparison of failure loads for leg and bracing members calculated based on different codes, Finite element analysis and tests. As shown, ASCE standard [32] always predict higher values than the experimental values and non-linear finite element analysis predictions were 7-14% higher than test results.
Figure 2-10: Comparison of load capacities for leg members [35] (Note: FEM : Finite Element Model; ASCE [32]; BS [31]; IS [33])
Figure 2-11: Comparison of load capacities for bracing members [35] (Note: FEM : Finite Element Model; ASCE [32]; BS [31]; IS [33])
Another study was performed by the same researchers [29] on five prematurely failed towers. They encountered over prediction of strength by non-linear analysis and concluded that FE analysis is still not a fully reliable method to predict tower strength and tests are still necessary for this purpose. However, it is indicated that the non-linear analysis is essential for understanding the behaviour, load carrying capacity, design deficiencies, and instability in structure.
Bouchard [36] developed a simple numerical procedure to improve the load capacity and the failure mode prediction of lattice towers. The critical elastic buckling stress (Fe) is determined by a linear buckling analysis rather than by method of effective length. The effects of connection eccentricity and stiffness is also considered in the model. Then the resistance of the element is calculated by using the procedure and equations from the standards. The author analyzed several cases to consider the different configurations of steel angle. The proposed model was compared with the results of experimental tests on 12 towers as well as with the results of different design standards. The author showed that the proposed method can accurately predict the load capacity of lattice towers. It was also noted that the proposed procedure can improve the precision of the calculation of the ultimate capacity and the mode of failure of the lattice towers.
Sad Saoud et al. [37] proposed a numerical model using beam elements to predict the load-carrying capacity of steel lattice towers under static loading. Their model was developed using the finite element package Code_Aster. The steel lattice towers were modeled using spatial beam elements considering both geometric and material non-linearities. They investigated the effect of eccentricities and initial out-of-straightness defects on the buckling response of lattice towers. They have concluded that both the ultimate carrying capacity and failure mode of lattice structures can be accurately predicted if the eccentricities are considered in the model. They have also reported that the predicted failure mode was not in agreement with experimental results when only out-of-straightness defects were considered in the model. Moreover, they pointed that the rotational stiffness of one-bolt connections could influence the ultimate capacity of lattice towers, however more research was recommended to be done in this regard.
2.6. Residual stresses and geometrical imperfections
An experimental investigation on 26 hot-rolled steel angles was performed by Adluri et al. [38] to investigate the distribution of residual stresses across the cross section. It is concluded that the maximum residual stress in section does not exceed 0.25Fy. The researchers
recommended to include the residual stresses in analysis and design of angle sections specially for inelastic buckling.
Performing numerical analysis using the finite element software Code_Aster, Gravel et al. [39] investigated the influence of residual stresses on the global performance of lattice towers. The multi-fibre beam elements were incorporated to model the elastoplastic angle members, and discrete elements. They considered both the eccentricity and the rotational stiffness of connections in their model and compared the numerical predictions with the results. They concluded that stiffening the connections around the bolt axis (KRY) could improve the ultimate load capacity of the section by up to 10%. Moreover, they pointed out that the ultimate capacity of the tower section was decreased by around 5% when the residual stresses were taken into account. In addition, they deduced that consideration of residual stresses had no effect on the failure mode.
Chan et al. [40] used an equivalent imperfection factor to include the residual stresses in their proposed second-order codified analysis and design. The factor accounts for combined effects of initial curvatures, residual stresses and P-∆ effects.
Despite the well documented research about value and distribution of residual stresses, there is not a common method to model the residual stresses in lattice towers.
2.7. Local buckling of sections
Prasad Rao [35] stated that out of 138 full scale tests, 32 towers faced different types of premature failures. These demonstrate the limits of the design method used in practice. In order to further study the failure mechanism, three towers were modeled and analysed using NE-Nastran non-linear finite element software. The geometric and material non-linearity
were used to attain the behaviour and limit loads. All tower components were modelled as beam-column elements. However, to obtain further details, the failed compression bracing was modelled as plate elements. Experimentally observed failure pattern agreed with the results of non-linear finite element analysis for both beam and plate modelling. However, non-linear finite element analysis predicted 7 to 14 percent higher failure loads compared to experimental results.
This type of non-linear model intends to capture the intricate and non-linear behaviour of steel lattice structures. However, it is not a practical design method, since it does not comply with the design code equations or more advanced methods such as direct strength method (DSM) [41–43] which evaluates the resistance of sections based on elastic buckling behaviour. It offers a one-step numerical model to characterize the pre- and post-buckling behaviour of the structure. This type of model is effective as alternative or complement to full-scale tests to comprehend the behaviour and verify the resistance of lattice towers. It was shown by recent research that, depending on the intent of the modelling, the following characteristics of lattice behaviour might need to be considered: joint eccentricity [36,37], bolt slippage [44], and residual stresses [39]. It should however be noted that, in this type of model that normally simulates the elasto-plastic buckling of angle members, the possibility of local buckling of members is neglected.
Most recent research works in the modelling of angle members is either using beam elements or 2D shell elements. Angle sections may experience global or local buckling instability under compression load, depending on the slenderness and width to thickness ratio. Shell elements can signify the full three-dimensional behaviour of angle sections and specifically local buckling, with promising accuracy if the mesh is refined enough. However, the high number of members makes the use of shell elements impractical, especially in large and complex structures such as lattice towers. For example, Shan et al. [45], modeled angle members by non-linear plate elements. Both material and geometric non-linearities was considered in the study, however the analysis procedure was computer intensive thus time consuming. They determined that, 2D elements can only be used for small structures and as a research tool. This conclusion was also confirmed by other researchers [46].
In slender angle sections having large width-to-thickness ratio, the global buckling deformation is accompanied by the local buckling of leg plates [47]. Consequently, this effect should be incorporated in the finite element model of the structure. Lee and McClure [46] established a L-section beam finite element model for elastoplastic large deformation analysis. It is stated that, the beam element is 2.4 times more efficient than shell modelling when the member length is equal to 4 meters, in terms of the computational time.
The fiber beam element is a very efficient element type that is utilized with success to model angle sections. This element can effectively integrate the stress and yielding effects in the member. Kitipornchai et al. [12,48] performed an analysis using non-linear fiber elements of angle sections under axial and bending loads. Numerical studies have been performed on a number of structures where the angle members were modelled as fiber elements. A number of different examples were presented to validate the fiber element model in predicting the ultimate behaviour of imperfect angle columns. The results obtained from the finite element model were compared to the results of experimental tests on two pairs of angle trusses with web members.
Vieira et al. [49] and Carrera et al. [50] suggested a 1D beam element to model the buckling of beams using analytical formulations. The results agreed with finite element models. They also reported a number of limitations for capturing the local buckling behaviour. It was stated that, more experiments are necessary to extend the proposed method.
More computational methods to determine the buckling loads of thin-walled sections were studied. Huang et al. [51], established a mathematical formulation. The angle section was selected as an example to perform numerical analysis of elastic and inelastic buckling using finite element models. Results from beam and shell elements were compared with the theoretical results. They concluded that, since the mathematical solution of higher order differential equations is complex, different method should be considered for the members with complicated deflections.
2.8. Types of elements to model lattice towers
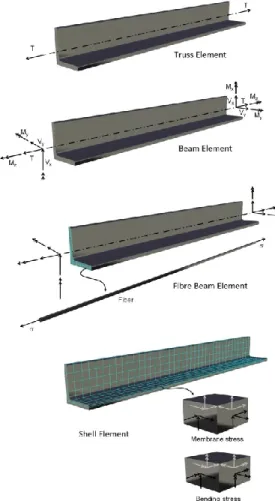
As it was discussed in the previous section, lattice towers can be modelled using 1D elements such as bars or beams, 2D elements such as plate or shell and even 3D elements such as solid [13]. Figure 2-12 shows an angle member which is modeled by Truss, Beam, Fibre beam and Shell elements. Figure 2-13 illustrates a part of a tower which is modelled by 1D beam and 2D shell elements.
Figure 2-12: An angle section modeled by Truss, Beam, Fibre beam and Shell elements
Figure 2-13: Modelling of a tower section by 1D and 2D elements
The meshing depends on the geometry of the model, failure mechanism and location. The existence of sharp edges or curved portions in the model requires a finer mesh. Moreover, a stress concentration field or local failure is expected in a specific part of the structure, a fine mesh should be defined in that location to achieve more accurate results. One should consider that fine meshing would lead to high number of elements and degrees of freedom in model, which may cause large matrices and excessive processing time and cost.
In this section different types of elements available in finite element software Code_Aster is investigated for tower modelling. The benefits and drawbacks of each element type is discussed as well. Since Code_Aster is a pure finite element solver without pre- and post-processing tools, in this study, SALOME package is used to create the geometry and meshing as well as post-processing the results.
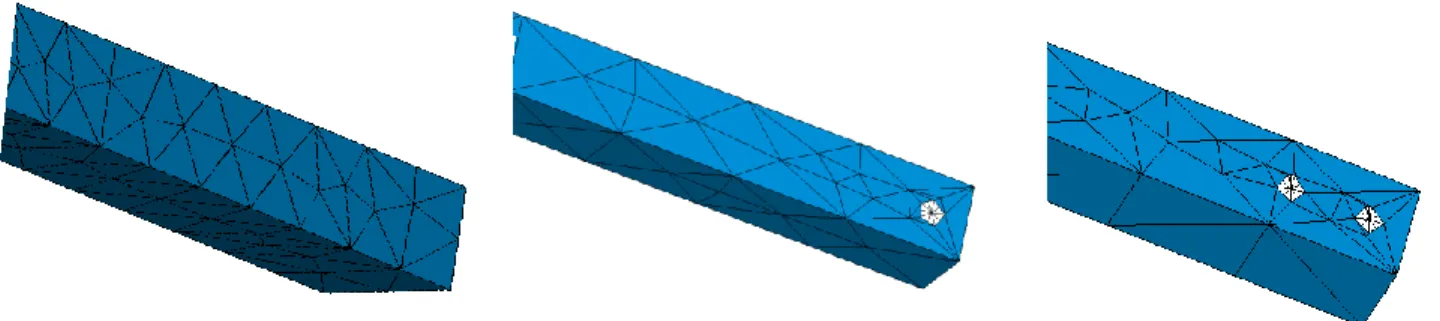
SALOME software has enhanced algorithms to perform complex meshing compounds and sub-meshing abilities (Figure 2-14 and Figure 2-15).
Figure 2-14: An angle member meshed in no, 1 and 2 end hole configuration
Figure 2-15: Buckling of an angle member inside the frame
SHELL3D, DKT and BEAM1D elements can be used to model the angle sections of towers. The selection of suitable element type for separate members is established by considering the member type, failure behaviour, required accuracy, loading condition and supports. To test and verify the modelling effort and calculation time needed in case of using plate elements, we have performed a preliminary study to model a full frame including a single brace in compression. As it is obvious from Figures 2-14 and 2-15, SALOME and Code-Aster are very powerful and capable of performing such analysis. Although the level of detail
and complexity of geometry and mesh as well as connection and bolt hole detailing, makes this option less practical compared to 1D beam elements.
There are two types of SHELL3D elements in the program Code_Aster, named QUAD9 and TRIA7 elements [Code_Aster Manual] as shown in Figure 2-16. Both elements have the ability to model large deflections and non-linear material, the former is a nine-node quadrangular element with eight edge nodes and one middle node, and the latter is a triangular seven-node element with six edge nodes and one middle node. Each edge nodes can support six displacement components (3 translations and 3 rotations), and the middle node only supports the rotational degrees of freedom. Another important characteristic of these elements is that they can be used on out of plane and uneven geometries.
Figure 2-16: SHELL 3D elements in Code-Aster (Left: TRIA7, Right: QUAD9)
DKT elements, also known as plate elements, can be defined as triangular and rectangular elements with three or four corner nodes. They cannot model the curved and uneven geometries, nor do they support the large deformation effects.
Two node beam elements can be used to model the members as 1D element. In the Code_Aster software, there is the possibility of defining fibre beam elements. In this kind of element, the beam section is divided into definite longitudinal fibres which provide stress and strain output in the beam section. The advantage of fibre beam element to ordinary
Timoshenko beam element is the output of stress and strain fields of any section along the member. As a major drawback, this type of element is not capable of simulating Von-Mises yield criteria in section or local buckling and instabilities. In Figure 2-17 a tower section has been modelled by fibre beam elements, and the maximum axial stress in members is depicted as the results of the analysis. This model corresponds to the geometry depicted in Figure 2-13. As expected, using fibre beam elements enabled us to have faster modeling and analysis time.
Figure 2-17: Tower modelling by fibre elements
The advantages of 1D element are the low computation time and simple geometric modelling. Below is the list of unavoidable drawbacks with such elements:
There is no possibility of modelling geometric imperfections in angle member flange. Local buckling or sectional distortion cannot be predicted by fibre element (Figure
2-17).
Calculation of yielding criteria (Von-mises or Tresca) and locating the yielding point are not possible.
Although the use of Shell elements fulfills the above disadvantages and adds accuracy to the model (Figure 2-18), shell models require rather a time-consuming calculation and
post-processing procedure due to high amount of degrees of freedom [45].
Figure 2-18: Local deformation of angles [45]
Existence of geometric imperfections and construction misalignments are another issue in construction of transmission line structures [11]. This effect causes a major gap between numerical and experimental results. In the case of 1D element, it is only possible to apply the overall member imperfection. If 2D elements are used, one would be able to consider the local imperfection of section flange. This method would have the ability to define different imperfection values for each member. Measuring this value for each member is not practical because individual investigation for imperfections is not possible in a complex massive tower in practice. Therefore, we can assume a constant imperfection value which is 1/1000 of member length according to codes [13]. Moreover, the towers are assembled part by part and generally there are some misalignment errors. These errors should be modelled on the geometry of tower body as well.
2.9. Mesh density
To achieve a reasonable mesh density, the accuracy of results and quantity of elements have to be balanced [5]. Depending on the internal forces of member, mesh density can be modified. For example, if the member experiences high bending moments, high density meshing should be used. The other effect is the load transfer at the location of joints and connections, which requires finer meshing [13].
Mesh density is also affected by the geometry of the model, such as curved edges and sharp corners. The number of elements should be increased to account for stress concentration at desired locations. Different mesh densities and distribution can be considered, to obtain accurate results and better convergence in non-linear analysis.
2.10. Conclusion
As it is evident from the literature, the accurate and efficient modelling of lattice towers still represent a major challenge. Different types of elements such as bars, beams, fiber beams, shells and solids can be considered to model the geometry. Each type has its own benefits and weaknesses based on the modelling effort and accuracy of results. The linear 1D elements are very efficient due to ease of modelling and less expensive calculation time. But these elements cannot provide some specific results such as stresses in the section, localized material yielding and not able to model the geometrical non-linearity like local buckling. Although fiber beam elements can address the problem of stress results in the section and at the same time the simplicity of a 1D element model, but these types of elements cannot consider the local buckling effect. The type of failure in member is a deciding factor to determine the element type. Among all failure models for angle members the most common failure modes are: (i) overall buckling, (ii) local buckling, (iii) plastic yielding in member. The element needed in the analysis should be able to reasonably represent these modes of failure.
Despite the aforementioned research effort, it is evident that there is a lack of a practical method for prediction of behaviour and strength of towers, or for prequalification process by numerical modelling.
Considering other analytical, numerical and experimental works in this field, the approach with fiber element is well adapted to analytically model the transmission tower structures but the main problem of using this type is the lack of ability to model local buckling.
Over the past decade, most research has emphasized that joint behaviour influences deflection most of the time, and failure mode and ultimate load in some cases. However, to
date, there is not a general method to predict the full connection behaviour for different bolt arrangements and include the non-linear behaviour containing slippage effect in the finite element modelling of towers.
CHAPTER 3 MODELLING STRATEGY
Based on the literature review, many modelling techniques have been used with various levels of accuracy. The research that has been conducted so far can be divided in the following categories:
Connection behaviour Type of element
Member failure modelling
Geometrical and material non-linearity Initial imperfections
Evaluation of the proposed strategy
In this chapter the proposed modelling strategy will be discussed in detail. The main focus will be on connection behaviour and local buckling failure modelling in members. These two aspects were shown to be particularly difficult to implement in a practical modelling method of complete lattice towers. The software Code_Aster is used for the analysis and SALOME graphic interface to model the structure and review the results. The procedure and properties of different experimental tests and verifications performed for this study will be addressed as well.
![Figure 2-1: Local Buckling of cross-arm member and shell element modelling members [5]](https://thumb-eu.123doks.com/thumbv2/123doknet/5572595.133643/28.918.125.736.575.777/figure-local-buckling-cross-member-element-modelling-members.webp)
![Figure 2-3. Joint eccentricities [5]](https://thumb-eu.123doks.com/thumbv2/123doknet/5572595.133643/31.918.295.665.264.568/figure-joint-eccentricities.webp)
![Figure 2-5. Load-Deformation diagram for joints [21]](https://thumb-eu.123doks.com/thumbv2/123doknet/5572595.133643/33.918.231.721.148.481/figure-load-deformation-diagram-for-joints.webp)
![Figure 2-18: Local deformation of angles [45]](https://thumb-eu.123doks.com/thumbv2/123doknet/5572595.133643/50.918.141.727.186.393/figure-local-deformation-of-angles.webp)
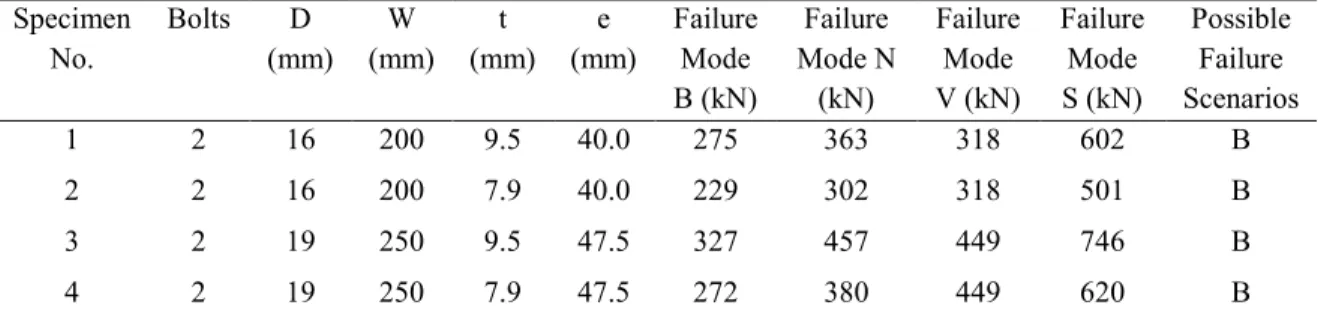
![Table 3-2 shows the experimental specimens and their configuration as well as predicted failure type according to CAN/CSA-S16 [4] design equations](https://thumb-eu.123doks.com/thumbv2/123doknet/5572595.133643/64.918.122.769.793.1059/table-experimental-specimens-configuration-predicted-failure-according-equations.webp)
![Figure 3-9: Reduced scale tower test [55]](https://thumb-eu.123doks.com/thumbv2/123doknet/5572595.133643/67.918.150.810.208.587/figure-reduced-scale-tower-test.webp)