Interfacial forces across ionic liquid solutions: Effect
of ion concentration and water domains
†Vahid Adibnia a,b, Marziye Mirbagheri a,b, Pierre-Luc Latreille a, Gregory De Crescenzo b, Dominic Rochefort c,, Xavier Banquy a*
a Faculty of Pharmacy, Université de Montréal, 2900 Édouard-Montpetit, Montreal, H3C 3J7,
Canada
b Department of Chemical Engineering, Ecole Polytechnique de Montreal, P.O. Box 6079,
Succursale Centre-Ville, Montreal, H3C 3A7, Canada
c Department of Chemistry, Université de Montréal, CP6128 Succursale Centre-Ville, Montreal,
H3C 3J7, Canada
† This manuscript is dedicated to the memory of Pr Israelachvili, an
exceptional surface scientist, and a beloved mentor
ABSTRACT. Using the surface force apparatus (SFA), the interaction forces between mica
surfaces across ionic liquid (IL) solutions are studied. The IL solutions, 1-hexyl-3-methylimidazolium bis-(trifluoromethylsulfonyl)imide in propylene carbonate solvent, are used at different concentrations to elucidate the ions conformation at the interface from the analysis of ** Author to whom any correspondence should be addressed
short-range structural forces. A direct correlation between the ion layer thickness at the interface and the IL molar fraction in the solution is observed, suggesting conformational changes relative to the ion packing density. In addition, effects of large microscopic and macroscopic water domains at the interface are investigated. The microscopic water domains induced significant adhesion at contact due to long range capillary forces, which are found to depend on solvent concentration. The macroscopic water domains cover entirely the interaction area, ensuring that the long range interfacial interactions occur entirely across aqueous electrolyte solution with dissolved IL ions as electrolyte. These results help elucidate the interfacial interactions in IL-charged solid interfaces with practical importance in green energy storage, catalysis and lubrication.
KEYWORDS. Ionic liquids; Electrical double layer; Ionic structures; Structural forces; Green
energy.
INTRODUCTION
Room-temperature ILs are purely composed of ions that are liquid under ambient conditions. The ions are typically large, asymmetric and polyatomic, and exhibit conformational and configuration flexibility1. Due to their chemical stability, wide electrochemical window, modest
intrinsic ionic conductivity, and low volatility, ILs have widespread applications in energy storage2,3, catalysis4, lubrication5,6 and as solvents7,8. In many of these applications, such as
batteries, electrochemical capacitors and solar cells, the interfacial interactions, including the ionic conformation at the solid interfaces, play a crucial role9,10, as charged solid surfaces are
The ionic dynamics at solid-liquid interface are typically discussed within the framework of the electrical double layer (EDL) close to the charged surface. The EDL comprises the compact Helmholtz ion layer adsorbed on the surface, accompanied by a diffuse layer with exponentially decaying ion concentration from the Helmholtz layer to the bulk liquid11. The
majority of the electrochemical, catalytic and charge transfer reactions occur in the Helmholtz layer, which depends on the surface charge and surface interactions with ions and solvent12.
Therefore, a detailed understanding of the ion-ion, ion-solvent and ion-interface interactions is required to control the IL performance at the interface. Indeed, the ionic structures at the interface of ILs and charged surfaces have been studied extensively, reporting layered structures of ions13–15. However, there is not a general consensus about the formation mechanism of these
structured layers, their exact molecular composition and the conformation of ions and/or molecules at the interface1,16. Although numerous studies, in particular those employing atomic
force microscopy (AFM) and SFA, have reported the existence of these ion layers at the “dry” ionic liquid-charged solid interface,15,17–20 some studies claim that at least a trace amount of water
is required for these layers to form12,16,21,22. According to these studies, no ion layering occurs
when the water content is as low as 200 ppm21.
Ionic liquids are hygroscopic and can absorb significant amount of water from their surrounding despite being hydrophobic molecules23, which makes it imperative to assess the
effect of water on IL applications. A lot of effort has been dedicated to understand the impact of water on different properties of ILs including the viscosity24, lubrication and friction25,26.
Molecular dynamics simulations at the IL-solid interfaces have shown that water molecules are greatly enriched near charged surfaces27–29, also affecting the ion conformation in the compact
structure close to the surface is formed due to the electrification of the mica surface resulting from the hydration and dissolution of native potassium ions on mica. They also claimed that in the absence of water, no ion layers are formed near the interface.
The present study aims at clarifying some aspects of IL-solid interfacial interactions and to provide more experimental data regarding their behavior in the presence of varying amounts of water. Therefore, using the SFA, we investigate the interfacial interactions at IL-mica interfaces in the presence of solvent molecules. First, using dry IL samples, the conformation of ions close to the surface is studied with respect to the solvent concentration. The goal here is to understand how the ion molar ratio at the interface affects the ion layers. Next, the effect of water on the interfacial interactions was studied. In the recent literature, the focus has been mainly on the effect of trace amounts of water at the IL-solid interface. However, due to the strong tendency of ILs to absorb water, especially in the presence of a solvent such as propylene carbonate (PC), the water quantity can be much higher in real applications. Therefore, we investigated the impact of water micro- and macro- domains at the surface by exposing ILs to a humid environment for a long period of time. We present direct observations of water micro- and macro-clustering at the interface and the corresponding force profiles of these interfaces. These results highlight important interactions between the interface, ions and solvent molecules, and how these tune the short and long range interaction forces.
MATERIALS AND METHODS
MaterialsThe 1-hexyl-3-methylimidazolium bis-(trifluoromethylsulfonyl)imide [C6C1im][Tf2N] 99.5%,
was purchased from Iolitec (Germany), and was used as received. Dilutions were made in propylene carbonate (PC, 99.7%), which was provided by Sigma-Aldrich (USA). All the IL solutions preparation steps were done in a glovebox under an argon atmosphere, and the solutions were stored in the glovebox before the experiments. The initial water contents of the IL and PC were measured using the Karl-Fisher titration method with a coulometric titrator (Mettler Toledo C30). The titrator was verified using Aqualine 1 mg/g water standards, which provided 980 ± 60 ppm of water. The PC and IL contained 26 ± 5 ppm and 75 ± 9 ppm of water, respectively. The average and uncertainty values were obtained from three measurements.
For the surface force measurements, grade 1 ruby-mica was obtained from S&J Trading (USA), phosphorus pentoxide (P2O5) was purchased from Sigma-Aldrich (USA), and ultrapure deionized
water was produced by a MilliQ water purification system (Millipore Corporation, USA).
Interfacial force measurements
Surface preparation. Back-silvered mica surfaces were prepared following the previously
reported standard procedure30,31. Briefly, hot-wire cut mica pieces with 1-3 µm thickness were
silver coated, with a final silver thickness of ≈ 50 nm. The mica pieces were then cut using a surgical blade to fit the surfaces of cylindrical glass discs (1 cm radius), and subsequently glued (silver down) to the discs using a UV-curable glue (Norland Optical Adhesive 83H, 1 hour UV exposure). The use of the UV glue prevented problems associated with glue dissolution in the PC
solvent. Two mica-coated discs were then mounted on a SFA in a cross-cylindrical geometry, which is geometrically equivalent to a sphere near a flat surface.
Reference contact point measurement. For measurement of the reference point (mica-mica
contact), the chamber, with the discs mounted on it, was first purged with argon for 30 min to completely dehumidify the surfaces and atmosphere. The surfaces were then approached by a DC motor, while the distance between the cylinders was monitored by white light multiple beam interferometry32. At contact, where the surfaces slightly deform, the position of the fringes of
equal chromatic order (FECO) was recorded using a spectrometer and a CCD camera.
Surface force measurement. Each IL sample was removed from the glovebox in a tightly
closed vial and transferred to the SFA darkroom. The solution was then quickly injected between the mica surfaces, while the SFA chamber was purged by argon continuously in the presence of dry P2O5. The IL solutions were left in the chamber for 1 hour before the measurements under
argon flow. The surfaces were approached at a constant speed of 0.3-1.5 nm s-1 (lower speeds
were used for high concentrations of IL). The normal force, F, profile was then recorded starting 300-400 nm away from the contact (where F = 0), by measuring the deflection of a spring cantilever supporting the lower surface. For each solution, the experiments were repeated at least twice. Next, P2O5 was replaced in the SFA chamber with a small beaker of water and the argon
flow was stopped, exposing the solutions to 100% relative humidity in a sealed chamber. The samples remained in this humid atmosphere for 14 hours, producing microscopic domains of condensed water at the interface. To produce macroscopic domains of water on the surface, some of the samples were kept in the humid environment for 24 hours. The force profiles were then recorded for water-exposed IL solutions following the same protocol above. During all experiments, the room temperature was 21°C.
RESULTS AND DISCUSSIONS
Ion layering and conformation in dry condition. The surface force measurements were
conducted on dry IL samples with varying IL fraction, ranging from 0% to 100%, as schematically shown in Figure 1a. The water content of < 100 ppm in these samples means that they have at least twice less water content than the “completely dry” IL samples reported by Cheng et al.21. Nevertheless, the final water content in the solutions after the experiment may be
slightly higher, thus closer to the values reported in the literature. In the SFA chamber, the continuous argon flow and the presence of P2O5 ensured that the samples were kept dry during
the experiments, which lasted 3-9 hours depending on the approach speed. Figure 1b shows an example of these force profiles measured across a 2 v% (≈ 0.5 mol%) IL solution in PC. Interaction forces here involve short-range structural forces, occurring between 0−4 nm separation distances, and long-range exponentially decaying electrostatic forces, occurring beyond this limit. The separation distance range of the structural forces presented here is consistent with the previous AFM and SFA studies on mainly pure IL samples1,19,33. Although the
electrostatic decay length of λ=5.1 nm is not exactly consistent with the Debye length of 1.2 nm expected for a 0.06 M salt solution, it fits the experimental range of λ=5−10 nm reported for mainly pure IL solutions1. Recent SFA studies by Smith et al. and Lee et al.
proposed that at such low IL concentrations (<0.6 M), the decay length in IL follows the Debye length34,35. However, a single data point for an IL solution at a concentration of 0.01 M (resulting
in a decay/Debye length of ≈ 3 nm), which was reported by Smith et al.35, was the basis of this
hypothesis in both studies. Noteworthy is that at 0.01 M, the Debye length is still larger than the ionic dimensions. However, in the concentration range of 0.05-0.6 M, where the Debye length is smaller than 1.5 nm, there is no data in the literature to support this hypothesis. This suggests
that understanding the long-range electrostatic interactions in ILs still requires further experimentation. Nevertheless, in this section, the focus is rather on the structural force and ion conformation close to the surface.
The interfacial forces arising from the packing of ion layers close to the negatively charged mica are shown in Figure 1c for various concentrations of the IL. Interestingly, these forces are also observed in pure PC, where there are no ions at the interface. This phenomenon has been previously reported for PC, relating the oscillations (observed as steps in the force runs) to the packing of the polar solvent molecules close to the charged surface36. Indeed, similarly to
the observations made by Smith et al.33, we found that the size of these steps in the force run is
consistent with the PC molecular dimensions of ≈ 0.55 nm. In the presence of IL ions, the force runs seem qualitatively similar, but the number of steps and their length are different. It is well known that ions close to a charged surface can form layered structures. However, in the presence of a solvent, these structures may be disturbed as the ions have to compete with solvent molecules for a position in the proximal layers. In a recent study on an IL with slightly smaller cation size ([C4C1Pyrr][Tf2N]), SFA measurements have shown that the step size remains
comparable to the solvent molecule dimensions up to 40 mol% IL concentration, and only above this concentration increase to 0.8 nm, due to the presence of IL ions at the interface33,37. This is
surprising, as cations are expected to have a higher propensity to form layers close to the mica surface compared to the solvent molecules even at low concentrations. In this section, by quantifying the structural layers formed by slightly larger cations ([C6C1im]+), we provide a
Figure 1 (a) Schematic representation of the SFA chamber for surface force measurements
across ILs. (b) A typical interaction force profile across a solution of 2 v% IL (0.06 M) in PC solvent during approach. The inset shows the short-range structural forces. The blue solid line shows the long-range electrostatic interaction exponential decay as F /R exp (−λ−1
(c) Structural forces in 0-100 % [C6C1im][Tf2N] solutions from two consecutive approach
force runs (red indicates the first run). The arrows indicate the steric interactions due to the ion layering.
The variation of the step length with respect to the IL molar fraction is shown in Figure 2a, with ionic and molecular dimensions33,38 of different species shown in Figure 2b.
Interestingly, we observed a qualitatively different variation in step length compared to the reported trend by Smith et al. for slightly smaller IL33. As the IL was introduced to the solution,
the step length decreased from 0.52±0.04 nm (the size of PC molecules) to 0.30±0.01 nm. With increase in the IL concentration from 0.5 to 100 mol%, the step size increased almost linearly to 0.62±0.26 for pure IL. It should be noted that the step size in pure IL sample varies between 0.4−1.1 nm. By comparing the step size values with respect to IL molar fraction, the observed trend can be explained by a change in ions conformation near the surface. First, in the presence of ions, the step lengths ( 0.30−1.1 nm) are always within the ionic dimensions ( 0.28−1.43 nm), suggesting that the steps are indeed related to the ions conformation at the interface. Next, at very low ionic concentrations, the cations seem to form multiatomic trains with their largest side lying flat at the interface (the step size of 0.30 nm for 0.5 mol% IL solution is comparable to the smallest dimension of the cation, i. e., 0.28 nm), as could be expected from the low number density of the ions at the interface (Figure 2c-i). By increasing the IL concentration, the step size increases due to inclusion of anions in the packed layers of ions and the conformational changes of the cations, which must occupy less area to accommodate more ions within the same space near the surface (Figure 2c-ii). At the highest concentration of ions, multiple ionic conformations exist, with most ions adopting a more vertical configuration in the ion layer due to the high ion packing density close to the charged surface (Figure 2c-iii). This leads to different step length values observed in the experiment. However, the large standard deviation in the data for pure IL may also be attributed to the extremely low approach speed used
for these sample (0.3 ± 0.2 nm s-1) because of their high viscosity. Similar variations in
conformation of ion layers at the IL-mica interface have been previously reported in the literature. Using AFM, high resolution X-ray interface scattering and
Figure 2. (a) The variation of the step length with the IL molar fraction. The solid blue line
shows the best linear fit to the experimental data. The data points and error bars indicate mean values and standard deviations of at least four step length measurements shown in Figure 1c. (b) Molecular dimensions of the IL cation, anion and the solvent molecules. The values are estimated from the van der Waals radii of the ions according to previous studies33,38. (c)
Schematic representation of ions conformation near the surface with respect to the concentration.
molecular dynamic simulations, cation-anion layering extending ≈ 3.5 nm into the bulk liquid has been reported, with an excess counterion concentration at the proximal layers and both parallel and perpendicular orientations of the ions at the subsequent ionic layers15,39. Our
complementary results here suggest that the conformation and composition transitions in the interfacial ion layers are directly related to the packing density of the ions, which is proportional to the ion molar fraction in the solution.
Effect of interfacial water domains on the surface forces across IL solutions
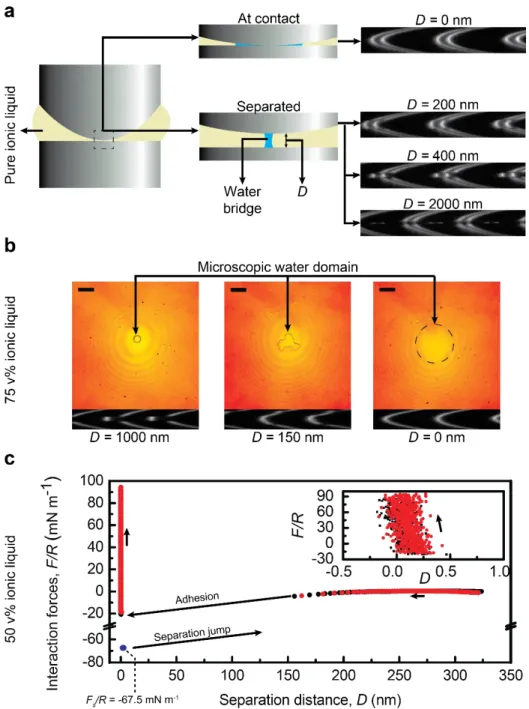
Microscopic water domains were introduced at the IL-mica interface, with IL concentrations of 0, 50, 75 and 100 v% in PC. These domains arise from condensation and clustering of water molecules at the interface. Figure 3a schematically shows the pure IL between the mica surfaces at different separation distances and real images of the corresponding interference fringes. At contact, D=0 nm, the water domain forms a large annulus around the contact point and the interference fringes appear continuous. However, as D increases, a water bridge is formed between the mica surfaces, and the fringes become discontinuous because of the variation in the refractive index of the medium between the mica surfaces (the water neck and bulk IL)40. A
similar behavior was observed with 75% IL solution (see Figure 3b). For this solution, the images of the water neck (volume ≈ 300 µm3) connecting the mica surfaces at different
separation distances were captured and shown with their associated interference fringes. This observation demonstrates that at high enough water concentrations, condensed water in ILs can form large domains at the interface. This observation, in addition to the SFA experiments on IL samples with trace amounts of water reported previously16,21, confirms molecular dynamic
simulation results, suggesting that at low water concentrations, water molecules bind strongly to IL ions individually, whereas at high water concentrations, water molecules interact less
favorably with IL and are more likely to form aggregates. As expected, the formation of the microscopic water bridges between the surfaces significantly influences the separation and approach force profiles due to the presence of capillary forces40. This was shown for the 50 v%
IL solution in Figure 3c, and for 100 % IL and PC solvent in Figures S1 and S2, respectively. Similar, but weaker, water-induced capillary forces in wet IL samples have been reported previously12,21, however, the present result is the first visual evidence of the phase separation at
the interface during SFA experiments. In addition, here, the effect of solvents on the interfacial interactions in wet IL samples was elucidated. During approach, no evidence of interfacial layering was observed (see Figure 3c, inset), even though the dissolved IL ions in the water meniscus with cation/anion solubility of 5 mM for [C6C1im][Tf2N]41 are expected to form ion
layers at the highly charged mica interface (the mica interface in the presence of water becomes highly charged due to hydration and dissolution of native potassium ions21). Our inability to
observe the structural forces in the force profile is attributed to the strong adhesion between the surfaces, which causes a sudden inward jump, as shown in Figure 3c, with potentially a subsequent quick removal of adsorbed layers. Moreover, by comparing the force profiles with various IL/solvent compositions, it was observed that the adhesion force increased from 24.1 mN m-1 for pure PC to 67.5 mN m-1 for 50 v% IL and to 144.6 mN m-1 for pure IL solution,
suggesting that the presence of PC in the water capillary bridge (with a high solubility of 20 w%
Figure 3. (a) Schematic representation of the microscopic water domains at the interface of mica-pure IL, and the change in the corresponding FECO with surface separation distance,
D . The discontinuous fringes indicate the biphasic nature of the liquid at the interface. (b)
Real time images of the deformation of the microscopic water domain at the interface of
mica-75 v% IL, and their corresponding interference fringes. At D=0 nm, the water domain
covers the area shown by the dashed circle. Scale bars correspond to 50 µm. (c) Force profile for 50 % IL solutions with microscopic water domains (refer to Figure S1 and S2 for similar force profiles for pure IL and pure PC). The inset magnifies the data at contact, indicating no structural force in this region. The separation point is indicated by the blue data point where Fs
Next, the effect of large macroscopic water domains on the force profile was investigated. Such large condensed water domains in PC solutions can form because of the dissolution of PC molecules in condensed water, as reported in the SFA experiments investigating an incompletely miscible PC-water system40. When a condensed water annulus is
formed between mica surfaces with PC in between, there is a substantial reduction in water activity in the annulus due to the presence of dissolved PC, causing the annulus to grow. In fact, a water annulus with a lateral diameter of a few millimeters was observed during SFA experiments on PC, which was exposed to humidity40. Here, a water annulus with a lateral
diameter of 900 µm in 2 and 20 v% IL solutions in PC was formed. In this case, evaluating the force profile and the images taken from the contact area suggests that the water domain is large enough so that any surface force measurement is effectively performed entirely in the water domain, irrespective of the properties of the media around water. However, the dissolution of PC and IL in the water domain still affects the force profile. For 20 v% IL solution, the images of the water domain, the corresponding interference fringes, and the force profile are shown in Figure 4. A similar force profile for the 2 v% IL solution is shown in Figure S3. The force profiles in the water domain resemble those of aqueous electrolyte solutions with two distinct signature transitions42: the van der Waals instability (2-3 nm jump in) followed by the long-range
electrostatic decay in the EDL diffuse layer. For both 2 and 20 v% IL solutions, the decay length in the water domain was 9.0 nm, suggesting a similar ionic concentration of 1.2 mM in water, estimated based on the Debye length calculations. Considering the 5 mM solubility of IL in water41, the obtained ionic concentration in the water annulus is of the same order of magnitude.
affected the solubility of IL in water. These results highlight that the exposure of IL to a humid environment for a long period of time can indeed alter the interfacial properties entirely.
Figure 4. (a) Schematic representation of the macroscopic water domains at the interface of
mica and 20 v% IL, and (b) the top view microscope images of the contact with the corresponding cross sectional FECO view. Surface separation decreases from left to right. Images (i) and (ii) show the fringes when surfaces are a few tens of µm away. Image (iii) shows the fringes when the surfaces are in contact and pressed manually using a micrometer. Close to contact, where the force runs are recorded, the water domain spreads and covers a large area on the surface, as shown in image (iii). Scale bars are 200 µm. (c) The compression force profile for dry 20 v% IL (black data points) versus the force profile in the macroscopic water domain surrounded by 20 v% IL (red data points). The red data points were recorded across the water domain shown in panel b(iii). The inset magnifies the short-range forces.
CONCLUSIONS
In this study, first the ionic structure at the interface of IL solutions and mica was investigated. By studying the structural forces at short distances ( 1−4 nm away from the solid surface), the dimensions of the ionic layers were related to the ions conformation and arrangement at the interface. At low ionic concentrations, the cations occupied the surface sites by forming multiatomic trains. As the concentration increased, the ion conformation changed to a more vertical conformation to accommodate more ions near the surface, gradually increasing the layer thickness with the ion concentration. Next, microscopic and macroscopic water domains at IL-mica interface were found to change the interfacial interactions significantly. The microscopic domains induced significant adhesion by capillary forces, with magnitude inversely proportional to the solvent concentration. In the presence of macroscopic water domains, the interfacial interactions occurred entirely across water and the force profile resembled that of an aqueous electrolyte solution because of the partial solubility of IL in water. The results presented here provide new insights into the interfacial interactions involving IL solutions. This includes the conformation and structure of ions near the interface with respect to solvent molecules as well as interfacial interactions in a practical case where a large amount of water is present at the interface.
ASSOCIATED CONTENT
Supporting Information.
Complementary figures are available in the SI. This material is available free of charge at http://pubs.acs.org.
AUTHOR INFORMATION
Corresponding Author
*E-mail: [email protected] (X.B.) ; Tel: +1 (514) 343-2470
Notes
The authors declare no competing financial interest.
ACKNOWLEDGMENTS
This research was undertaken thanks, in part, to funding from the Canada First Research Excellence Fund through the TransMedTech Institute. V. A. and M. M. appreciate the financial support from the Fonds de Recherche du Québec (FRQ-NT). XB and GDC acknowledges support from NSERC (Discovery). This research was also partially funded by the Canada Research Chair program (XB).
REFERENCES
(1) Gebbie, M. A.; Smith, A. M.; Dobbs, H. A.; Lee, A. A.; Warr, G. G.; Banquy, X.; Valtiner, M.; Rutland, M. W.; Israelachvili, J. N.; Perkin, S.; et al. Long Range Electrostatic Forces in Ionic Liquids. Chem. Commun. 2017, 53, 1214–1224.
(2) Xu, K. Electrolytes and Interphases in Li-Ion Batteries and Beyond. Chem. Rev. 2014,
114, 11503–11618.
(3) Watanabe, M.; Thomas, M. L.; Zhang, S.; Ueno, K.; Yasuda, T.; Dokko, K. Application of Ionic Liquids to Energy Storage and Conversion Materials and Devices. Chem. Rev.
(4) Olivier-Bourbigou, H.; Magna, L.; Morvan, D. Ionic Liquids and Catalysis: Recent Progress from Knowledge to Applications. Appl. Catal. A Gen. 2010, 373, 1–56.
(5) Li, H.; Rutland, M. W.; Atkin, R. Ionic Liquid Lubrication: Influence of Ion Structure, Surface Potential and Sliding Velocity. Phys. Chem. Chem. Phys. 2013, 15, 14616–14623. (6) Zhou, Y.; Qu, J. Ionic Liquids as Lubricant Additives: A Review. ACS Appl. Mater.
Interfaces 2017, 9, 3209–3222.
(7) Rogers, R. D.; Seddon, K. R. Ionic Liquids--Solvents of the Future? Science (80-. ). 2003,
302, 792 LP – 793.
(8) Welton, T. Room-Temperature Ionic Liquids. Solvents for Synthesis and Catalysis. Chem.
Rev. 1999, 99, 2071–2084.
(9) Hayes, R.; Warr, G. G.; Atkin, R. Structure and Nanostructure in Ionic Liquids. Chem.
Rev. 2015, 115, 6357–6426.
(10) Fedorov, M. V.; Kornyshev, A. A. Ionic Liquids at Electrified Interfaces. Chem. Rev.
2014, 114, 2978–3036.
(11) Gebbie, M. A.; Valtiner, M.; Banquy, X.; Fox, E. T.; Henderson, W. A.; Israelachvili, J. N. Ionic Liquids Behave as Dilute Electrolyte Solutions. Proc. Natl. Acad. Sci. 2013, 110, 9674–9679.
(12) Cheng, H. W.; Stock, P.; Moeremans, B.; Baimpos, T.; Banquy, X.; Renner, F. U.; Valtiner, M. Characterizing the Influence of Water on Charging and Layering at Electrified Ionic-Liquid/Solid Interfaces. Adv. Mater. Interfaces 2015, 2, 1–9.
(13) Mezger, M.; Ocko, B. M.; Reichert, H.; Deutsch, M. Surface Layering and Melting in an Ionic Liquid Studied by Resonant Soft X-Ray Reflectivity. Proc. Natl. Acad. Sci. 2013,
(14) Mezger, M.; Shiröder, H.; Reichert, H.; Schramm, S.; Okasinski, J. S.; Schöder, S.; Honkimäki, V.; Deutsch, M.; Ocko, B. M.; Ralston, J.; et al. Molecular Layering of Fluorinated. Science (80-. ). 2008, 322, 424–428.
(15) Black, J. M.; Walters, D.; Labuda, A.; Feng, G.; Hillesheim, P. C.; Dai, S.; Cummings, P. T.; Kalinin, S. V.; Proksch, R.; Balke, N. Bias-Dependent Molecular-Level Structure of Electrical Double Layer in Ionic Liquid on Graphite. Nano Lett. 2013, 13, 5954–5960. (16) Gong, X.; Kozbial, A.; Li, L. What Causes Extended Layering of Ionic Liquids on the
Mica Surface? Chem. Sci. 2015, 6, 3478–3482.
(17) Espinosa-Marzal, R. M.; Arcifa, A.; Rossi, A.; Spencer, N. D. Microslips to “Avalanches” in Confined, Molecular Layers of Ionic Liquids. J. Phys. Chem. Lett. 2014, 5, 179–184. (18) Perkin, S. Ionic Liquids in Confined Geometries. Phys. Chem. Chem. Phys. 2012, 14,
5052–5062.
(19) Atkin, R.; Warr, G. G. Structure in Confined Room-Temperature Ionic Liquids. J. Phys.
Chem. C 2007, 111, 5162–5168.
(20) Smith, A. M.; Lovelock, K. R. J.; Gosvami, N. N.; Licence, P.; Dolan, A.; Welton, T.; Perkin, S. Monolayer to Bilayer Structural Transition in Confined Pyrrolidinium-Based Ionic Liquids. J. Phys. Chem. Lett. 2013, 4, 378–382.
(21) Cheng, H. W.; Dienemann, J. N.; Stock, P.; Merola, C.; Chen, Y. J.; Valtiner, M. The Effect of Water and Confinement on Self-Assembly of Imidazolium Based Ionic Liquids at Mica Interfaces. Sci. Rep. 2016, 6, 1–9.
(22) Cheng, H. W.; Weiss, H.; Stock, P.; Chen, Y. J.; Reinecke, C. R.; Dienemann, J. N.; Mezger, M.; Valtiner, M. Effect of Concentration on the Interfacial and Bulk Structure of Ionic Liquids in Aqueous Solution. Langmuir 2018, 34, 2637–2646.
(23) Ionic Liquids in Synthesis, Second Edition; Wasserscheid, P., Welton, T., Eds.; Wiley Online Library, 2007.
(24) Kelkar, M. S.; Maginn, E. J. Effect of Temperature and Water Content on the Shear Viscosity of the Ionic Liquid 1-Ethyl-3-Methylimidazolium Bis(Trifluoromethanesulfonyl)Imide as Studied by Atomistic Simulations. J. Phys. Chem.
B 2007, 111, 4867–4876.
(25) Fajardo, O. Y.; Bresme, F.; Kornyshev, A. A.; Urbakh, M. Water in Ionic Liquid Lubricants: Friend and Foe. ACS Nano 2017, 11, 6825–6831.
(26) Arcifa, A.; Rossi, A.; Espinosa-Marzal, R. M.; Spencer, N. D. Environmental Influence on the Surface Chemistry of Ionic-Liquid-Mediated Lubrication in a Silica/Silicon Tribopair.
J. Phys. Chem. C 2014, 118, 29389–29400.
(27) Feng, G.; Jiang, X.; Qiao, R.; Kornyshev, A. a. Water in Ionic Liquids at Electri Fi Ed Interfaces : The Anatomy Of. ACS Nano 2014, 8, 11685–11694.
(28) Zhang, H.; Zhu, M.; Zhao, W.; Li, S.; Feng, G. Molecular Dynamics Study of Room Temperature Ionic Liquids with Water at Mica Surface. Green Energy Environ. 2018, 3, 120–128.
(29) Zhang, F.; Fang, C.; Qiao, R. Effects of Water on Mica-Ionic Liquid Interfaces. J. Phys.
Chem. C 2018, 122, 9035–9045.
(30) Israelachvili, J. N.; Alcantar, N. A.; Maeda, N.; Mates, T. E.; Ruths, M. Preparing Contamination-Free Mica Substrates for Surface Characterization, Force Measurements, and Imaging. Langmuir 2004, 20, 3616–3622.
(31) Banquy, X.; Lee, D. W.; Das, S.; Hogan, J.; Israelachvili, J. N. Shear-Induced Aggregation of Mammalian Synovial Fluid Components under Boundary Lubrication
Conditions. Adv. Funct. Mater. 2014, 24, 3152–3161.
(32) Israelachvili, J. N. Thin Film Studies Using Multiple-Beam Interferometry. J. Colloid
Interface Sci. 1973, 44, 259–272.
(33) Smith, A. M.; Lee, A. A.; Perkin, S. Switching the Structural Force in Ionic Liquid-Solvent Mixtures by Varying Composition. Phys. Rev. Lett. 2017, 118, 1–5.
(34) Lee, A. A.; Perez-Martinez, C. S.; Smith, A. M.; Perkin, S. Scaling Analysis of the Screening Length in Concentrated Electrolytes. Phys. Rev. Lett. 2017, 119, 1–5.
(35) Smith, A. M.; Lee, A. A.; Perkin, S. The Electrostatic Screening Length in Concentrated Electrolytes Increases with Concentration. J. Phys. Chem. Lett. 2016, 7, 2157–2163. (36) Christenson, H. K.; Horn, R. G. Direct Measurement of the Force between Solid Surfaces
in a Polar Liquid. Chem. Phys. Lett. 1983, 98, 45–48.
(37) Coles, S. W.; Smith, A. M.; Fedorov, M. V.; Hausen, F.; Perkin, S. Interfacial Structure and Structural Forces in Mixtures of Ionic Liquid with a Polar Solvent. Faraday Discuss.
2018, 206, 427–442.
(38) Perkin, S.; Crowhurst, L.; Niedermeyer, H.; Welton, T.; Smith, A. M.; Gosvami, N. N. Self-Assembly in the Electrical Double Layer of Ionic Liquids. Chem. Commun. 2011, 47, 6572–6574.
(39) Zhou, H.; Rouha, M.; Feng, G.; Lee, S. S.; Docherty, H.; Fenter, P.; Cummings, P. T.; Fulvio, P. F.; Dai, S.; McDonough, J.; et al. Nanoscale Perturbations of Room Temperature Ionic Liquid Structure at Charged and Uncharged Interfaces. ACS Nano
2012, 6, 9818–9827.
(40) Christenson, H. K. Capillary Condensation in Systems of Immiscible Liquids. J. Colloid
(41) Mazan, V.; Billard, I.; Papaiconomou, N. Experimental Connections between Aqueous-Aqueous and Aqueous-Aqueous-Ionic Liquid Biphasic Systems. RSC Adv. 2014, 4, 13371–13384. (42) Espinosa-Marzal, R. M.; Drobek, T.; Balmer, T.; Heuberger, M. P. Hydrated-Ion Ordering