HAL Id: hal-01254284
https://hal-mines-paristech.archives-ouvertes.fr/hal-01254284
Submitted on 3 Jan 2017
HAL is a multi-disciplinary open access archive for the deposit and dissemination of sci-entific research documents, whether they are pub-lished or not. The documents may come from teaching and research institutions in France or abroad, or from public or private research centers.
L’archive ouverte pluridisciplinaire HAL, est destinée au dépôt et à la diffusion de documents scientifiques de niveau recherche, publiés ou non, émanant des établissements d’enseignement et de recherche français ou étrangers, des laboratoires publics ou privés.
using Geometrical and Morphological Attribute-based
Operators
Andrés Serna, Beatriz Marcotegui, Jorge Hernández
To cite this version:
Andrés Serna, Beatriz Marcotegui, Jorge Hernández. Segmentation of Façades from Urban 3D Point Clouds using Geometrical and Morphological Attribute-based Operators. ISPRS International Journal of Geo-Information, MDPI, 2016, ISPRS International Journal of Geo-Information, 5 (1), �10.3390/ijgi5010006�. �hal-01254284�
ISPRS International Journal of
Geo-Information
ISSN 2220-9964 www.mdpi.com/journal/ijgi Article
Segmentation of Façades from Urban 3D Point Clouds using
Geometrical and Morphological Attribute-based Operators
Andrés Serna*, Beatriz Marcotegui and Jorge Hernández
MINES ParisTech, CMM–Centre de Morphologie Mathématique, 35 rue St Honoré 77305-Fontainebleau-CEDEX, France
* Authors to whom correspondence should be addressed; [email protected] Received: xx / Accepted: xx / Published: xx
Abstract: 3D building segmentation is an important research issue in the remote sensing community with relevant applications to urban modeling, cloud-to-cloud and cloud-to-model registration, 3D cartography, virtual reality, cultural heritage documentation, among others. In this paper, we propose automatic, parametric and robust approaches to segment façades from 3D point clouds. Processing is carried out using elevation images and 3D decomposition, and the final result can be reprojected onto the 3D point cloud for visualization or evaluation purposes. Our methods are based on geometrical and geodesic constraints. Parameters are related to urban and architectural constraints. Thus, they can be set up to manage façades of any height, length and elongation. We propose two methods based on façade marker extraction and a third method without markers based on the maximal elongation image. This work is developed in the framework of TerraMobilita project [1]. The performance of our methods is proved in our experiments on TerraMobilita databases using 2D and 3D ground truth annotations.
Keywords: 3D urban analysis; laser scanning; segmentation; façades; mathematical morphology; attribute-based operators; geodesic elongation.
1. Introduction
Building segmentation can be defined as the process of separating buildings from other objects such as natural and artificial ground, vegetation and urban objects. First researches on automatic building extraction began in the 80s. They used aerial imagery and focused on the extraction of high-level 2D and 3D primitives from stereo images. One of the main drawbacks of these methods is that some false
positives need to be filtered out since some linear primitives may not correspond to meaningful structures. In computer vision, elevation images were introduced as data structures allowing direct access to 3D geometric features. First elevation images were mostly acquired from small objects and scenes, using active systems. During the 90s, aerial laser scanning (ALS) became widely available so elevation images of huge scenes and cities became possible. Accuracy and point density of those systems are in constant progress. More recently, new acquisition systems such as terrestrial (TLS) and mobile laser scanning (MLS) have been developed, adding not only greater geometrical accuracy and extremely high density, but also façade scans, not visible from ALS [2].
Although the processing of 3D urban data has been underway for many years, façade segmentation is still an open problem. Several contributions on this domain are proposed in this paper.
Our processing assumes that ground has been already segmented. In our works we have used the approach already published in [3,4]. Once the ground is segmented, all remaining structures are considered as façades and objects. Using TLS and MLS data, only building front parts are visible, as shown in Figure1. It is noteworthy that façades constitute the highest and longest vertical entities in the urban scene.
This work has been developed in the framework of TerraMobilita project [1] and is organized as follows. Section2reviews related works in the state of the art. Sections 4and5introduce two different approaches to segment façades: with and without markers, respectively. Section 6describes a method to segment city blocks taking advantage of the façade segmentation result. Finally, Section8concludes this work.
2. Related work
Goulette et al. [5] develop a MLS system, called LARA-3D, that acquires and segments in real-time ground, façades and objects. Ground and façades are detected fitting horizontal and vertical planes, then remaining points are considered as objects. In a similar way, Boulaassal et al. [6] segment building façades using the RANSAC algorithm on TLS data. In general, approaches based on plane extraction are proved to be simple, fast and useful as input for high-level approaches devoted to create accurate geometric models. However, their main drawback is that plane extraction may fail when ground and façades are not flat enough. Moreover, façades may be over- and under-segmented due to architectural details such as balconies.
Bab-Hadiashar and Gheissari [7] propose a method to segment planar and curved surfaces in range images. Their method consists in selecting the appropriate parametric model that minimizes strain energy of fitted surfaces. The authors applied their methodology to indoor range images of the University of South Florida (USF) database [8]. Several works on the parametric model fitting problem can be found in the literature [9–13]. Those works can be extended in order to segment surfaces such as ground and façades on elevation images. Their main drawbacks are that they require a model estimation which can be different for different images, are time consuming due to minimization procedures and may produce under- and over-segmentation.
Demantke et al. [14] propose a method to adapt 3D spherical neighborhoods based on local features. Radius selection is carried out optimizing local entropy. Then, dimensionality features are calculated.
(a) Point cloud colored by the Z coordinate (b) Point cloud colored by the Intensity
(c) Point cloud colored by the Z coordinate (d) Point cloud colored by the Intensity
Figure 1. 3D point clouds from two test sites in rue d’Assas in Paris, France. Stereopolis II, IGN c . Note that façades constitute the highest and longest vertical entities in the urban scene.
These features can be useful to classify 1D structures such as pole-like objects, 2D structures such as ground or façades, and 3D volumetric structures such as trees and urban objects.
Hernández and Marcotegui [3] assume that façades on the same street are aligned, which is verified in their Paris-rue-Soufflot database. They use the Hough transform to find façade directions. Then, they analyze the height of each profile in order to detect façades and city blocks. Hammoudi [15] presents a similar technique based on the Progressive Probabilistic Hough Transform in order to detect walls and windows. He assumes that building façades are mainly vertical, so it is possible to generate an accumulation image to compute the number of points projected on each pixel.
Other works aiming at segmenting façades are available in the literature [16–21]. Additionally, color images can be used in order to enrich façade segmentations. For example, several works available
in the literature use color images to segment façades keeping architectural details such as balconies and windows. Then, those results are used to colorize 3D point clouds providing a realistic rendering [22–26].
In general, methods based on planar extraction, Hough transform and model fitting are not generic enough since façades can have different shapes and contain different architectural details. Moreover, the problem of objects touching the façade, such as urban furniture or parked motorcycles, is rarely analyzed in the literature. In this paper, we address these problems proposing methods based on geometric and elongation features computed on projection images. These methods are robust to extract façades of several shapes and correctly separate objects touching the façade.
3. Projection Images
Once a 3D point cloud is acquired, a suitable data structure is not only required to inspect and visualize the information quality, but also to process it conveniently. Point clouds are delivered as long lists of (x, y, z) coordinates, possibly with attributes such as intensity and color. Points are usually listed in scan line order, which is not suitable for efficient processing. For example in a (x, y, z) list, it is not possible to quickly determine the neighbors of a point within some radius. Data structures such as projection images, Delaunay triangulation, octrees and k-D trees allow this kind of processing. Choosing the proper data structure is application dependent, moreover it is possible to combine some of them to get better results in specific tasks such as visualization, filtering, segmentation and classification [2].
As aforementioned, our method is based on projection images. 3D point clouds are projected to elevation images because they are convenient structures to visualize and to process data. One can utilize all the large collection of existing image processing tools, in particular mathematical morphology [27,
28]. Additionally, images can be processed quickly, implicitly define neighborhood relationships and require less memory than 3D data. In general, the idea of deriving elevation images from 3D point clouds is not new. Nevertheless, the development of accurate and fast urban analysis algorithms is still an open problem.
Elevation images are 2.5D structures that contain depth information at each pixel. They are generated by an orthographic projection to a virtual camera plane, i.e. the depth is the distance from each 3D point to the projection plane. The camera model P is a projective transformation from R3 → N2, and it can
be decomposed in three sequential transformations as follows:
Definition 1. Let M = (X, Y, Z) be a 3D point in R3 andm = (u, v) a point in the image space N2. The camera modelP is defined as the successive transformations:
(X, Y, Z)−→(XT c, Yc, Zc) P
[T ] = "
[Rot] t 0T 1
#
Rot: Rotation matrix t: translation vector [P ] = 1 0 0 0 0 1 0 0 0 0 f oc−1 0
f oc: focal length
[A] = kx 0 cx 0 ky cy 0 0 1
where,(cx, cy) is the intersection point between the optical axis and the image plane, (kx, ky) are the
number of pixels per unit of length,Rwis the real world coordinate system,Rcis the camera coordinate
system with origin in the optical center, and Rr is the projection plane coordinate system. The virtual
camera is chosen such that:
• It is located on the horizontal plane with normal vector −→n = (0, 0, 1) and crossing the lowest point(0, 0, zmin). Therefore, the Rotation matrix [Rot] is equal to the identity.
• The point cloud and the projection plane are centered on the gravity center of the point cloud. Thus, the translation vectort is equal to the gravity center, and the intersection point (cx, cy)=(0,0).
• The projection is orthographic. Thus, the projection axis is orthogonal to the projection plane and the projection center is located at the infinity. It means,f oc = ∞, x = Xcandy = Yc.
According to these assumptions, the number of pixels per unit of length is the only free parameter. In order to simplify this selection, we assume kx = ky = k. It has to be carefully chosen. On the one
hand, if k is too small, fine details are not preserved because too many points would be projected on the same pixel. On the other hand, too large k implies connectivity problems and large image sizes, which implies higher computational time that would no longer justify the use of elevation images instead of 3D point clouds. This parameter is the most critical in terms of quality versus processing time. In our experiments, we have chosen k = 5pix/m thanks to a priori knowledge about point cloud density.
During projection, several points can be projected to the same pixel. Thus, four elevation images are defined:
• Maximal elevation image (fmax), or simply elevation image, stores the maximal depth among all
projected points on the same pixel.
• Minimal elevation image (fmin), stores the minimal depth among all projected points on the same
pixel.
• Accumulation image (facc), stores the number of points projected on each pixel.
In general, processing steps are performed combining these images and resulting image can be reprojected to the 3D point cloud. Figure 2 presents the 3D point clouds and the elevation images for our two Paris test sites.
(a) Rue d’Assas: point cloud (b) Rue d’Assas: elevation image
Figure 2. 3D point clouds and elevation images for a test site in Paris, France. Data acquired by Stereopolis II, IGN c France.
Image projections imply a reduction in the amount of data to be processed. Therefore, processing 2.5D images using image processing techniques is much faster than process the 3D points directly. Moreover, neighborhood relationships are given in images without any additional computation. In order to avoid connectivity problems due to occlusions or low dense point clouds, an interpolation may be applied. This topic is out of the scope of this paper. For further details on interpolation of elevation images, the reader is encouraged to refer to Serna and Marcotegui [4], Hernández and Marcotegui [29]. 4. Façade segmentation using markers
In order to segment façades, we propose a marker-based method using geometrical constraints. After marker extraction, a reconstruction is applied in order to get the entire façade. Let us explain first the façade marker extraction and later in Section4.2the reconstruction process.
4.1. Façade marker extraction
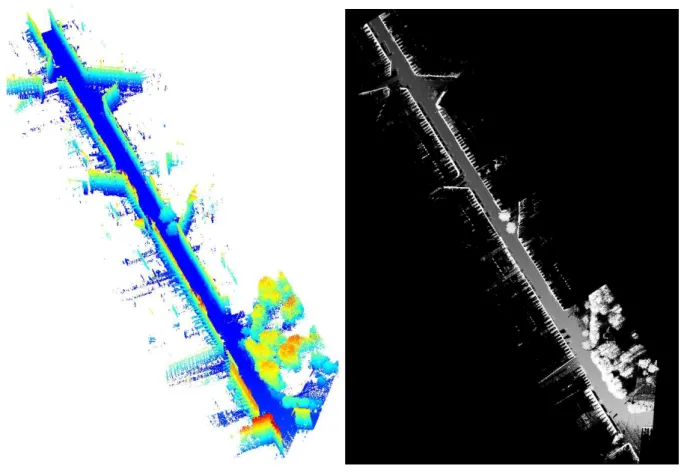
The height image fheightis appropriate to compute façade markers since it contains information about
high and vertical structures, as shown in Figure3.
Figures3(a) and3(b) show maximal fmax and minimal fmin elevation images, respectively. While
Figure3(c)presents the height image.
(a) Maximal elevation image fmax (b) Minimal elevation image fmin (c) Height image fheight= fmax− fmin
Figure 3. Elevation images from a test site in rue d’Assas in Paris, France. Stereopolis II, IGN c .
From the work by Hernández and Marcotegui [29], we use the two following geometric constraints on fheight in order to extract façade markers:
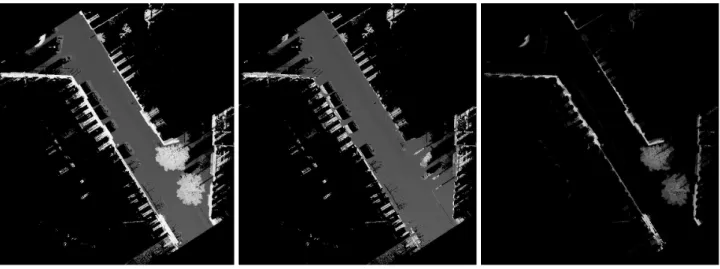
• hmin, defining the minimal allowed façade height. In our experiments, this variable has been set
to 3.5 m according to architectural characteristics of our databases. This threshold is illustrated in Figure4(a). Note that only the highest objects are preserved.
• Lmin, defining the minimal allowed façade length. In our experiments, this variable has been set
to 5 m according to architectural characteristics of our databases. This threshold is illustrated in Figure 4(b). Note that small objects such as lampposts and objects behind façades are not long enough and are then eliminated.
In addition, we propose a third constraint in order to eliminate round objects such as trees:
• Cmin, defining the maximal allowed façade circularity (circularity of an object X is defined as the
inverse of its elongation Circ(X) = 1/E(X). In this work, we focus on geodesic elongation, simply called henceforth elongation [30]. The elongation E(X) of an object X is a shape descriptor useful to characterize long and thin structures. It is proportional to the ratio between the square geodesic diameter L2(X) and the area of the object A(X), as shown in Eq.2. The geodesic diameter L(X) = supx∈X{lx(X)} is the length of the longest geodesic arc of X, i.e. the longest
object, the higher the elongation. The lowest bound is reached with the disk, where E(X) = 1. An efficient implementation can be found in Morard et al. [32].
E(X) = π 4
L2(X)
A(X) (2)
In our experiments, Cminhas been heuristically set to 1/3, which corresponds to the circularity of
an ellipse whose major axis is 3 times longer than the minor one. This value is appropriate to filter tree-tops since circularity of a circle is equal to 1. This threshold is illustrated in Figure4(c). Note that non-elongated objects such as the two trees in the right street side have been eliminated. Using these constraints, we extract façade markers as the union of connected components (CC) higher than hmin, longer than Lmin and less circular than Cmin, as established in Definition2:
Definition 2. Let fheight be a height image fheight: D → V , with D ⊂ Z2 the image domain andV =
[0, ..., H] the set of gray levels mapping the pixel height. Let Th(fheight) be the binary image containing
the pixels higher thanhmin:
Th(fheight) = {p ∈ D|fheight(p) > hmin} (3)
LetC1,C2,...,Cnbe the connected components of image Th(fheight):
Th(fheight) = n
[
i=1
Ci, i 6= j ⇒ Ci∩ Cj = ∅ (4)
Then, façade markersFmark are the connected componentsCi of image Th(fheight) which are longer
thanLminand less circular thanCmin:
Fmark = {Cj|L(Cj) > Lmin∧ Circ(Cj) < Cmin} (5)
∀j ∈ {1, ..., n}, where L(Cj) and Circ(Cj) are respectively the geodesic diameter and the circularity
of connected componentCj.
It is noteworthy that these three parameters (hmin, Lmin and Cmin) are easy to tune since they have a
physical meaning and depend on urban/architectural constraints. Figure4illustrates this marker selection process.
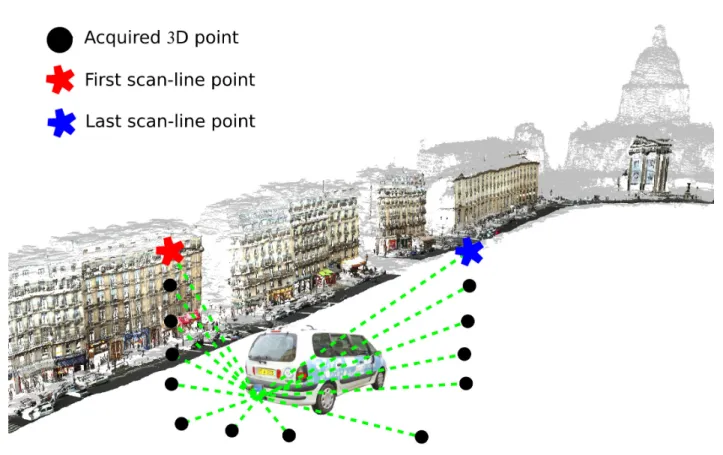
Due to specific requirements in our TerraMobilita datasets, several 3D point clouds have been acquired with the laser system oriented to the ground. Therefore, structures higher than 2.5 m are out of the laser field of view, as shown in Figure 5. This is challenging for methods using height constraints since high wall parts are not visible.
To solve this problem, we propose a solution taking advantage of the acquisition cycle of the MLS sensor, as shown in Figure6. In our configuration, the sensor spins scanning vertical lines starting from the top. Thus, the first and the last point of each spin correspond to the highest point on the right and on the left street side, respectively. These highest points are usually located on the façade and can be extracted by detecting sign changes in the angle of depression (computed using the sensor position) between consecutive points. Then, these markers are added to image Th(fheight) and isolated points are
(a) (b) (c)
Figure 4. Façade marker extraction. Markers are represented with white pixels: (a) Points higher than hmin; (b) Points higher than hmin and longer than Lmin; (c) Façade markers
Fmark: points higher than hmin, longer than Lminand less circular than Cmin. Test site in rue
d’Assas(Paris).
(a) (b)
Figure 5. Example of 3D point clouds when laser is oriented to the ground. 3D point clouds are colored by the Z coordinate. Test sites in rue Vaugirard in Paris, France. Stereopolis II, IGN c .
filtered out using the same process than before: only markers longer than Lmin and less circular than
Cminare considered as façade markers.
Figure 7 illustrates façade marker extraction when the laser sensor is oriented to the ground. Figure7(b) presents the façade markers reprojected onto the 3D point cloud. The test site corresponds to a street section in rue Vaugirard in Paris, France.
Figure 6. Mobile laser scanning (MLS) acquisition cycle. The first and the last point are taken as façade markers. Test site in rue Soufflot in Paris, France. LARA-3D, CAOR-MINES ParisTech c .
(a) 3D point cloud colored by the Z coordinate. (b) Façade markers (red), other (gray).
Figure 7. Façade markers reprojected onto the 3D point cloud. During this acquisition, the laser sensor was oriented to the ground. Note that markers only represent partial façades, therefore a façade reconstruction process is required, as explained in Subsection 4.2. Test site in rue Vaugirard in Paris, France. Stereopolis II, IGN c .
4.2. Façade reconstruction from markers
As mentioned earlier, façade markers only contain partial façades. Therefore, a reconstruction should be applied from those markers in order to retrieve the whole façade. With this purpose, we use a reconstruction constrained by the ground residue. Ground G is assumed to be previously computed
using either our ground segmentation method proposed in [4,29] or any other method reported in the literature [33–36].
Ground residue Gc is computed as the difference between the elevation image and the ground image: Gc = f
max − G. Then, a first solution for the reconstruction process consists in a set of
increasing geodesic dilations applied until idempotence. This transformation is called reconstruction by dilation [31] and is defined as follows:
Definition 3. Reconstruction by dilation. The reconstruction by dilation of a mask image Gc from a
markerFmark ≤ Gc is defined as the geodesic dilation ofFmark within Gcuntil idempotence and it is
denoted by:
RδGc(Fmark) = δ
(i)
Gc(Fmark) (6)
where i is the geodesic dilation size for which idempotence is reached, i.e. δ(i+1)Gc (Fmark) =
δG(i)c(Fmark)
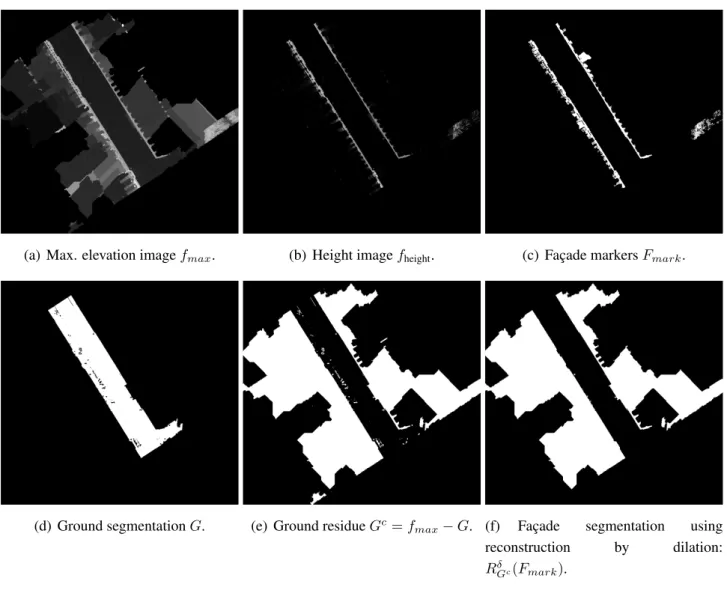
Figure 8 illustrates the façade segmentation based on reconstruction by dilation. Figure 8(a) an elevation image and Figure8(b)its corresponding height image. Figure 8(c)shows the façade markers Fmark computed by the method explained above in Section 4.1. Figure 8(d) presents the ground
segmentation result G, while Figure 8(e) presents the ground residue Gc. Finally, Figure 8(f) shows
the façade segmentation obtained by reconstruction by dilation of the ground residue from the façade markers. Note that pixels behind façades have been included in the segmentation result. This method is fast and easy to implement. However, the main drawback is that objects connected to the façade, e.g. motorcycles or pedestrians leaning on walls or objects behind façades, are reconstructed as well.
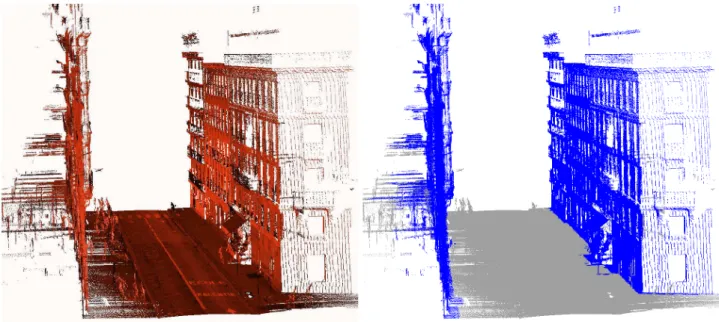
Figure 10 presents this segmentation result reprojected onto the 3D point cloud. Note that the reconstruction by dilation retrieves not only the entire façade but also other objects connected to it. For example, a store, a pedestrian and a traffic sign on the right sidewalk have been wrongly reconstructed.
In order to solve the problem of objects touching the façade, we propose an attribute controlled reconstruction from façade markers. This procedure has been previously published in Serna and Marcotegui [19]. It consists in appending nearby points with similar height. The propagation process stops when a given attribute reaches its maximum value. In our case, we use increasing propagations from façade markers over λ-flat zones, called also in the literature quasi-flat zones [37]. As façades are the longest and most elongated structures in the elevation image, we keep the propagation that maximizes the geodesic elongation.
Let us introduce a formal definition for the façade segmentation process using attribute controlled reconstruction:
Definition 4. Attribute controlled reconstruction. Let Gc be a digital elevation image containing the
ground residueGc : D → V , with D ⊂ Z2 the image domain andV = [0, ..., H] the set of gray levels mapping the elevation values. Two neighboring pixelsp, q belong to the same λ–flat zone of Gc, if their absolute difference|Gc(p) − Gc(q)| is smaller than or equal to a given λ value.
For allx ∈ Fmark ⊆ D, let Λ be the set of increasing regions containing marker pixel x. For all
λ ∈ V and j = [1, ..., n − 1], we define Aλ(Fmark) ∈ Λ as the λ–flat zone of image Gc containing
(a) Max. elevation image fmax. (b) Height image fheight. (c) Façade markers Fmark.
(d) Ground segmentation G. (e) Ground residue Gc= f
max− G. (f) Façade segmentation using
reconstruction by dilation: RδGc(Fmark).
Figure 8. Façade segmentation using reconstruction by dilation on the ground residue image from façade markers. Test site in rue d’Assas in Paris, France. Stereopolis II, IGN c .
Aλ(Fmark) = {x} ∪ {q|∃℘ = (p1= x, ..., pn= q) such that |Gc(pj) − Gc(pj+1)| ≤ λ} (7)
Let E(Aλ(Fmark)) be the geodesic elongation of λ–flat zone Aλ(Fmark). For all λi ∈ V and i =
[0, ..., R], we define λM as the value for which the elongation is maximum:
λM = argmaxλi∈V|E(Aλi(Fmark))| (8)
Then, we define AλM(Fmark) as the attribute controlled reconstruction of the façade from marker
Fmark.
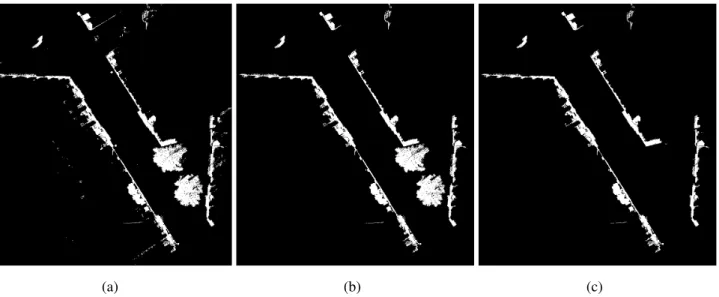
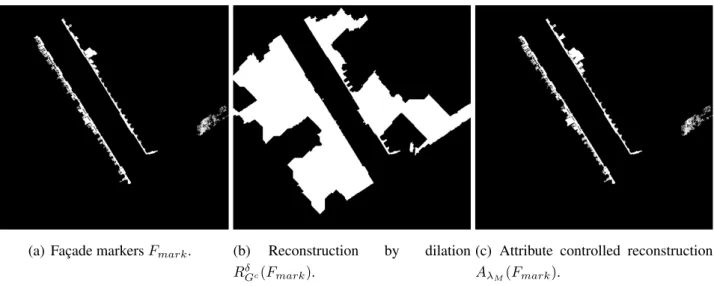
Using this controlled reconstruction maximizing the geodesic elongation, it is possible to reconstruct the façade without merging adjacent objects. Figure 9 compares façade segmentation methods using reconstruction by dilation RδGc(Fmark) and attribute controlled reconstruction AλM(Fmark), both from
marker Fmark. It is noteworthy that neither objects connected to the façade nor objects behind it have
been reached by the attribute controlled reconstruction. Figure 10(d) presents the segmentation result using attribute controlled reconstruction reprojected onto the 3D point cloud. Compared to Figure10(b),
note that the store, the pedestrians and the traffic sign have not been included in the façade. Additionally, several objects such as wall lamps and objects behind façades have been correctly separated.
(a) Façade markers Fmark. (b) Reconstruction by dilation
RδGc(Fmark).
(c) Attribute controlled reconstruction AλM(Fmark).
Figure 9. Comparison of façade segmentation methods using reconstruction by dilation and attribute controlled reconstruction on the ground residue image. Test site in rue d’Assas in Paris, France. Stereopolis II, IGN c .
4.3. Discussion
Methods based on markers are robust to segment non-planar façades and façades with several architectural details and balconies, such it is the case in Parisian buildings. Moreover, these methods are simple and fast since they are based on geometric constraints, easily translated into threshold values. In the case of low façades or when the laser sensor is oriented to the ground, additional markers corresponding to the highest points of each laser cycle are added. Since markers only contain partial façades, a reconstruction is required in order to get the entire façade. In our case, reconstruction is constrained to the ground residue.
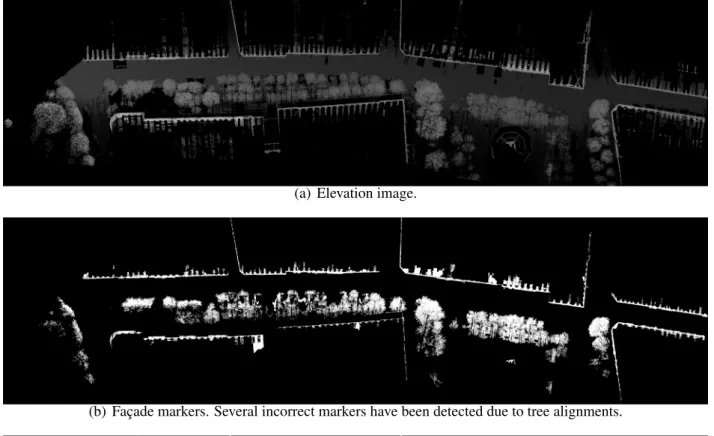
In this section, we have proposed two reconstructions: i) a classic reconstruction by dilation: ii) a reconstruction based on attribute controlled propagation. The performance of these methods strongly depends on the markers selection. A wrong marker may produce errors since it will reconstruct the marked object, even if it is not a façade. In our experiments, our marker selection method has proved to be efficient in many cases. However, objects such as tree alignments may produce false markers, therefore wrong segmentations, as shown in Figure11. The reason of this problem is that our circularity criterion fails filtering trees alignments since their footprints may be elongated enough. Changing the value of circularity does not seem to be a good idea. On the one hand, reducing the circularity value would affect the recall of the method, i.e. less façades would be detected. On the other hand, increasing the circularity value would increase the number of false positives.
This is our motivation to propose a third method, more robust than the two proposed previously, avoiding the use of façade markers. Our idea is analyzing the elongation and its evolution over the height decomposition of the 3D scene. Let us introduce such a method in the following section.
(a) Point cloud colored by the laser intensity. (b) Segmentation result: façade (blue), other (gray). Façade has been segmented using reconstruction by dilation on the ground residue image from façade markers.
(c) Point cloud colored by the laser intensity. (d) Segmentation result: façade (blue), other (gray). Façade segmentation using attribute controlled reconstruction on the ground residue image.
Figure 10. Façade segmentation result reprojected onto the 3D point cloud. Images correspond to two different views of the same test site in rue d’Assas in Paris, France. Stereopolis II, IGN c .
(a) Elevation image.
(b) Façade markers. Several incorrect markers have been detected due to tree alignments.
(c) Façade segmentation using attribute controlled reconstruction.
Figure 11. Errors in façade segmentation due to tree alignments wrongly extracted as façade markers. Test site in St. Sulpice square in Paris, France. Stereopolis II, IGN c .
In order to segment façades avoiding the use of markers, we propose a method based on threshold decomposition and attribute profiles. In [38], we have introduced this method in order to segment elongated objects on gray-scale images. Let us remind its definition in the 2D case:
Definition 5. 2D Attribute profile. Let I be a digital gray-scale image I : D → V , with D ⊂ Z2 the image domain and V = [0, ..., R] the set of gray levels. A decomposition of I can be obtained considering successive thresholds:
Tt(I) = {p ∈ D|I(p) > t} ∀t = [0, ..., R − 1] (9)
Since this decomposition satisfies the inclusion property Tt(I) ⊆ Tt−1(I), ∀t ∈ [1, ..., R − 1], it
is possible to build a tree, called the component tree, with level sets Tt(I). Each branch of the tree
attribute (e.g. area, perimeter, elongation, average gray–level, etc.) of a given CC along a branch of the tree.
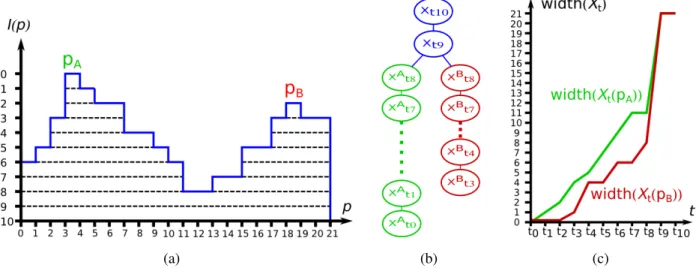
Figure 12 illustrates the threshold decomposition for a 1D function, its component tree and the attribute (width) profiles for the two function maxima (pA and pB). Events on this attribute profile are useful to segment objects [39], extract features [40–42] and define adaptive structuring elements [19].
(a) (b) (c)
Figure 12. (a) 1D threshold decomposition; (b) component tree; (c) attribute profile. Now, let us extend this definition to the 3D case:
Definition 6. 3D Attribute profile. Let P be a 3D point cloud containing a list of N points pi =
(xi, yi, zi) ⊂ <3, wherei = [0, ..., N ]. Let mi = (ui, vi) ⊂ Z2 the projection of pointpi in the elevation
imagefmax. A decomposition ofP in horizontal slices can be obtained considering successive thresholds
on the Z axis separated by a given height∆z:
TtZ(P ) = {mi ∈ D | t∆z < zi < (t + 1)∆z}; ∀t = [0, ..., R − 1]; ∀i = [0, ..., N ] (10)
Contrarily to the 2D case, this decomposition does not satisfy any inclusion property. However, it is always possible to analyze the evolution of a single connected component Xt over horizontal slices
TZ
t (P ). A 3D attribute profile is the evolution of an attribute (e.g. number of points, density, average
elevation, etc.) of a given CC along the decomposition.
More adapted to our 3D urban data, let us define an adaptive decomposition using slices parallel to the ground. From Definition6, we propose the following decomposition:
Definition 7. Adaptive voxelization using ground information. Let G be a digital gray-scale image G : D → V , with D ⊂ Z2 the image domain andV = [0, ..., R] the set of gray levels mapping the ground elevation, resulting from a given ground segmentation process. A decomposition of a 3D point cloudP using slices parallel to the ground can be obtained considering successive thresholds from the ground separated by a given height∆z:
∀t = [0, ..., R − 1]; ∀i = [0, ..., N ]
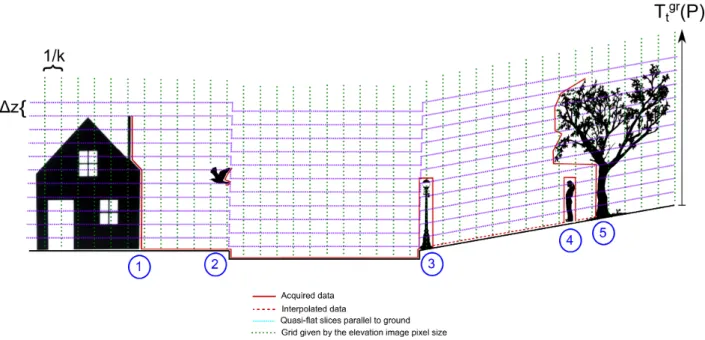
This decomposition is equivalent to an adaptive voxelization, as shown in Figure13. Dashed lines represent slices parallel to the ground. For each slice, an occupancy grid is defined according to the elevation image pixel size 1/k, where k is the number of pixels per unit length (For further details, see [43]). Each voxel is labeled full if there is at least one 3D point inside, or empty otherwise. Finally, these occupancy grids are stacked in a binary 3D image. For each slice, attributes are computed on each binary CC.
Figure 13. Adaptive voxelization using slices parallel to the ground. This example contains five objects: 1 façade, 2 bird, 3 lamppost, 4 pedestrian, and 5 tree.
We propose to segment façades using the maximal elongation image computed from the attribute profile of decomposition Ttgr. With this aim, we compute the geodesic elongation E(Xt) for each CC
on each slice parallel to the ground. Then, for each pixel mi, we store the maximal elongation over the
whole decomposition:
Emax(mi) = max|E(Xt(mi))|; ∀Xt∈ Ttgr; ∀t ∈ [0, ..., R − 1] (12)
Such feature image is a partition of the space where each pixel contains information about elongation of its neighborhood. Then, it is useful in segmentation tasks where some prior shape knowledge is available. This decomposition is used to segment façades while filtering out other structures, such as objects connected to it. The slice height has been set to ∆z = ∆λ = 1.0 m since we are only interested in connected objects higher than 1.0 m (motorcycles, pedestrians, urban furniture, etc.). Additionally, it offers a trade off between processing time and performance since only a few tens of slices are required to decompose an urban scenario without skyscrapers.
Figure14illustrates an example of façade segmentation using this approach. Figure14(a)shows the elevation image. Figure14(b)presents the elongation image computed from the threshold decomposition of the 3D point cloud. Figure 14(c)presents the segmentation result applying a simple threshold on the
elongation image. We define Emin as the minimal elongation allowed for a façade. In our experiments,
we have heuristically set Emin=20, which corresponds to the elongation of a rectangle whose length is
approximately 25 times longer than its width. It is noteworthy that this elongation threshold is more restrictive than that used for marker extraction (section4.1) since here we are interested in detecting the maximal elongation value over all the decomposition.
Figure 15 presents a façade segmentation result on a test site in rue Bonaparte in Paris, France. With respect to Figure11most façades are correctly segmented. Some problems appear in the left part: zone 1, where the side part of a bus has been wrongly detected as façade; and zone B, where bushes and vegetation over a low wall could not be separated (Figure 15(d)). These objects present a high elongation, then they have been wrongly segmented as façades.
6. City block segmentation
A city block is the smallest area that is surrounded by streets. A wide variety of sizes and shapes can be found in urban environments. In general, it depends on historic, demographic and geographic constraints. For example, many pre-industrial cities tend to have irregular city blocks, while newer cities have usually much more regular arrangements [44].
In our application, city blocks are considered as the biggest semantic entities in the urban environment. Their segmentation is useful for individual city block analysis. Additionally, each city block can be processed separately and their results joined at the end of the analysis, reducing memory requirements and allowing parallelization.
Once façades have been segmented using one of our three proposed methods, we compute the influence zone (IZ) of each façade in order to define city blocks. The IZ algorithm was one of the first morphological operators applied to image segmentation. It was discovered in the 70s from the iterative application of basic operators such erosion and dilation [45,46]. The IZ of a given CC is defined by the set of pixels of a binary image that are closer to this CC than to any other CC on the image. Let us introduce its formal definition:
Definition 8. Influence zones (IZ). Let X be a binary image and K1, K2,..., Kn the CC of X. The
influence zone ofKi is the set of pixels of imageX that are closer to Ki than to any other CC of image
X:
IZ(Ki) = {p|∀j ∈ {1, ..., n}, i 6= j ⇒ d(p, Ki) < d(p, Kj)} (13)
It is noteworthy that this is an alternative definition of Voronoi diagrams [47]. In practice, the IZ of a binary image is computed using a constrained watershed on the distance function of the binary image. Figure16illustrates this city block segmentation. Figure 16(a)shows the elevation image. Figure16(b)
presents the binary image containing the façade segmentation result. Figure16(c)shows a morphological closing of size Sminin order to reconnect near façades belonging to the same city block, i.e. Smin stands
for the minimal separation between city blocks. Figure 16(d) shows the medial road axes useful to avoid defining city block crossing the street. This information is used if available and it can be obtained from the vehicle trajectory or from an external 2D map. Figure 16(e) illustrates the distance function
(a) Elevation image.
(b) Maximal elongation image computed from the 3D point cloud.
(c) Façade segmentation using the maximal elongation image.
Figure 14. Façade segmentation using the maximal elongation image (without markers). Test site in rue Cassette in Paris, France. Stereopolis II, IGN c .
computed from façades. The distance function is constrained to be maximum on both medial road axes and empty pixels. Finally, Figure 16(f) presents the IZ as the result of a constrained watershed on the distance function. Each color represents a different city block.
(a) Elevation image.
(b) Maximal elongation image computed from the 3D point cloud.
(c) Façade segmentation using the maximal elongation image. Two segmentation errors have been found in zones A and B.
(d) Façade segmentation error due to vegetation and bushes over a low wall. This is an unusual case presented in zone B in Figure15(c).
Figure 15. Façade segmentation using the maximal elongation image (without markers). Test site in rue Bonaparte in Paris, France. Stereopolis II, IGN c .
Figures17and 18present two city block segmentation results reprojected onto the 3D point cloud. In those experiments, façades have been segmented using the elongation based method explained in Section5.
(a) Elevation image. (b) Binary image containing the façade segmentation result.
(c) Closing of size Smin to reconnect
near façades.
(d) Medial road axes (used if available). (e) Distance function from façades (blue). Both empty pixels and medial road axes are constrained to have the maximal distance.
(f) Influence zones. Each color represents a different city block.
Figure 16. City block segmentation using the influence zones of the façade. Test site in rue d’Assasin Paris, France. Stereopolis II, IGN c .
7. Results
Our façade segmentation methods have been tested on TerraMobilita1 datasets in order to get
qualitative and quantitative results. Two types of ground truth (GT) annotations are available:
• 2D lines indicating the separation between sidewalks and buildings. These 2D manual annotations are usually provided by local authorities. In our case, they have been obtained from Open Data Paris2, a project from Paris city hall (Mairie de Paris, in French) in order to make urban data available to the community. Evaluations using 2D lines are commonly used in the state of the art when 3D annotations are not available [4,48,49]. These evaluations give an idea on the segmentation method performance. However, results should be carefully interpreted since the
1 http://cmm.ensmp.fr/TerraMobilita/ 2 http://opendata.paris.fr/
(a) Point cloud colored by the Z coordinate.
(b) Point cloud colored by the laser intensity.
(c) Façade segmentation using the elongation image (method without markers). Façade (blue) and other (gray).
(d) City block segmentation. Each color represents a different city block.
Figure 17. City block segmentation using the influence zones of the façade. Reprojection onto the 3D point cloud. Test site in rue d’Assas in Paris, France. Stereopolis II, IGN c .
evaluation is only carried out on the 2D space at the ground level, the performance segmenting 3D features such as tilted façades, architectural details and balconies cannot be directly evaluated.
(a) Façade segmentation using the elongation image (method without markers). Façade (blue) and other (gray).
(b) City block segmentation. Each color represents a different city block.
Figure 18. City block segmentation using the façades influence zones. Reprojection onto the 3D point cloud. Test site in rue Bonaparte and St. Sulpice square in Paris, France. Stereopolis II, IGN c .
• 3D point-wise annotations, i.e. a class is assigned to each 3D point. These point-wise annotations allow a global evaluation taking all façade points into account. In our opinion, this evaluation is the most appropriate, however complete 3D manual annotations are rarely available in the state of the art. In our experiments, we have used 3D annotations and evaluation methods developed in the framework of TerraMobilita/iQmulus benchmark3.
Evaluations based on each type of GT annotation are presented in the two following subsections. 7.1. Results: Evaluation using Open Data Paris
We have chosen 4 MLS datasets from 6th Parisian district in France. Data have been acquired by Stereopolis II [50], a MLS system by the National French Mapping Agency (IGN - In French Institut National de l’Information Géographique et Forestière). Table 1 describes the datasets used in this evaluation.
Table 1. Datasets used for evaluation of our façade segmentation methods. All datasets have been acquired in January 2013 by Stereopolis II system in the 6th Parisian district, France.
Filename Description
site I TerMob2_LAMB93_0020.ply rue d’Assas, approx. 90 m. Short street section with straight façades. See Figure20
site II TerMob2_LAMB93_0021.ply rue d’Assas, approx. 80 m. Short street section with two intersections and two big trees. See Figure21
site III Cassette_idclass.ply rue Cassette, approx. 200 m. Long street with mainly straight façades and a small tree alignment. See Figure22
site IV Z2.ply rue Bonaparteand St. Sulpice square, approx. 400
m. Long street section with non straight façades and several tree alignments. See Figure23
GT annotations have been obtained from Open Data Paris and correspond to 2D lines indicating the junction between sidewalks and buildings at the ground level. Quantitative analyses are performed by comparison between automatic and GT lines on a 2D image. When 3D façade points are projected to a 2D plane, they are usually wider than a single line due to façade inclination, architectural details and balconies. Therefore, buffers around GT lines and segmented façades are required in order to evaluate the results.
On the one hand, a segmented façade is labeled as true positive or false positive if it is located inside or outside a GT buffer, respectively. On the other hand, a GT façade is labeled as segmented or missed if it is located inside or outside a segmented façade buffer, respectively.
In our datasets, we consider a buffer width of 1.0 m, which corresponds to the width of a typical Haussmannian balcony in Paris. This buffer is appropriate to quantify true positives without overestimating false positives, as shown in Figure19. This buffer-based evaluation is commonly used in other works reported in the literature [4,48,49].
The classic Precision (P), Recall (R) and fmeancriteria are computed. Recall is defined as the number
of GT pixels correctly segmented divided by the total number of GT pixels; Precision is defined as the number of true positive pixels divided by total number of segmented pixels (true positives + false positives); and Fmean= 2P R/(P + R).
Table 2 presents a quantitative comparison between our façade segmentation methods. As aforementioned, these results should be carefully interpreted since the evaluation is only carried out on the 2D space at the ground level. Then, the performance segmenting inclined façades, façades with architectural details and balconies cannot be directly quantified.
Figures 20 to 23 present elevation images, GT annotations and segmentation results on our four test sites. It is noteworthy that several ground truth annotations are missing. For example, in site III (Figure22(b)) several façades in the street left side are missing, while in site IV (Figure23(b)) façades behind trees in the street right side have not been annotated. Therefore, several correct segmentations have been incorrectly labeled as false positives. As a result, the performance of our methods is under-estimated in these two test sites. Let us analyze results of each method in detail.
Figure 19. Ground truth lines and 3D façade points projected onto the 2D plane. GT lines (red) and segmented façades (blue). Test site in rue d’Assas in Paris, France. Stereopolis II, IGN c .
Method 1, based on reconstruction by dilation from markers, presents the highest Recall retrieving 100% of façades in the four test sites. However, this method presents also the highest number of false positives (Precision ranges between 13.6% and 45.1% for all test sites). As aforementioned, this method is based on iterative geodesic dilation, then any object touching the façade is segmented as part of it. This method is the fastest one and its use may be justified in an application with strict time constraints or if only a rough segmentation is required. For example, if we are only interested in defining the public space boundary (e.g. for a urban mobility application), all objects touching or behind the façade are not required to be segmented.
As explained earlier, the main problem of this method is that connected objects, such as motorcycles parked next to the façade or leaning pedestrians, are reconstructed in the façade mask. In order to solve this problem, we have proposed Method 2, based on attribute controlled reconstruction from markers. Since connected objects usually reduce the global façade elongation, this method offers better results than the first one: Recall is higher than 97% for all test sites while Precision increases up to 73.2% and 87.8% in sites I and II, respectively, sites for which all façades have been annotated. This method presents the best trade-off between performance and processing time.
In general, methods based on façade markers are strongly influenced by markers extraction. The main drawback is that bad located markers may produce errors reconstructing non-façade objects. Particularly in site IV, marker-based methods fail segmenting the tree alignments (Precision is 13.6% and 13.9% for methods 1 and 2, respectively). Method 3 does not require markers and leads to a more robust
Table 2. Quantitative comparison between our façade segmentation methods on 4 test sites.
Method 1: Method 2: Method 3:
Reconstruction by dilation (Section 4, Definition3) Attribute controlled reconstruction (Section4, Definition4) Maximal elongation image (Section5)
site I Precision = 45.1% Precision = 73.2% Precision = 80.9%
Recall = 100.0% Recall = 99.5% Recall = 99.3%
fmean= 62.2% fmean= 84.4% fmean= 89.2%
time = 2.2 s time = 10.7 s time = 20.0 s
site II Precision = 47.7% Precision = 87.8% Precision = 92.3%
Recall = 100.0% Recall = 97.9% Recall = 93.2%
fmean= 64.6% fmean= 92.6% fmean= 92.8%
time = 2.1 s time = 7.8 s time = 16.5 s
site III Precision = 27.5% Precision = 44.8% Precision = 67.9 %
Recall = 99.3% Recall = 98.6% Recall = 98.2%
fmean= 43.0% fmean= 61.6% fmean= 80.3 %
time = 3.5 s time = 22.5 s time = 44.6 s
site IV Precision = 13.6% Precision = 13.9% Precision = 64.7%
Recall = 100.0% Recall = 99.8% Recall = 88.9%
fmean= 23.8% fmean= 27.4% fmean= 74.9%
time = 6.8 s time = 68.6 s time = 108.4 s
segmentation based on the maximal elongation image. This method produces the best results for all test sites: fmean equal to 80.9% and 92.8% for sites I and II. In spite of missing GT annotations, fmean
is equal to 80.3% and 74.9% for sites III and IV, proving the performance of this method even in the presence of trees. The main drawback is that its implementation is slower, then it is not suitable for real-time applications. However, time computing is reasonable for large scale applications, where time constraints are less strict. Note that processing time is only a few tens of seconds for an acquisition of several hundreds of meters, using a non-optimized implementation.
7.2. Results: TerraMobilita/iQmulus database
TerraMobilita/iQmulus database [51] has been created with the aim of benchmarking semantic analysis methods working on 3D dense urban data. This database has been created in the framework of TerraMobilita project. It consists in 11 annotated 3D point clouds acquired by Stereopolis II system in the 6thParisian district in January 2013. Annotation has been carried out in a manually assisted way by MATIS laboratory at IGN.
(a) Elevation image. (b) Ground truth. Façade lines taken from ODParis.
(c) Façade segmentation using reconstruction by dilation.
(d) Façade segmentation using attribute controlled reconstruction.
(e) Façade segmentation using the maximal elongation image.
Figure 20. Façade segmentation results for site I (TerMob2_LAMB93_0020.ply).
Our evaluation consists in one of those point clouds. For this experiment, file “Cassette_idclass.ply” has been used4. It contains 12 million points from a street section approximately 200 m long in rue Cassette in Paris, France. Manual annotations and point-wise evaluations have been independently carried out by the IGN. Results of this benchmark have been previously published in [52].
Figure 24 presents the façade segmentation result projected onto the 3D point cloud. In this experiment, only our method based on the maximal elongation image has been applied. As a general remark, errors of our segmentation method are due to an incomplete detected façade (zone A) and a tree alignment connected to a low wall (zone B).
As cited previously, our results are evaluated point-by-point using the TerraMobilita/iQmulus evaluation protocol [51]. First, we classify the 3D point cloud in two main categories: surface (containing façades and ground) and other. Moreover, the unclassified category has been defined for non-annotated points in the GT, which are ambiguous points difficult to annotate. They correspond to
4 The manual annotated 3D point cloud is available at:
http://data.ign.fr/benchmarks/UrbanAnalysis/download/Cassette_idclass.zip
The 3D point cloud processed by our method is available at:
(a) Elevation image. (b) Ground truth. Façade lines taken from ODParis.
(c) Façade segmentation using reconstruction by dilation.
(d) Façade segmentation using attribute controlled reconstruction.
(e) Façade segmentation using the maximal elongation image.
Figure 21. Façade segmentation results for site II (TerMob2_LAMB93_0021.ply).
18.31 % of total number of points in the dataset. For example, consider the tree and the wall in zone C in Figure24. These points have been manually marked as unclassified, then they have not been taken into account in the evaluation.
Table3presents the confusion matrix and our classification results for these two categories. Results are presented as percentages with respect to the total number of points in the 3D point cloud (12 million points). Segmentation has been carried out using the method without markers (Section 5). This classification is useful to evaluate the ability of our method segmenting surfaces (façades and ground) while separating other objects connected to them.
Table 3. Classification results on TerraMobilita/iQmulus database. GT: ground truth, AR: automatic result. Segmentation using the method without markers (Section5).
GT/AR unclassif. surface other Sum Recall Precision fmean
unclassif. - - - 18.31 % - -
-surface 1.90 % 70.81 % 3.10 % 75.81 % 93.40 % 98.82 % 96.03 %
other 0.09 % 0.85 % 4.94 % 5.88 % 84.16 % 61.52 % 71.08 %
(a) Elevation image. (b) Ground truth. Façade lines taken from ODParis. (c) Façade segmentation using reconstruction by dilation. (d) Façade segmentation using attribute controlled reconstruction. (e) Façade
segmentation using the maximal elongation image.
Figure 22. Façade segmentation results for site III (Cassette_idclass.ply).
Using our method, fmeanfor the surface class is equal to 96.03% while other are correctly separated
from them with fmeanequal to 71.08 %. In this experiment, we are mainly interested in separating façades
and ground from other structures such as connected objects. Note that the surface class includes façades and ground, which represent the biggest categories in the scene with 75.81 % of total 3D points, while the other class represents 5.88 % of total 3D points. The overall accuracy of our method considering these categories is 92.73 %.
Table4presents our segmentation results for the surface class (façades and ground). In the confusion matrix, results are presented as percentages with respect to the total number of points in the 3D point cloud (12 million points). Note that our method correctly separates façades and ground giving Fmean equal to 97.25 % and 98.72 %, respectively. Figure 25 shows that small errors are due to the
façade-ground junction, where some points may be wrongly assigned. The overall accuracy in this case is 98.26 %. These results prove the performance of our method.
Table 4. Classification results for surface class (façades and ground) on TerraMobilita/iQmulus database. GT: ground truth, AR: Automatic result.
GT/AR ground façade Sum Recall Precision Fmean
ground 30.77 % 0.01 % 30.78 % 99.96 % 94.69 % 97.25 %
façade 1.73 % 67.49 % 69.22 % 97.51 % 99.98 % 98.72 %
Sum 32.50 % 67.50 % 100.0 % Overall accuracy: 98.26 %
(a) Elevation image. (b) Ground truth. Façade lines taken from ODParis. (c) Façade segmentation using reconstruction by dilation. (d) Façade segmentation using attribute controlled reconstruction. (e) Façade
segmentation using the maximal elongation image.
Figure 23. Façade segmentation results for site IV (Z2.ply).
In this paper, we have proposed automatic and robust approaches to segment façades from 3D point clouds. Processing is carried out using elevation images and 3D decomposition, and the final result can be reprojected onto the 3D point cloud for visualization or evaluation purposes.
Our methods are based on geometrical and geodesic constraints. Parameters are related to urban and architectural constraints. Thus, they are intuitive to tune. The performance of our methods have been proved in our experiments on TerraMobilita databases using 2D and 3D ground truth annotations. Three approaches have been proposed: i) reconstruction by dilation from markers; ii) attribute controlled reconstruction from markers and; iii) maximal elongation image from 3D decomposition (without markers). The method based on reconstruction by dilation from markers is the fastest one since it is based on simple thresholds and use reconstructions constrained by the ground residue in order to get the entire façade. The main problem is that objects connected to the façade are reconstructed as well. In order to solve this problem, we have proposed an attribute controlled reconstruction using the geodesic elongation. Since connected objects usually appear at low heights and reduce the global façade elongation, this method offers better results than the first one. In our experiments, we have used geometric and geodesic constraints in order to extract façade markers. In the case of low façades or when the laser sensor is oriented to the ground, additional markers have been proposed.
Figure 24. Façade segmentation result using the maximal elongation image on “Cassette_idclass.ply’ file. Ground (gray), façades (blue). Input file taken from TerraMobilita/iQmulus database. Stereopolis II, IGN c . Errors are due to an incomplete detected façade (zone A) and a tree alignment connected to a low wall (zone B). Zone C corresponds to non-annotated points.
(a) Point cloud colored by the laser intensity. (b) Segmentation result projected onto the 3D point cloud. Façade (blue), sidewalk (green), road (gray), curbs (red), pole-like objects (magenta), other (pink).
Figure 25. Minor errors in the façade–ground junction (between blue and green colors). Acquisition by IGN c France.
In general, methods based on façade markers are strongly influenced by the markers extraction method. The main drawback is that bad located markers produce errors since they may reconstruct non-façade objects. For this reason, we have proposed a more robust method avoiding the use of façade markers. In such method, both the elongation and its evolution over the height decomposition of the scene are analyzed. This method is based on the maximal elongation image computed from 3D decomposition. It has been proved to produce the best results.
Since the three proposed methods are based on geometric and geodesic constraints, they can be set up to manage façades of any length, height and elongation. However, these methods offer different results and level of detail. In that sense, the selection of the best segmentation method should be a trade off between quality of the results and computational cost. This choice remains application dependent: On the one hand, for applications with strict time constraints where only rough results are required, the user should prefer the first method based on façade markers and morphological reconstruction by dilation. However, in the presence of objects touching the façades, such as low bushes or parked motorcycles, the user should prefer the second method based on attribute controlled reconstruction. On the other hand, for mapping applications, where the quality of results is of the utmost importance while keeping a reasonable computation time able to address large-scale applications, the third method based on the elongation image should be preferred. This method is the most accurate and appropriate to manage high objects, such as trees, connected to the façade.
Our approach is a research prototype, mainly based on Morph-M library [53], the image processing library of our laboratory. This library allows fast prototyping but it is not intended to be a fast library. Optimization of our base operators (erosion, dilation, opening, reconstruction, watershed, and so on), currently under development at CMM, aims at providing optimized operators for real time and/or big image developments. Software (hierarchical queues, structuring elements decomposition, among others) and hardware (SIMD-Single Instruction Multiple Data and parallelization) optimizations are available in SMIL library [54] and will be integrated in our future developments.
Acknowledgments
The work reported in this paper has been performed as part of Cap Digital Business Cluster TerraMobilita project.
We would want to thank Dr. Bruno Vallet and his colleagues from MATIS Laboratory at IGN for their help evaluating our methods on TerraMobilita/iQmulus database.
Author Contributions
Andrés Serna is the leading author of this work. He performed the research, developed the software prototype and wrote the paper together with Beatriz Marcotegui. The paper was further revised by Jorge Hernández who gave substantial contributions to the design and analysis of this work
Conflicts of Interest
The authors declare no conflict of interest. References
1. CapDigital. TerraMobilita:3D mapping of roads and urban public space, accessibility and soft mobility, 2014. http://cmm.ensmp.fr/TerraMobilita/(Last accessed: Septembre 11, 2014). 2. Vosselman, G.; Maas, H.G. Airborne and Terrestrial Laser Scanning; Whittles Publishing, 2010;
3. Hernández, J.; Marcotegui, B. Point cloud segmentation towards urban ground modeling. The 5th GRSS/ISPRS Joint Urban Remote Sensing Event (URBAN 2009); , 2009; pp. 1–5.
4. Serna, A.; Marcotegui, B. Urban accessibility diagnosis from mobile laser scanning data. ISPRS Journal of Photogrammetry and Remote Sensing2013, 84, 23–32.
5. Goulette, F.; Nashashibi, F.; Ammoun, S.; Laurgeau, C. An Integrated on–Board Laser Range Sensing System for On–the–Way City and Road Modelling. International Archives of Photogrammetry, Remote Sensing and Spatial Information Sciences2006, 34, 3–5.
6. Boulaassal, H.; Grussenmeyer, P.; Tarsha-kurdi, F. Automatic segmentation of building facades using terrestrial laser data. The International Archives of the Photogrammetry, Remote Sensing and Spatial Information Sciences, 2007, Vol. XXXVI-3/W52, pp. 65–70.
7. Bab-Hadiashar, A.; Gheissari, N. Range image segmentation using surface selection criterion. IEEE Transactions on Image Processing2006, 15, 2006–2018.
8. Hoover, A. University of South Florida (USF) Range Image Database, 1994. http://marathon. csee.usf.edu/range/DataBase.html(Last accessed: May 15, 2014).
9. Boyer, K.; Mirza, M.; Ganguly, G. The Robust Sequential Estimator: a general approach and its application to surface organization in range data. IEEE Transactions on Pattern Analysis and Machine Intelligence1994, 16, 987–1001.
10. Werghi, N.; Fisher, R.; Robertson, C.; Ashbrook, A. Modelling Objects Having Quadric Surfaces Incorporating Geometric Constraints. Proceedings of 5th European Conference on Computer Vision ECCV’98. Springer-Verlag, 1998, pp. 185–201.
11. Marshall, D.; Lukacs, G.; Martin, R. Robust Segmentation of Primitives from Range Data in the Presence of Geometric Degeneracy. IEEE Transactions on Pattern Analysis and Machine Intelligence2001, 23, 304–314.
12. Chaperon, T.; Goulette, F. Extracting cylinders in full 3D data using a random sampling method and the Gaussian image. Proceedings of the Vision Modeling and Visualization Conference, VMV-01; Aka GmbH: Stuttgart, Germany, 2001.
13. Lari, Z.; Habib, A. An adaptive approach for the segmentation and extraction of planar and linear/cylindrical features from laser scanning data. ISPRS Journal of Photogrammetry and Remote Sensing2014, 93, 192–212.
14. Demantke, J.; Mallet, C.; David, N.; Vallet, B. Dimensionality based scale selection in 3D LiDAR point clouds. The International Archives of the Photogrammetry, Remote Sensing and Spatial Information Sciences, 2010, Vol. XXXVIII-5/W12, pp. 97–102.
15. Hammoudi, K. Contributions to the 3D city modeling. PhD thesis, Université Paris-Est, 2011. 16. Sevcik, C.; Studnicka, N. Documentation of complex facades and city modelling through the
combination of Laserscanning and photogrammetry. Technical report, GeoDATA IT mbh and RIEGL Laser Measurement Systems, 2006.
17. Rutzinger, M.; Pratihast, A.K.; Oude Elberink, S.J.; Vosselman, G. Tree modelling from mobile laser scanning data-sets. The Photogrammetric Record 2011, 26, 361–372.
18. Poreba, M.; Goulette, F. RANSAC algorithm and elements of graph theory for automatic plane detection in 3D point clouds. Archives of Photogrammetry, Cartography and Remote Sensing 2012, 24, 301–310.
19. Serna, A.; Marcotegui, B. Attribute controlled reconstruction and adaptive mathematical morphology. 11th International Symposium on Mathematical Morphology (ISMM 2013); , 2013; pp. 205–216.
20. Weinmann, M.; Jutzi, B.; Mallet, C. Feature relevance assessment for the semantic interpretation of 3D point cloud data. ISPRS Annals of Photogrammetry, Remote Sensing and Spatial Information Sciences, 2013, Vol. II-5/W5, pp. 313–318.
21. Weinmann, M.; Jutzi, B.; Mallet, C. Semantic 3D scene interpretation: A framework combining optimal neighborhood size selection with relevant features. ISPRS Annals of the Photogrammetry, Remote Sensing and Spatial Information Sciences, 2014, Vol. II(3), pp. 181–188.
22. Shao, H.; Svodoba, T.; Gool, L.V. ZuBuD - Zurich Building Database for Image Based recognition. Technical Report 260, Computer Vision Lab, ETH Zurich, 2003.
23. Hernández, J.; Marcotegui, B. Morphological segmentation of building façade images. IEEE International Conference on Image Processing, ICIP’09, 2009, pp. 4029–4032.
24. Teboul, O.; Simon, L.; Koutsourakis, P.; Paragios, N. Segmentation of building facades using procedural shape priors. IEEE Conference on Computer Vision and Pattern Recognition, CVPR2010, 2010, pp. 3105–3112.
25. Serna, A.; Hernández, J.; Marcotegui, B. Adaptive parameter tuning for morphological segmentation of building facade images. Proceedings of the 20th European Signal Processing Conference (EUSIPCO2012), 2012.
26. Teeravech, K.; Nagai, M.; Honda, K.; Dailey, M. Discovering repetitive patterns in facade images using a RANSAC style algorithm. ISPRS Journal of Photogrammetry and Remote Sensing 2014, 92, 38–53.
27. Serra, J. Image analysis and mathematical morphology; Vol. 1, Academic Press: Orlando, FL, USA, 1982.
28. Soille, P. Morphological image analysis: principles and applications; Springer-Verlag: Secaucus, NJ, USA, 2003.
29. Hernández, J.; Marcotegui, B. Filtering of artifacts and pavement segmentation from mobile LiDAR data. The International Archives of the Photogrammetry, Remote Sensing and Spatial Information Sciences, 2009, Vol. XXXVIII-3/W8, pp. 329–333.
30. Lantuéjoul, C.; Maisonneuve, F. Geodesic methods in quantitative image analysis. Pattern Recognition1984, 17, 177–187.
31. Lantuéjoul, C.; Beucher, S. On the use of the geodesic metric in image analysis. Journal of Microscopy1981, 121, 39–49.
32. Morard, V.; Decencière, E.; Dokládal, P. Efficient geodesic attribute thinnings based on the barycentric diameter. Journal of Mathematical Imaging and Vision 2013, 46, 128–142.
33. Golovinskiy, A.; Kim, V.G.; Funkhouser, T. Shape-based recognition of 3D point clouds in urban environments. 12th IEEE International Conference on Computer Vision, 2009, pp. 2154–2161. 34. Munoz, D.; Vandapel, N.D.; Hebert, M. Onboard contextual classification of 3-D point clouds
with learned high-order Markov Random Fields. IEEE International Conference on Robotics and Automation, ICRA ’09., 2009, pp. 2009–2016.
35. Mallet, C.; Bretar, F.; Roux, M.; Soergel, U.; Heipke, C. Relevance assessment of full-waveform LiDAR data for urban area classification. ISPRS Journal of Photogrammetry and Remote Sensing 2011, 66, 71–84.
36. Pu, S.; Rutzinger, M.; Vosselman, G.; Elberink, S.O. Recognizing basic structures from mobile laser scanning data for road inventory studies. ISPRS Journal of Photogrammetry and Remote Sensing2011, 66, 28–39.
37. Meyer, F. From connected operators to levelings. Mathematical Morphology and its Applications to Image and Signal Processing. Kluwer Academic Publishers, 1998, Vol. 12, Computational Imaging and Vision, pp. 191–198.
38. Serna, A.; Marcotegui, B.; Decencière, E.; Baldeweck, T.; Pena, A.M.; Brizion, S. Segmentation of elongated objects using attribute profiles and area stability: Application to melanocyte segmentation in engineered skin. Pattern Recognition Letters 2014, 47, 172–182.
39. Jones, R. Connected Filtering and Segmentation Using Component Trees. Computer Vision and Image Understanding1999, 75, 215–228.
40. Pesaresi, M.; Benediktsson, J. A new approach for the morphological segmentation of high-resolution satellite imagery. IEEE Transactions on Geoscience and Remote Sensing 2001, 39, 309–320.
41. Beucher, S. Numerical residues. Image and Vision Computing 2007, 25, 405–415.
42. Morard, V.; Decencière, E.; Dokládal, P. Region Growing Structuring Elements and New Operators based on their Shape. International conference on Signal and Image Processing (SIP’11). ACTA Press, 2011, pp. 1–8.
43. Serna, A. Semantic analysis of 3D point clouds from urban environments:
ground, facades, urban objects and accessibility. PhD thesis, MINES ParisTech, 2014.
44. Wikipedia. City blocks, 2014. http://en.wikipedia.org/w/index.php?title=City_block&oldid= 617153038(Last accessed: October 8, 2014).
45. Matheron, G. Random Sets and Integral Geometry; John Wiley & Sons: New York, 1975. 46. Serra, J.; Soille, P. Mathematical Morphology and Its Applications to Image Processing; Kluwer
Academic Publishers, 1994.
47. Voronoi, G. Nouvelles applications des paramètres continus à la théorie des formes quadratiques. Journal für die Reine und Angewandte Mathematik1908, 133, 97–178.
48. Vosselman, G.; Zhou, L. Detection of curbstones in airborne laser scanning data. The International Archives of the Photogrammetry, Remote Sensing and Spatial Information Sciences, 2009, Vol. XXXVIII-3/W8, pp. 11–116.
49. Zhou, L.; Vosselman, G. Mapping curbstones in airborne and mobile laser scanning data. International Journal of Applied Earth Observation and Geoinformation2012, 18, 293–304. 50. Paparoditis, N.; Papelard, J.P.; Cannelle, B.; Devaux, A.; Soheilian, B.; David, N.; Houzay,
E. Stereopolis II: A multi–purpose and multi-sensor 3D mobile mapping system for street visualisation and 3D metrology. Revue Française de Photogrammétrie et de Télédétection 2012, 200, 69–79.
51. Brédif, M.; Vallet, B.; Serna, A.; Marcotegui, B.; Paparoditis, N. TerraMobilita/iQmulus urban point cloud classification benchmark. IQmulus workshop on Processing Large Geospatial Data.
iQmulus/TerraMobilita contest, 2014, pp. 1–6. http://data.ign.fr/benchmarks/UrbanAnalysis/
(Last accessed: June 26, 2014).
52. Vallet, B.; Brédif, M.; Serna, A.; Marcotegui, B.; Paparoditis, N. TerraMobilita/iQmulus Urban Point Cloud Analysis Benchmark. Computers & Graphics. (Submitted on September 4, 2014) 2014.
53. CMM. Morph-M : Image processing software specialized in Mathematical Morphology. MINES ParisTech, CMM - Center for Mathematical Morphology, 2013. http://morphm.ensmp.fr (Last accessed: October 8, 2014).
54. Faessel, M.; Bilodeau, M. SMIL: Simple Morphological Image Library. Séminaire Performance et Généricité, LRDE; , 2013. http://cmm.ensmp.fr/~faessel/smil (Last accessed: October 8, 2014).
c
2015 by the authors; licensee MDPI, Basel, Switzerland. This article is an open access article distributed under the terms and conditions of the Creative Commons Attribution license (http://creativecommons.org/licenses/by/4.0/).