HAL Id: hal-00501876
https://hal.archives-ouvertes.fr/hal-00501876
Submitted on 12 Jul 2010
HAL is a multi-disciplinary open access
archive for the deposit and dissemination of
sci-entific research documents, whether they are
pub-lished or not. The documents may come from
teaching and research institutions in France or
abroad, or from public or private research centers.
L’archive ouverte pluridisciplinaire HAL, est
destinée au dépôt et à la diffusion de documents
scientifiques de niveau recherche, publiés ou non,
émanant des établissements d’enseignement et de
recherche français ou étrangers, des laboratoires
publics ou privés.
Modeling the Injection-Locked Behavior of a Quantum
Dash Semiconductor Laser
Nader Naderi, Mike Pochet, Frédéric Grillot, Nathan Terry, Vassilios Kovanis,
Luke Lester
To cite this version:
Nader Naderi, Mike Pochet, Frédéric Grillot, Nathan Terry, Vassilios Kovanis, et al.. Modeling the
Injection-Locked Behavior of a Quantum Dash Semiconductor Laser. IEEE Journal of Selected Topics
in Quantum Electronics, Institute of Electrical and Electronics Engineers, 2010, 15 (3), pp.563-571.
�10.1109/JSTQE.2009.2015334�. �hal-00501876�
Modeling the Injection-Locked Behavior of a
Quantum Dash Semiconductor Laser
Nader A. Naderi, Student Member, IEEE, Mike Pochet, Fr´ed´eric Grillot, Member, IEEE, Nathan B. Terry,
Vassilios Kovanis, and Luke F. Lester, Senior Member, IEEE
Abstract—Using the conventional rate equations describing an injection-locked system, a novel modulation response function is derived, which implicitly incorporates nonlinear gain through the free-running relaxation oscillation frequency and damping rate of the slave laser. In this paper, it is shown that the model presented can be used to extract the characteristic parameters of the coupled system from experimental data. The number of fitting parame-ters in the model is reduced by determining the fundamental slave parameters through the conventional free-running response func-tion; these parameters are considered to be constant during the curve-fitting of the injection-locked system. Furthermore, in or-der to reduce the number of possible solutions generated during the least-squares-fitting process, the remaining fitting parameters are tightly constrained based on the physical limits of the coupled system. By reducing the number of unknown fitting parameters and constraining the remaining terms, a stronger confidence in the extracted parameters is achieved. Using a series of response curves measured from an injection-locked quantum dash laser, charac-teristic parameters of the system are extracted and validity of the model is examined. The verified model is used to analyze the im-pact of the linewidth enhancement factor on the characteristics of the response function in the microwave domain.
Index Terms—High-speed modulation, injection-locking, quan-tum dash, semiconductor laser.
I. INTRODUCTION
I
NJECTION-locking of semiconductor lasers is one of the most attractive research topics since this method induces su-perior improvement in the high-speed characteristics of directly modulated lasers such as increasing the modulation bandwidth, suppressing nonlinear distortion, relative intensity noise, mode hopping, and reducing chirp [1]–[7]. Previous work has focused on realizing high modulation bandwidths and associated design strategies, analyzed the modulation properties of the coupled system in the spectral domain, and numerically investigated the modulation response of the injection-locked system [4]–[11].Noting the benefits of extracting relevant operating parame-ters from measured data in order to aid in future simulations, this paper focuses on extracting the operating parameters from
Manuscript received November 1, 2008; revised January 24, 2009. First pub-lished May 12, 2009; current version pubpub-lished June 5, 2009. This work was supported by the U.S. Air Force Research Laboratory under Grant FA8750-06-1-0085. The work of N. Terry and V. Kovanis was supported by Air Force Office of Scientific Research (AFOSR) Laboratory Research Initiation Request (LRIR) 09RY04COR.
N. A. Naderi, M. Pochet, F. Grillot, and L. F. Lester are with the Cen-ter for High Technology MaCen-terials, University of New Mexico, Albuquerque, NM 87106 USA (e-mail: [email protected]; [email protected]; fgrillot@ chtm.unm.edu; [email protected]).
N. Terry and V. Kovanis are with the US Air Force Research Laboratory, 2241 Avionic Circle, Wright-Patterson Air Force Base (WPAFB), OH 45433 USA (e-mail: [email protected]; [email protected]).
Digital Object Identifier 10.1109/JSTQE.2009.2015334
an injection-locking system by introducing a novel modulation response function and experimentally verifying the validity of the resultant model in the microwave domain using a quantum dash (QDash) Fabry–Perot (FP) device as the slave laser. The extracted parameters of the coupled injection-locked system include the injection strength, linewidth enhancement factor, threshold gain shift, coupled phase offset between the master and slave laser, and the field enhancement factor that character-izes the deviation of the locked slave laser from its free-running value. This paper theoretically shows how the derived model incorporates nonlinear gain through the free-running damping rate and relaxation oscillation frequency, along with the impact of nonlinear gain compression for the QDash FP device under investigation, thereby accounting for the unique properties in-troduced by quantum dot physics. The validity of the model and accuracy of extracted terms are examined based on theoretically expected values for the fitting parameters at extreme detuning ranges. Lastly, the derived model is used to perform theoretical simulations to analyze the impact of the linewidth enhancement factor on the characteristics of the modulation response function.
II. THEORETICALMODEL
In order to understand the limiting factors in an injection-locked system, it is important to investigate the governing theory that can be obtained by modeling the characteristic parameters using a set of coupled rate equations [12]–[14]. Mathematical translation of the injection-locking system operating in the sta-ble locking regime based on three fundamental rate equations was first demonstrated by Lang [12]. This paper capitalizes on improvements to the rate equations governing the dynamic properties of an injection-locked system in order to investigate the modulation properties of such a system under strong injec-tion [8]–[10].
A. Rate Equations
The differential equations describing the dynamics of an injection-locked system have been developed by introducing terms describing the impact of optical injection to the conven-tional rate equations governing the free-running characteristics of the slave laser. The additional terms include a coupling value kc, the magnitude of the injected master field Ainj, and the
de-tuning frequency between master and slave∆ωinj. The model
assumes the slave laser is being directly modulated such that the small-signal approximation can be applied. Additionally, it is assumed that the laser has been exposed to a relatively strong external optical injection, such that the impact of the noise and
564 IEEE JOURNAL OF SELECTED TOPICS IN QUANTUM ELECTRONICS, VOL. 15, NO. 3, MAY/JUNE 2009
the spontaneous emission rate coupled to the lasing mode are negligible [10]. The free-running FP slave laser has cleaved facets and is biased well above threshold. As in the free-running case, the amplitude and phase equations arise from the funda-mental complex field rate equation. The variation of the slave field magnitude, phase offset between the master and slave fields and carrier density with time can be written as [8], [10]:
dA dt = ! g 2∆N " A + (kccos φ) Ainj (1) dφ dt = α ! g 2∆N " − ∆ωinj− (kcsin φ) Ainj A (2) dN dt = Jbias− γNN− (γP + g∆N) A 2 (3)
where A is the internal slave’s amplitude of the electric field, g is the differential gain, N is the carrier density, and ∆N = N− Nth is the shift in carrier density from the threshold. φ
is the phase offset between master and slave laser, which is defined as φslave− φmaster, the amplitude of the electric field
square A2 is proportional to photon density P , and Jbias, γ N,
γP correspond to the applied bias current density, inverse
dif-ferential carrier lifetime, and photon decay rates, respectively. It is important to note that the phase variation in time depends on detuning through∆ωinj= ωslave− ωmaster. The linewidth
enhancement factor α, injection strength, which is proportional to Ainj/A, phase offset φ, and detuning term ∆ωinjare the key
and defining injection parameters that have a significant impact on the coupled oscillator system.
B. Steady-State Solutions
The equations described in (1)–(3) define the temporal and dynamic behavior of the system. The injection-locking phe-nomenon is investigated through the steady-state solutions aris-ing from these three differential equations. Under steady-state, the right hand side of (1)–(3) is equal to zero as there will be no time variation in the slave’s field amplitude, phase, and carrier density. Using an approach presented by Murakami et al. [8], the steady-state parameters of the injection-locked system can be defined as the steady-state phase offset φ0, steady-state carrier
density N0, steady-state locked slave field A0, and the
free-running slave field Af r [10]. Based on this strategy, the first
general condition for the system under injection locking can be clearly found through (2) by introducing the steady-state parameters and setting the left hand side equal to zero:
∆ωinj= α2 (g∆N0) − (kcsin φ0)Ainj
A0 (4)
where the change in carrier density under steady-state condi-tion is expressed as∆N0 = N0− Nth. Note that for stability,
it is required that the change in the steady-state carrier density be less than zero∆N0 < 0. Equation (4) describes the
correla-tion between frequency detuning, threshold condicorrela-tion, and the strength of the injected field. It can be clearly seen that depend-ing on the detundepend-ing condition and the phase offset, the injected field can result in a threshold gain shift through g∆N0. Note
that the group velocity is implicit in the differential gain term g.
Using this method and solving the steady-state parameters of the coupled system, the relationship between the free-running and locked fields and also the expression for the steady-state phase offset can be expressed as [8], [10]:
A20 = ! A2f r−γγNP ∆N0 " ! 1 + g ∆ N0 γP " (5) φ0 = sin−1 # − ∆ωinj kc√1 + α2 A0 Ainj $ − tan−1α (6)
The steady-state slave field and the phase offset between the slave and master laser and its boundary can be further used to derive an expression for detuning∆ωinj. However, computing
the detuning value for a specific case is not possible unless the key parameters such as phase offset, linewidth enhancement factor, and injection strength can be extracted for that case.
C. Small-Signal Analysis (Dynamic Solutions)
A detailed approach to find the small-signal solution of the rate equations expressed in (1) through (3) has been demon-strated in the literature [8], [10]. Based on this method, the ab-solute modulation frequency response function can be expressed as: |H(ω)|2 = % % % %∆A∆J % % % % 2 = |M| 2&ω2+ Z2' (C − Aω2)2+ (Bω − ω3)2 (7)
where the parametric terms A, B, C, Z, and M can be defined and simplified as [10]:
A = 2η cos φ0+ γN + gA20
B = η2+ 2η cos φ0&gA20+ γN'+ gA20(γP − 2η cos φ0)
C = η2&γN + gA20'− gA20(γP − 2η cos φ0) Z
Z = η (α sin φ0− cos φ0)
M = g
2A0 (8)
The injection strength is proportional to the coupling term and the field ratio as:
η = kc
Ainj
A0 =
η0
RFE (9)
where η0 is the maximum injection ratio and RFE = A0/Afr
is the slave field enhancement factor due to injection. η0
incor-porates the external master to slave power ratio, the coupling efficiency between the slave and master laser, and efficiency of injected field entering the slave laser cavity due to facet re-flectivity. At this point, the enhancement of the slave field is introduced as an additional term denoted as the field enhance-ment factor, RFE, which takes into account the deviation of the
slave steady-state field magnitude compared to its free-running value at high injection ratios and specific frequency detuning.
D. Modulation Response Model
The modulation response model expressed in (7) and (8) can be used to simulate the modulation characteristics of an
injection-locking system in microwave domain. There are as many as eight fitting parameters involved in this model, and this large number of potentially unconstrained parameters al-lows for many possible solutions that will reduce confidence in extracted results. One of the goals of this paper is to reduce the number of fitting parameters through known free-running slave terms along with additional constraints on remaining injection-locking fitting terms. By doing so, the parametric terms A, B, C, and Z defined in (8) can be translated in terms of known free-running and injection-locked parameters. This reduces the number of fitting parameters and expresses the remaining pa-rameters in terms of the injection-locking operating papa-rameters, which then will be projected in the targeted relative modulation response function. Since the |M|2 term defined in (7) and (8) is independent of frequency, it can be cancelled in the relative modulation response form. The “A” term in (8) is effectively a damping rate of the coupled oscillator as follows:
A = γslave+ γth (10)
The slave damping rate γslave is related to the free-running
damping rate and scales with the field enhancement factor as: γslave = gA20+ γN = (γfr− γN)R2FE+ γN (11)
where γfr = gA2fr+ γN is the free-running slave damping rate
and γN is assumed to be independent of optical injection. The
explicit relationship between the locked and free-running damp-ing rates is a key feature of the current model and allows us to implicitly include nonlinear gain effects as explained below. γth
is the threshold gain shift and appears as a damping component, resulting from moving the slave from its free-running condition. It is also related to the phase offset and injection strength such that: γth = 2η cos φ0 = 2 ( η0 RFE ) cos φ0= −g∆N0 (12)
Again it is necessary to note that the group velocity is implicit in the differential gain term“g” everywhere in this derivation. Using (11) to substitute for the slave damping rate in (10) and rewriting the expression for “A”, we have:
A = (γfr− γN)RFE2 + γN + γth (13)
The second and most important term located in the denominator of the response function is “B”, which corresponds to the overall resonance frequency of the system. Substituting the threshold gain shift γth in the “B” term defined in (8) and rearranging
yields:
B = η2+ γth&gA20+ γN'+ gA20(γP − γth) (14)
The second term in (14), which is related to the steady-state slave locked field and carrier lifetime as (gA2
0+ γN), effectively
appears as a damping rate that can be directly linked to the slave damping rate, γslave. Using the definition in (11), this term can
be replaced as following:
B = η2+ γthγslave+ gA20(γP − γth) (15)
By multiplying both sides of the steady-state solution of the locked field found in (5) by the differential gain g and rearrang-ing γP on the right hand side, yields:
gA20 =gA
2
frγP − γNg∆N0
γP + g∆N0 (16)
The first term in the numerator gA2
frγp corresponds to the
free-running relaxation frequency squared ω2
r. Substituting the
threshold gain shift defined in (12) allows (16) to be rewritten as:
gA20 = ω 2
r+ γNγth
γP − γth (17)
Substituting (9), (11), and (17) into (15) and rearranging will give the following expression for the “B” term:
B =&ωr2+γNγth'+ ( η0 RFE )2 + γth*(γfr− γN) R2FE+ γN+ (18) For the case of zero injection, η is zero and (18) is equal to the relaxation frequency squared of the slave laser, B = ω2
r, which
simply represents the slave’s free-running operating condition. Similarly, by applying (9), (11), (12), and (17) into (8) and rearranging, “C” can be simplified and expressed as:
C = ( η0 RFE )2* (γfr− γN)R2FE+ γN+−&ωr2+ γNγth'Z (19) The “Z” term defined in (8) corresponds to the correlation be-tween the detuning phase offset and linewidth enhancement factor and can be expressed as:
Z = ( η 0 RFE ) (α sin φ0− cos φ0) (20)
By manipulating (7) and applying the parametric terms ex-pressed in (13) and (18)–(20), the relative modulation response function of a stably locked system can be expressed as:
|HR|2 = | H(ω)|2 |H(0)|2 = &C Z '2& ω2+ Z2' (C − Aω2)2+ (Bω − ω3)2 1 (1 + (ω/γc)2) (21) It is important to note that the response function expressed in (21) has a cubic frequency dependence. Also, depending on the detuning condition, either the B-containing or C/A-containing terms in the denominator may have a dominant impact on the overall resonance frequency. The second term in the denomina-tor accounts for the parasitic RC and carrier transport effects, where γcis considered as a free-running characteristic constant
that can be extracted along with other free-running parameters.
E. Identifying the Known Free-Running Operating Parameters
By taking into the account all the terms in (21), one finds that eight fitting parameters including ωr, γf r,γN, γth, η0, RFE, Z
and γcare needed for the simulation. All of the terms are
ex-pressed as angular frequencies except RFE. Compared to
566 IEEE JOURNAL OF SELECTED TOPICS IN QUANTUM ELECTRONICS, VOL. 15, NO. 3, MAY/JUNE 2009
approach that allows an easy comparison of the relative magni-tudes of the fitting parameters [8]. Since the model is comprised of multiple fitting parameters, there will be many solutions avail-able that can fit the experimental data. Most of these possible solutions can be eliminated by introducing proper restrictions to the operating parameters during least-squares-fitting, such that they can vary only in an acceptable physical range. However, restrictions are not enough to reach a reasonable level of ac-curacy of the model unless it is combined with a reduction of the freely varying fitting parameters. Fortunately, some of these parameters can be extracted from the intrinsic free-running pa-rameters, which can be determined from the slave laser operating characteristics.
The operating parameters of an uncoupled system (free-running slave) can be extracted from the standard and con-ventional modulation response model [15]:
|HR|2 = ωr4 (ω2 r− ω2)2+ γfr2ω2 · 1 1 + (ω/γc)2 (22) This expression is used to fit the free-running modulation re-sponse and extract three of the fitting parameters: the free-running relaxation oscillation frequency ωr, the free-running
damping rate γfr, and the parasitic roll-off induced by γc. These
parameters are intrinsic characteristics of the slave laser and re-main unchanged when the system is injection-locked. The other fitting parameter found in the free-running characteristics is the inverse differential carrier lifetime γN. This term can be directly
extracted by plotting the known free-running damping rates as a function of the corresponding relaxation oscillation frequen-cies through the conventional expression γfr= Kfr2+ γN [16].
Knowing the value of γN is beneficial, since it may have a
sig-nificant impact on the high-frequency behavior of the system un-der modulation. Consequently, the number of fitting parameters can be reduced from eight to four by keeping the free-running terms constant during the simulation. Further constraints on the remaining fitting parameters are found by considering the theo-retical limits of semiconductor physics.
III. EXPERIMENTALDATA ANDCURVE-FITTINGRESULTS
A. Experimental Setup and Data
Fig. 1 shows a schematic view of the injection-locking setup used in the experiment. The slave laser was a multimode QDash FP grown on an n+-InP substrate. A detailed description of the
slave laser structure is provided elsewhere [17]. The laser has a 4-µm-wide ridge waveguide and 500-µm-cleaved cavity length. The nominal emission wavelength of this FP device is around 1560 nm, and the threshold current was measured to be 45 mA at room temperature. The output power of the slave laser was carefully coupled into a single-mode polarization maintaining (PM) lensed fiber using a piezoelectric stage controller with sub-micron accuracy. The coupling efficiency of the slave laser into the PM lensed fiber was >40%. The PM lensed fiber was con-nected to port 1 of a three-port PM circulator. The master laser used in this experiment was a tunable external cavity laser (New Focus 6200) with a single-mode PM fiber pigtail connected to the second arm of the circulator, port 2. A high resolution
Fig. 1. Schematic view of the injection-locking QDash experimental setup.
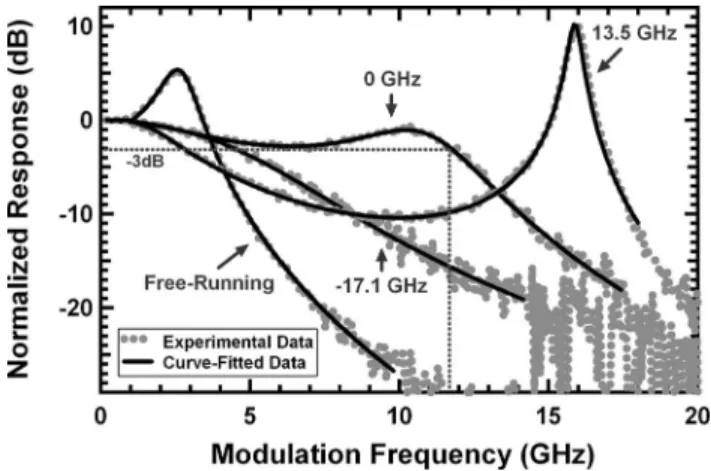
Fig. 2. Modulation responses of the free-running and the injection-locked laser under zero and extreme frequency detuning conditions.
(0.01 nm) optical spectrum analyzer (Ando AQ6317B) was connected to port 3 of the circulator to measure the detuning between the master and slave lasers, as well as to identify stably locked conditions.
Port 3 of the circulator was connected to a high-speed detec-tor through which the relative modulation response (S21) was
also measured using an HP 8722D network analyzer. The 5/95 beam splitter at port 3 of the circulator allowed to measure the modulation response of the injection-locked laser while simul-taneously monitoring the detuning. This ensured that the desired detuning was stable throughout the experiment.
The modulation responses for various frequency detuning scenarios are provided in Fig. 2. The injected power provided by the master laser at the slave arm (port 1 of the circulator) and the total slave power at both facets was measured to be 3.5 and 4.7 dBm, respectively. The side mode suppression ratio (SMSR) for stable locking was taken to be 30 dB; using this criterion, stable locking was observed for detuning frequencies from 13.5 to −17.1 GHz. At the zero frequency detuning condi-tion, a 3-dB modulation bandwidth of 11.7 GHz was observed, which corresponds to a three-fold improvement relative to the free-running case. At the positive frequency detuning edge, the measured modulation response exhibits a large sag as well as a high-resonance peak. Due to significant damping, only a slight improvement in the modulation bandwidth is observed for the negative frequency cases.
Fig. 3. Free-running damping factor as a function of the relaxation oscillation frequency squared.
B. Determining the Free-Running Parameters and the Nonlinear Effects
As mentioned in the previous section, reducing the number of fitting parameters and applying reasonable constraints to the remaining fitting parameters improves the confidence in least-squares-fitting results by decreasing the number of possible so-lutions. In this case, the free-running slave parameters were ob-tained by fitting the free-running response curves measured for the QDash FP device to the conventional modulation response function expressed in (22). This examination of the free-running laser operating at a bias current of 60 mA yielded a free-running relaxation oscillation frequency of fr = 2.7 ± 0.02 GHz, a
free-running damping rate of γfr = 7.4 ± 0.32 GHz and a parasitic
RC rate of γc= 67 ± 0.4 GHz. The error for the free-running
values were measured based on a one standard deviation con-fidence interval and are observed to be less than 5% of their extracted values. In addition to these three values, the inverse differential carrier lifetime γN was found by plotting the
free-running damping rate as a function of the relaxation oscillation frequency squared f2
r as shown in Fig. 3. The corresponding
value for γN is determined at the intersection of the plotted data
with y-axis and was found to be approximately 6 ± 0.3 GHz. The K-factor, which is found from the slope of the curve in Fig. 3, is 0.45 ns and includes the effects of nonlinear gain compression in the usual manner [16], [18].
The impact of nonlinear gain on the free-running relaxation oscillation frequency can be studied through the following rela-tion [19], [20]: fr2 = CPout 1 + εpPout = CPout 1 + Po u t Ps a t (23) where εp is the gain compression factor related to the output
power Poutand C is a fitting constant. The ratio of Pout/Psat
estimates the impact of gain compression factor at a given out-put power through the introduction of the saturation power Psat.
Based on the relation described in (23), the impact of nonlin-ear gain compression is incorporated into the injection-locking model through the free-running relaxation oscillation frequency, which will be kept constant during simulation. Fig. 4 shows the
Fig. 4. Square of relaxation oscillation frequency versus the slave output power.
variation of the relaxation oscillation frequency squared as a function of the output power for the QDash device. Using (23) to fit the experimental data illustrated in Fig. 4 results in a sat-uration power of Psat∼17mW, a gain compression factor of
εp∼6 × 10⁻²mW−1, and a maximum free-running relaxation
oscillation frequency of 7.6 GHz [20].
C. Fitting Parameter Constraints
In order to reduce the number of possible solutions in this curve-fitting, it is necessary to put additional constraints on the four remaining fitting parameters, γth, RFE, η0, and Z, that
are introduced by the injection-locking state. Due to the inter-relationship between these four parameters, constraining them reduces to restricting φ0, η0, RFE, and α. This transformation
is important because the α of the investigated QDash FP laser has been found to change from ∼1.0 to 11 above threshold [21]. The constraints on the phase offset φ0 are based on the
al-lowed locking range through the threshold condition and con-sidering (6). The result is that the phase offset varies between −π/2 for positive frequency detuning up to cot−1α for negative
frequency detuning. At the extreme positive frequency detun-ing case, the phase offset between the master and slave should be −π/2. According to the phase condition at the positive fre-quency detuning edge, the value of the field enhancement factor RFE should be 1, since the slave’s steady-state field matches
the free-running field due to the 90◦ phase offset between the
master and slave. For all other possible values of detuning, RFE
is greater than 1.
The maximum injection ratio η0 can be extracted directly
from known device characteristics and controllable parameters in the experimental setup. Using the fiber coupling efficiency ηc, the external power ratio Rext (ratio of the master to the
slave power measured outside of the slave’s front facet), cavity length L, and front facet reflectance r of the FP slave laser, the maximum injection ratio is given as [22]:
η0 =2nc gL & 1 − r2' r , ηcRext (24)
where c is the speed of light in free space and ng is the optical
568 IEEE JOURNAL OF SELECTED TOPICS IN QUANTUM ELECTRONICS, VOL. 15, NO. 3, MAY/JUNE 2009
of 0.05 cm, group index of 3.5, a mirror reflectivity of R = r2 = 32% for the cleaved facet, a coupling efficiency of 0.6 and an external power ratio of 1.5, the maximum injection ratio η0 was found to be 98 GHz. As the coupling efficiency was
carefully maintained during these experiments, the maximum injection ratio was kept constant throughout the experiment. Since physically the threshold gain shift γth cannot exceed the
photon decay rate γP, it is also important to verify that the
calculated2η0 is less than γP, which in this case is 247 GHz.
The value of the linewidth enhancement factor for this de-vice can be separately measured by using the injection-locking technique [20], [23]. The advantage of this method over other α-measurement techniques is that no fitting parameters are re-quired, which reduces the uncertainty of the measurement. This method takes advantage of the asymmetry in the stable locking region over a range of detuning on both the positive and nega-tive side of the locked mode. Based on this technique and under the strong injection, the linewidth enhancement factor α can be found using the following expression [23]:
α = -(∆f neg ∆fpos )2 − 1 (25)
where∆fnegand∆fposcorrespond to the negative and positive
frequency detuning ranges, which are determined by a SMSR limit of 30 dB. It is important to note that the value of SMSR is arbitrarily chosen depending on the limitations of the ex-periment. In this case, the SMSR is chosen large enough such that the weak side modes of the slave laser that are next to the injection-locked mode are always observable above the noise floor. Furthermore, for cases when the SMSR is chosen below 30 dB, these side modes may have a significant influence on the injection-locking stability boundary, causing an unreliable measurement for α [24].
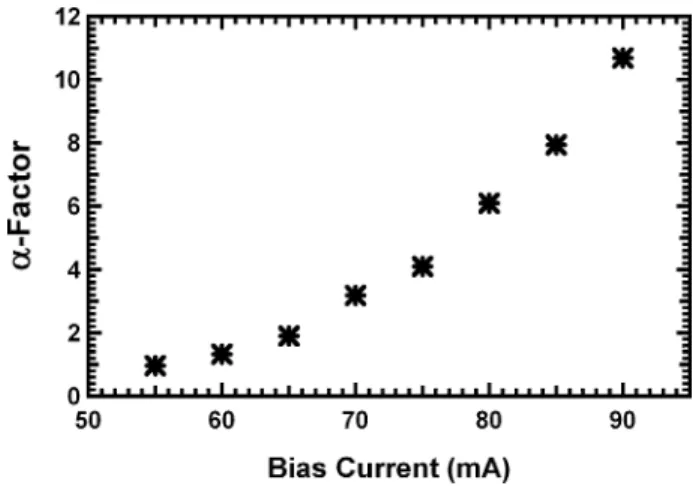
Using this method, the value of the linewidth enhancement factor can be measured through injection-locking boundaries for a specific applied bias current. Fig. 5 shows the variation of the linewidth enhancement factor as a function of applied bias current for this device, which increases from ∼1.0 to 11 as the applied bias current is increased from its threshold value to 90 mA. According to the results obtained from this measure-ment, the value of the linewidth enhancement factor is allowed to fluctuate as the detuning is adjusted based on the observation of large variations in the linewidth enhancement factor for this device, and attributed to the carrier density not being clearly clamped at threshold in the QDash FP laser under test [21]. This is one of the major differences in modeling the injection-locking behavior of the QDash laser.
D. Curve-Fitting Results
The parameters that were allowed to vary in the curve-fitting included the linewidth enhancement factor α, phase offset be-tween the master and slave laser φ0and field enhancement factor
RFE. All other fitting parameters are fixed and the curve-fitting
constraints are summarized in Table I. The error for the param-eters given in Table I was not carried forward into the least-squares-fitting of the coupled system as they were less than 5%
Fig. 5. Variation of the linewidth enhancement factor as a function of applied bias current in the QDash FP laser.
TABLE I
FIXEDFITTINGPARAMETERS ANDSUMMARY OFCONSTRAINTSUSED IN THE
LEAST-SQUARES-FITTINGUNDER ABIASCURRENT OF60 mA
and thus considered to be negligible. Least-squares curve-fits of the experimental data using the modulation response function presented in (21) and parametric terms described in (13), (18)– (20) are shown in Fig. 2. The free-running device parameters were held constant in the modulation response function ex-pressed in (21). The maximum injection ratio was constrained to be 98 GHz, as the coupling efficiency was carefully main-tained during the measurements. The extracted phase shift was constrained between −π/2 and cot−1α. The field enhancement
factor, phase offset, and linewidth enhancement factor were di-rectly extracted through curve-fitting using (21), and the thresh-old gain shift was calculated for each detuning case by using (12). The operating parameters extracted through least-squares-fitting data collected for various measured detuning cases are presented in Table II. The error based on a one standard devi-ation confidence interval is also shown in Table II. The error associated with α, RFE, γth, and φ0 are observed to be
negli-gible for all detuning values away from the negative frequency detuning boundary. As the negative frequency detuning bound-ary is approached, the error increases for the extracted parame-ters. This is because, as shown in Fig. 2, the response becomes over-damped, which decreases the amount of information that can be extracted from a least-squares-fit of the corresponding modulation responses. Simulations using (21) show that as φ0
approaches zero, changes to the values of α, RFE, and γthresult
in only minor changes to the modulation response.
The calculated values for the threshold gain shift γth show
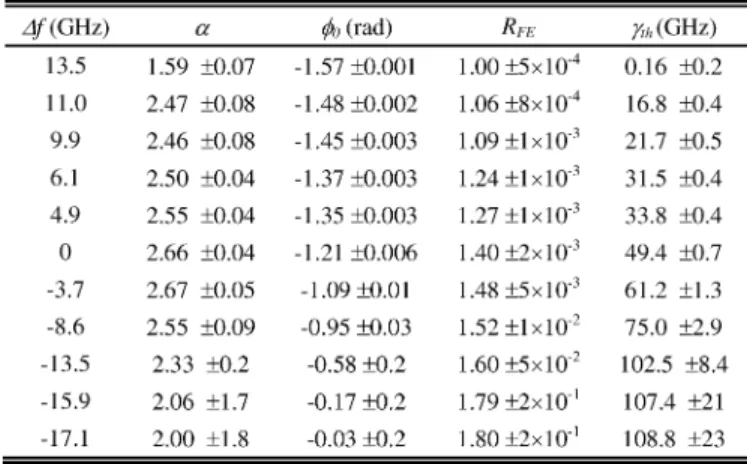
TABLE II
EXTRACTEDINJECTION-LOCKINGOPERATINGPARAMETERS FROMLEAST-SQUARES-FITTING OFEXPERIMENTALDATAWITHRESPONSE
MODEL IN(21)
conditions. This trend is consistent with the induced thresh-old shift increasing as the injected and slave fields become more and more in phase from positive to negative frequency detuning. The fitting results also show that the value of the field en-hancement factor RFE increases as the frequency detuning is
reduced from the positive edge to the negative edge. This trend corresponds to theory describing an increase in the slave laser steady-state power under negative detuning conditions [22]. The extracted phase shift results are consistent with the theory stat-ing that stable lockstat-ing occurs for phase ranges from −π/2 to cot−1α. The extracted values of the linewidth enhancement
factor for different detuning cases vary consistently within the expected range, which was measured separately for this device as reported in Fig. 5.
As also shown in Table II, the extracted values of the linewidth enhancement factor vary with detuning within the experimental error range. This leads to the conclusion that the linewidth en-hancement factor can be manipulated by adjusting the detuning condition.
E. Model-Based Analysis
With the validity of the modulation response model verified based on experimental data, it can be used to predict injection-locking behaviors for any FP slave laser once its free-running parameters are known.
By knowing the operating parameters of the system, it is then possible to predict the optimum operating limits of the device such as particular detuning frequencies and the maximum pos-sible bandwidth. One key parameter having a prominent effect on the modulation response is the linewidth enhancement fac-tor. The undesirable sag observed in the modulation response for the extreme positive frequency detuning, as shown experi-mentally in Fig. 2, can be removed by increasing the linewidth enhancement factor and keeping the same injection ratio.
In Fig. 6, the change in the modulation response un-der extreme positive frequency detuning due to a change in the linewidth enhancement factor is illustrated theoreti-cally. At the positive frequency detuning edge, the phase
off-Fig. 6. Simulations of the modulation response function for various values of the linewidth enhancement factor.
Fig. 7. Experimental observation of the varied sag as the linewidth enhance-ment factor is increased.
set is roughly −π/2 causing the threshold gain shift to ap-proach zero, γth → 0, and the field enhancement becomes
unity, RFE= 1. The maximum injection ratio and the
free-running fitting parameters are kept constant for all three cases. Values used in Fig. 6 were based on the extracted physical parameters for the injection-locked QDash FP device under test at extreme positive frequency detuning. The phase off-set of φ0 ≈ −π/2 (−1.57 rad), threshold gain shift of γth =
0.16 GHz, and the field enhancement factor of RFE = 1 were
kept constant for all three cases. Ideally, since the linewidth enhancement factor varies significantly in this device (1.0–11) based on the bias current, the sag in the modulation response should be removable assuming a high enough injection power is available to maintain a constant injection ratio. The signifi-cance of this observation is that because the highest relaxation oscillation frequency and hence the highest possible modula-tion bandwidth occur at the positive frequency detuning edge, removing the sag will achieve the highest possible modula-tion bandwidth for the injecmodula-tion-locked system. Fig. 7 experi-mentally demonstrates this trend, showing modulation response curves at the extreme positive frequency detuning edge for bias currents of 60, 70, and 80 mA and linewidth enhancement factor of 1.3, 3.2, and 6.1, respectively, as shown in Fig. 5. The sag is shown to be reduced as the bias current, and correspondingly
570 IEEE JOURNAL OF SELECTED TOPICS IN QUANTUM ELECTRONICS, VOL. 15, NO. 3, MAY/JUNE 2009
the linewidth enhancement factor, is increased. Based on the theoretical model expressed in (21) and depending on how the B-containing and C/A-containing terms in the denominator in-teract, the sag reduces as their resonances detune from each other due to the change in the linewidth enhancement factor at different bias levels. The maximum injection ratio for the 60, 70, and 80 mA cases was calculated by (24) to be 103, 116, and 107 GHz, respectively. Note that although the peak frequency decreases as the bias current is increased, the magnitude of the peak remains relatively constant. The decrease in the observed relaxation oscillation frequency is likely due to the increased device heating as the bias current is increased, along with an increased cavity mode shift, which is driven by the linewidth enhancement factor as given in (4).
IV. CONCLUSION
Using a small-signal analysis of three coupled rate equations describing an injection-locked system, a novel modulation re-sponse function is demonstrated, which successfully models the key operating parameters of the system. It is shown that the model implicitly incorporates the nonlinear gain through the relaxation oscillation frequency and damping rate of the free-running slave laser. The impact of gain compression is evaluated for the slave device using a conventional technique that examines the variation of the square of the relaxation oscil-lation frequency as a function of output power. The presented model can be used to confidently extract microwave character-istics and operating parameters of the injection-locked system by reducing the number of fitting parameters and providing the acceptable physical constraints on the remaining fitting terms. This eliminates unwanted solutions resulting from curve-fitting and leads to a stronger confidence on the resultant extracted parameters.
Using this method, the characteristic parameters of an injection-locked system were extracted for a QDash FP slave laser. The validity of the model was examined based on the extracted value’s correlation with theoretically expected values. The extracted parameters included the maximum injection ra-tio, linewidth enhancement factor, and threshold gain shift. As opposed to previous works, which primarily focused on analyz-ing experimental data in the spectral domain [4]–[7], this model demonstrates reliable curve-fitting results in the microwave do-main. Finally, the model not only showed how the linewidth enhancement factor impacted the observed sag in the modu-lation response function, but also indicated how the sag can be virtually eliminated at higher bias current in a QDash FP laser.
The views expressed in this article are those of the author and do not reflect the official policy or position of the United States Air Force, Department of Defense, or the U.S. Government.
REFERENCES
[1] F. Mogensen, H. Olesen, and G. Jacobsen, “FM noise suppression and linewidth reduction in an injection-locked semiconductor laser,” Electron.
Lett., vol. 21, pp. 696–697, Aug. 1985.
[2] N. Schunk and K. Petermann, “Noise analysis of injection-locked semi-conductor injection lasers,” IEEE J. Quantum Electron., vol. QE-22, pp. 642–650, May 1986.
[3] I. Petitbon, P. Gallion, G. Debarge, and C. Ghabran, “Locking bandwidth and relaxation oscillation of an injection-locked semiconductor laser,”
IEEE J. Quantum Electron., vol. 24, no. 17, pp. 148–154, Aug. 1988. [4] T. B. Simpson, J. M. Liu, and A. Gavrielides, “Bandwidth enhancement
and broadband noise reduction in injection-locked semiconductor lasers,”
IEEE Photon. Technol. Lett., vol. 7, no. 7, pp. 709–711, Jul. 1995. [5] T. B. Simpson, J. M. Liu, and A. Gavrielides, “Small-signal analysis
of modulation characteristics in a semiconductor laser subject to strong optical injection,” IEEE J. Quantum Electron., vol. 32, no. 8, pp. 1465– 1468, Aug. 1996.
[6] T. B. Simpson and J. M. Liu, “Enhanced modulation bandwidth in injection-locked semiconductor lasers,” IEEE Photon. Technol. Lett., vol. 9, no. 10, pp. 1322–1324, Oct. 1997.
[7] J. M. Liu, H. F. Chen, X. J. Meng, and T. B. Simpson, “Modulation bandwidth, noise, and stability of a semiconductor laser subject to strong injection locking,” IEEE Photon. Technol. Lett., vol. 10, no. 10, pp. 1325– 1327, Oct. 1997.
[8] A. Murakami, K. Kawashima, and K. Atsuki, “Cavity resonance shift and bandwidth enhancement in semiconductor lasers with strong light injection,” IEEE J. Quantum Electron., vol. 39, no. 10, pp. 1196–1204, Oct. 2003.
[9] L. Chrostowski, B. Faraji, W. Hofmann, M. C. Amann, S. Wieczorek, and W. W. Chow, “40 GHz Bandwidth and 64 GHz resonance frequency in injection-locked 1.55 µm VCSELs,” IEEE J. Sel. Top. Quantum Electron., vol. 13, no. 5, pp. 1200–1208, Sep. 2007.
[10] E. K. Lau, H. K. Sung, and M. C. Wu, “Frequency response enhancement of optical injection locked lasers,” IEEE J. Quantum Electron., vol. 44, no. 1, pp. 90–99, Jan. 2008.
[11] E. K. Lau, X. Zhao, H. K. Sung, D. Parekh, C. Chang-Hasnain, and M. C. Wu, “Strong optical injection-locked semiconductor lasers demon-strating >100-GHz resonance frequencies and 80-GHz intrinsic band-widths,” Opt. Exp., vol. 16, pp. 6609–6618, Apr. 2008.
[12] R. Lang, “Injection locking properties of a semiconductor laser,” IEEE
J. Quantum Electron., vol. QE-18, no. 6, pp. 976–983, Jun. 1982. [13] F. Mogensen, H. Olesen, and G. Jacobsen, “Locking conditions and
sta-bility properties for a semiconductor laser with external light injection,”
IEEE J. Quantum Electron., vol. QE-21, no. 7, pp. 784–793, Jul. 1985. [14] C. H. Henry, N. A. Olsson, and N. K. Dutta, “Locking range and stability
of injection locked 1.54 µm InGaAsP semiconductor lasers,” IEEE J.
Quantum Electron., vol. QE-21, no. 8, pp. 1152–1156, Aug. 1985. [15] P. Bhattacharya, D. Klotzkin, O. Qasaimeh, W. D. Zhou, S. Krishna,
and D. H. Zhu, “High-speed modulation and switching characteristics of In(Ga)As-Al(Ga)As self-organized quantum-dot lasers,” IEEE J. Sel. Top.
Quantum Electron., vol. 6, no. 3, pp. 426–438, May/Jun. 2000. [16] R. Olshansky, P. Hill, V. Lanzisera, and W. Powazinik, “Frequency
re-sponse of 1.3µm InGaAsP high speed semiconductor laser,” IEEE J.
Quantum Electron, vol. QE-23, no. 9, pp. 1410–1418, Sep. 1987. [17] Y. Li, N. A. Naderi, V. Kovanis, and L. F. Lester, “Modulation response of
an injection-locked 1550 nm quantum dash semiconductor laser,” in Proc.
IEEE Lasers Electro-Opt. Soc. Conf., Oct. 21–25, 2007, pp. 498–499. [18] J. E. Bowers, “High speed semiconductor laser design and performance,”
Solid-State Electron., vol. 30, pp. 1–11, 1987.
[19] H. Su and L. F. Lester, “Dynamic properties of quantum dot distributed feed back lasers: High speed, linewidth and chirp,” J. Phys. D: Appl.
Phys., vol. 38, pp. 2112–2118, Jun. 2005.
[20] F. Grillot, N. A. Naderi, M. Pochet, C.-Y. Lin, and L. F. Lester, “Variation of the feedback sensitivity in a 1.55-µm InAs/InP quantum dash Fabry-Perot semiconductor laser,” Appl. Phys. Lett., vol. 93, pp. 191108-1– 191108-3, Nov. 2008.
[21] F. Grillot, B. Dagens, J. G. Provost, H. Su, and L. F. Lester, “Gain com-pression and above threshold linewidth enhancement factor in 1.3-µm InAs-GaAs quantum-dot lasers,” IEEE J. Quantum Electron, vol. 44, no. 10, pp. 946–951, Oct. 2008.
[22] E. K. Lau, “High-speed modulation of optical injection-locked semicon-ductor lasers,” Ph.D. dissertation, UC Berkeley, Dec. 2006.
[23] G. Liu, X. Jin, and S. L. Chuang, “Measurement of linewidth enhance-ment factor of semiconductor lasers using an injection-locking technique,”
IEEE Photon. Technol. Lett., vol. 13, no. 5, pp. 430–432, May 2001. [24] C. Dziak, A. J. Moscho, Y. Li, M. Fanto, V. Kovanis, J. Malowicki, and
L. F. Lester, “Measurement of the linewidth enhancement factor of a 1550-nm injection-locked quantum dash laser,” in Proc. IEEE Lasers
Nader A. Naderi (S’06) received the B.Sc. degree in applied physics from the
Science University of Mashhad, Mashhad, Iran, and the M.Sc. degree (with distinction) in optoelectronics in 2007 from the University of New Mexico, Albuquerque, where he is currently working toward the Ph.D. degree at the Center for High Technology Materials.
He is currently with the University of New Mexico, where he is engaged in high-speed characteristics of semiconductor lasers. His current research interests include investigating the optical injection-locking technique on Fabry–Perot and DFB lasers and the impact of optical-feedback phenomenon on semiconductor lasers of various quantum structures.
Mike Pochet received the B.Sc. degree in electrical engineering from Virginia
Polytechnic Institute and State University, Blacksburg, in 2001, and the M.Sc. degree in electrical engineering from the Air Force Institute of Technology (AFIT), Wright-Patterson Air Force Base, OH, in 2006. He is currently working toward the Ph.D. degree at the University of New Mexico, Albuquerque, through the Air Force’s AFIT Civilian Institution Program.
His current research interests include high-speed semiconductor lasers.
Fr´ed´eric Grillot (S’01–M’06) was born in Versailles, France, on August 22,
1974. He received the M.Sc. degree in physics from Dijon University, Dijon, France, in 1999, and the Ph.D. degree in electrical engineering from Besanc¸on University, Besanc¸on, France, in 2003.
He was with the Optical Component Research Department, Alcatel. He studied the effects of the optical feedback in semiconductor lasers, and the impact this phenomenon has on optical communication systems for high-bite-rate transmissions. From May 2003 to August 2004, he was with the Institut d’Electronique Fondamentale, University of Paris-Sud, where he was engaged in integrated optics modeling and Si-based passive devices for optical interconnects and telecommunications. In September 2004, he was appointed to the Institut National des Sciences Appliqu´ees de Rennes (INSA), Rennes, France, where he is currently an Associate Professor in the Materials and Nanotechnologies (MNT) Department. Since 2008, he has also been a Visiting Research Professor of electrical engineering at the University of New Mexico, Albuquerque, where he is leading research in optical science and optoelectronics at the Center for High Technology Materials. His current research interests include advanced laser diodes emitting at 1.55 µm using new materials like quantum dots for low-cost applications.
Dr. Grillot is a Member of the IEEE-Lasers and Electro-Optics Society (LEOS) and the la Soci´et´e Franc¸aise d’Optique.
Nathan B. Terry received the B.Sc. and M.Sc. degrees in physics from Brigham
Young University, Provo, UT, in 2000 and 2001, respectively, and the Ph.D. degree in applied physics from the Air Force Institute of Technology (AFIT), Wright-Patterson Air Force Base, OH, in 2007.
He is currently with the US Air Force Research Laboratory, Wright-Patterson Air Force Base (WPAFB), OH. He was engaged in numerical and experimental studies of Raman fiber lasers and Raman fiber amplifiers. His current research interests include high-speed semiconductor lasers.
Vassilios Kovanis received the B.S. degree in physics at the University of
Athens, Athens, Greece, in 1983, the Graduate degree from Temple University, Philadelphia, PA, and the Ph.D. degree in condensed matter theory from the University of New Mexico, Albuquerque.
In September 1989, he joined the Non-Linear Optics Center, Air Force Weapons Laboratory, Kirtland Air Force Base, NM, and remained for the next 11 years, working on multiple projects of optical and electronic technologies. He also held research faculty positions with the Applied Mathematics and the Electrical Engineering Departments, University of New Mexico, and was a National Research Council Fellow between 1992 and 1994. He was also a Senior Research Scientist with corporate Research and Development Laboratories, Corning, Inc., Corning, NY, where he managed technical interactions with telecommunications system houses. He was also the Program Manager for next-generation photonic product development with BinOptics Corporation, Ithaca, NY. Between 2003 and 2005, he was a member of the faculty at the Applied Mathematics Department, Rochester Institute of Technology. In June 2005, he returned to the Air Force Research Laboratory, Wright-Patterson Air Force Base, OH, where he is currently with the Photonics Technologies Branch, Sensors Directorate. He has authored extensively on issues of optical injection locking, coherence collapse, optical coupling of semiconductor lasers as well in controlling, synchronizing, and communicating with chaotic waveforms.
Luke F. Lester (SM’00) received the B.S. degree in engineering physics and
the Ph.D. degree in electrical engineering from Cornell University, Ithaca, NY, in 1984 and 1992, respectively.
He worked as an Engineer for the General Electric Electronics Labora-tory, Syracuse, NY, where he worked on high-electron-mobility transistors for millimeter-wave applications. He is currently the Microelectronics Endowed Chair Professor in the Department of Electrical and Computer Engineering and an Associate Director of the Center for High Technology Materials, Uni-versity of New Mexico (UNM), Albuquerque. He has over 20 years expe-rience in III–V semiconductor materials and devices and was a Co-Founder and the Chief Technology Officer of Zia Laser, Inc., a startup company us-ing quantum dot laser technology to develop products for communications and computer/microprocessor applications. He is the author or coauthor of 80 jour-nal articles and more than 100 conference papers. His current research interests include quantum dot lasers, mode locking, injection locking, quantum dot solar cells, and III–V semiconductor processing.
Dr. Lester is an organizer of the Lasers and Electro-Optics Society (LEOS) conferences, workshops, and journals. He was an US Air Force Summer Faculty Fellow in 2006 and 2007. He was awarded the 1998 UNM School of Engineer-ing Research Award, the 1994 Martin Marietta Manager’s Award, and the 2007 UNM Electrical and Computer Engineering (ECE) Teaching Award.