HAL Id: hal-01596703
https://hal.archives-ouvertes.fr/hal-01596703
Submitted on 28 Sep 2017
HAL is a multi-disciplinary open access
archive for the deposit and dissemination of
sci-entific research documents, whether they are
pub-lished or not. The documents may come from
teaching and research institutions in France or
abroad, or from public or private research centers.
L’archive ouverte pluridisciplinaire HAL, est
destinée au dépôt et à la diffusion de documents
scientifiques de niveau recherche, publiés ou non,
émanant des établissements d’enseignement et de
recherche français ou étrangers, des laboratoires
publics ou privés.
Identifying the relationships between the visualization
context and representation components to enable
recommendations for designing new visualizations
Alma Cantu, Olivier Grisvard, Thierry Duval, Gilles Coppin
To cite this version:
Alma Cantu, Olivier Grisvard, Thierry Duval, Gilles Coppin. Identifying the relationships between
the visualization context and representation components to enable recommendations for designing
new visualizations. IV 2017 : 21st International Conference on Information Visualisation, Jul 2017,
Londres, United Kingdom. pp.20 - 28, �10.1109/iV.2017.55�. �hal-01596703�
DRAFT
Identifying the Relationships Between the
Visualization Context and Representation
Components to Enable Recommendations for
Designing New Visualizations
Alma Cantu∗†, Olivier Grisvard∗†, Thierry Duval∗, Gilles Coppin∗
∗ IMT Atlantique, Lab-STICC, Univ. Bretagne Loire,
Technopˆole Brest-Iroise, 29238 Brest, France
{alma.cantu, olivier.grisvard, thierry.duval, gilles.coppin}@imt-atlantique.fr
† Thales Airborne Systems,
10 avenue de la 1`ere DFL, 29238 Brest, France
Abstract—In this paper we address the question of the rela-tionships between visualization challenges and the representation components that provide solutions to these challenges. Our ap-proach involves extracting such relationships through an identifi-cation of the context and the components of a significant number of representations and a comparison of the result to existing theoretical studies. To make such an identification possible, we rely on a characterization of the representation context based on a thoughtful aggregation of existing characterizations of the data type, the tasks and the context of use of the representations. We illustrate our approach on a use-case with examples of a relationships extraction and of a comparison of that relationships to the theory. We believe that the establishment of such relation-ships makes it possible to understand the mechanisms behind the representations, in order to build a representation design recommendation tool. Such a tool will enable us to recommend the components to use in a representation, given a visualization challenge to address.
Keywords-Visualization Process, Characterization Survey, Mul-tidimensional Data, Task Taxonomies
I. INTRODUCTION
Although the field of data visualization has been widely studied, it still has many challenges to face, such as dealing with huge amounts of data [15]. Based on the fact that each component of a visual representation solves a specific aspect of a given challenge, we believe that existing visual representations contain keys solving new challenges. If we identify relationships between representation components and the aspects of the challenge that they solve, we can decompose the new challenges, identify aspects that have already been solved by the field, and design a solution based on the corresponding components. Cases where new challenges have no common aspects with old ones are also informative, as they highlight specific needs for new components.
In this paper we present an approach to build a repository containing the relationships between representation compo-nents and challenge aspects. This repository is built through theoretical foundations and through the analysis of numerous
existing representations, for the purposes of supporting the design of visualizations that solve new challenges. In section II, we identify the main parameters of a visualization challenge by analyzing the visualization process. In section III, we characterize each of the parameters identified with the help of both individual existing characterizations and aggregations of existing characterizations, in order to list the challenge aspects. Then, in section IV, we identify the components of the existing representation and finally, in section V, we present how we extract relationships between challenge aspects and components of existing representations to build the repository.
II. IDENTIFICATION OF THE MAIN ASPECTS OF VISUALIZATION CHALLENGES
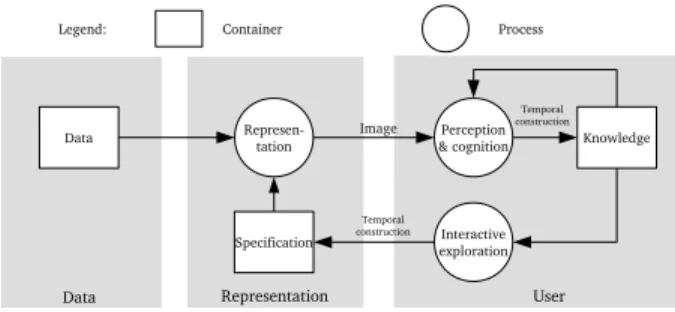
To describe a visualization challenge requires answering the three generic questions: why, what and how regarding the context of a representation. Visual representation being a part of the whole visualization process, representation is entirely conditioned by this process. As such, accessing the representation context requires identifying the factors that impact the visualization process. In this section we identify the main aspects of visualization challenges by identifying these factors.
As Chen and J¨anicke [9] did in their information flow description, we can first identify the factors that impact the visualization as noise over sub-processes. We identify noise over viewing, perception and cognition, which designates the context of use as one of the parameters of representations. Vickers et al. [34] address this issue from a more theoretical point of view, explaining that visualization states refer to models. As such, the parameters of these models correspond to the required parameters. Vickers et al. highlight a data model and a question model that designate the data type and the tasks as parameters of the representations. Applying this analysis to van Wijk’s process [33], [28], which is a more generic visualization process, we confirm the identification of the three elements: the data (the data type), the user perception and
DRAFT
Data Specification Knowledge Represen tation Perception & cognition Interactive exploration Data Image Temporal construction Representation User Legend: Container ProcessTemporal construction
Fig. 1. The visualization process according to van Wijk
action (the context of use), and the user needs (the tasks) (see figure 1). We compare this result with the empiric parameters described by Pfitzner [24] as the data type, the user’s expertise, the context (user’s experience, history, intention, need, and device) and the task type. According to Coutaz and Thevenin [31], the context of use contains the user’s expertise, the environment and the device, such that the proposed parameters match every aspect of the empirical description. Thanks to the existing visualization process definitions and parameter descriptions, we identify three main characteristics of the representation context: the data type, the task type (as a transcription of the user’s need) and the context of use (in-cluding the user’s expertise, the environment and the device). As such, in order to describe a visualization challenge, we need to establish the values of the data type, the task type and the context of use for the issue that we aim to solve. So the next step of our approach is to identify which values these characteristics can take to allow such a description.
III. CHARACTERIZATION OF THE CONTEXT OF VISUAL REPRESENTATIONS
In this section we detail the three parameters that have been identified in section II to characterize the context of visual representations. This characterization consists of a series of enumerations such that we could easily implement it in a tool that would recommend visual representations. For practical use, we associate these enumerations with a specific iconography.
A. Data type
To address the various data characteristics that have an impact on the representation, we first characterize the data with respect to its volume. Then we define the data in terms of structural organization. Finally, we focus on the properties of the data attributes through their cardinality, their structural properties and their nature.
1) Data volume: With the increase of big data problem-atics, it is necessary to define what this means in terms of data volume. Jankun-Kelly et al. explain that the volume issue in visualization is caused by two facts: hardware processing limits and human perception limits [15]. As the hardware processing capacity is not in the scope of this paper, we focus on the human perception limits. Jankun-Kelly et al. explain that two elements cannot be perceived separately if they are
not spaced according to a minimum angle from the user’s point of view. To summarize, they present a perception limit depending on many factors, including pixel size, distance to the screen and ambient luminosity. According to that, the perception limit is more defined by the context of use than by the data characteristics. However, we can at least agree that if the amount of data is bigger than the number of pixels on the screen, it raises perception issues. This highlights the existence of a high volume limit, which is difficult to quantify. On the other hand, it is easy to recognize one to four objects in a group at a glance [12], highlighting the existence of a well-defined low volume limit. To conclude, we identify three characterizing volumes of data: a low volume, a high volume and an intermediate volume (see figure 2).
Fig. 2. Icons representing the three data volume characteristics: low volume, medium volume and high volume.
2) Structural organization of data: Hasco¨et and Beaudoin-Lafon propose a review of visualization and interaction tech-niques in the domain of information searches [14]. It aims to associate specific solutions to each data structure type, providing a detailed data structure characterization based on four categories: lists, trees, graphs and data bound by a similarity index, also called vector models. A list corresponds to an ordered set of data elements like, for example, words in a text. This notion of ordering can differ from one attribute to the other and as such is more about attribute nature than structure. A tree or hierarchical structure, like for example chapters over sections, is not structured through an attribute relation as ordering is for lists. A tree is defined by hierarchical relations between data elements. It is the same for graph structures, except that the relations may have specific meanings. For instance, social media contain graph structures specifying the relation between users. The relation can be mutual or unilateral, in other words ordered. Finally, data structured by a similarity criterion are data for which the similarities can be quantified. For example, a set of marked exercises will be quantifiable through their marks. This relation is, as for lists, specific to the attributes, as we can consider the mark value as one of the attributes of the exercise. Among the four characteristics defined by Hasco¨et and Beaudoin-Lafon, two are based on relations between attributes and correspond to unstructured data. The tree structure corresponds to a specific case of an oriented relation between data, while the graph corresponds to a structure of oriented and unoriented relations (see figure 3). This characterization is not complete, as we do not identify the characteristics behind the list and the data structured by similarity, which is related to attribute properties.
3) Attribute cardinality: Shneiderman proposes a charac-terization of data that takes into account attribute cardinality [30]. It presents the following data types: 1-dimensional, 2-dimensional, 3-2-dimensional, temporal, multi2-dimensional, tree,
DRAFT
Fig. 3. Icons representing the three data structure characteristics: unstructured relation, unoriented relation and oriented relation.
and graph. As we aim for cardinality characteristics, we will focus on the *-dimensional and the multidimensional. Shneiderman details 1-dimensional as linear data types, like textual documents or program source code which are all organized in a sequential manner. 2-dimensional corresponds to planar or map data like geographic maps or newspaper layouts. 3-dimensional corresponds to real-world objects such as items with volume and some potentially complex relation-ship with other items. Finally, multidimensional corresponds to most relational and statistical databases in which items with n attributes become points in an n-dimensional space. As such, we extract from Shneiderman’s characterization four categories based on the number of attributes that permit a unique identification of a data item, which we include in our characterization figure 4).
Fig. 4. Icons representing the attribute cardinalities: 1-dimensional,
2-dimensional, 3-dimensional and multidimensional.
4) Attribute structural properties: Bertin [4] and many authors after him [19], [38], characterize information repre-sentation by defining three data categories : nominal, ordinal, and quantitative. Data is nominal when its value is quali-tative and non-ordered, like animal names. The relationship between two nominal data elements is based on similarities or differences. Data is ordinal when its value is qualitative and ordered, like the letters of the alphabet. Such data elements can be distinguished on the basis of an ordering. Data is quantitative when its value is quantitative, like temperature. These three characteristics allow us to describe data attributes independently, and we retrieve the ordering and quantification relationships introduced by Hasco¨et and Beaudoin-Lafon. As such we include them in our characterization (see figure 5).
Fig. 5. Icons representing the attribute type characteristics: nominal, ordinal and quantitative.
5) Attribute nature: In a 2D chart, the choice to put one attribute as abscissa and the other as ordinate is not arbitrary. Representations vary depending on whether they represent characteristic or referential attributes [26]. A characteristic attribute is a data attribute corresponding to a measured or observed property (e.g. temperature), while a referential attribute is a data attribute reflecting an aspect of the context in which the measurement was made (e.g. time). As such we
identify two different natures of the attribute (see figure 6). The set of referential attributes of a piece of data makes it possible to describe a data item in a unique manner, such that the multidimensional aspect of a data item can be related to its number of referential attributes.
Fig. 6. Icons representing the attribute nature characteristics: characteristic and referential.
6) Synthesis: We have established that the data type of a vi-sualization challenge is decomposable into several categories. Considering a challenge as a set of activities, each activity is related to a data set that is characterized by a volume and a structure. Each datum of these data contains a specific number of attributes that are characterized by a structural property and a nature. In addition, some studies propose characterizations of the temporal aspects of the data [1, Chapter 3] or of their dimensional aspects [20, Chapter 2]. In this study we aim to propose a generic approach and as such we will not consider these categorizations, but the approach is adaptable enough to be augmented in further studies.
B. Tasks
In this section, we analyze existing task taxonomies in order to be able to describe the task type of a visualization challenge. As we did not find an existing taxonomy that fits our descriptive objective, we built a new one. In order to ensure that this new taxonomy computes the strengths of existing taxonomies, we built it based on the criteria of completeness and independence. Completeness ensures the possibility of describing all representations, while indepen-dence guarantees a unique description and therefore allows for characterization. Shneiderman’s work [30] is a widely used taxonomy that describes the activity of data visualization [24]. Shneiderman proposes the following tasks: Overview, Zoom, Filter, Detail-on-demand, Relate, History, and Extract. We can distinguish global apprehension tasks, allowing access to data, as Overview and History, but also tasks increasing the understanding of details, as Zoom, Filter, Detail-on-demand, and Extract, and analytic tasks such as Relate. However, some tasks address the same underlying need. For instance, zoom can be used to access detail on demand. By merging the tasks with the same underlying need we identify two tasks :
• Identify value corresponds to identifying an attribute
value or a category (see figure 7).
• Access information corresponds to finding an element matching some criterion (value, part of a structure, etc.) (see figure 8).
However, we cannot use this taxonomy to describe activities requiring comparing or sorting so we must carry on with the analysis.
There is a second, old but widely used taxonomy which bet-ter matches our expectations: the one from Wehrend and Lewis
DRAFT
Fig. 7. Chart representing data value by position in one dimension. This
representation illustrates the identify value task by allowing us to access the value of a specific square on a mouse-over.
Fig. 8. Chart representing data value by position in one dimension. This
representation illustrates the access information task by allowing us to identify the data whose values are between 2 and 3 with the help of reference lines.
[37]. This taxonomy, popularized by Keller [17], includes the following tasks: Identify, Locate, Distinguish, Categorize, Cluster, Distribute, Rank, Compare, Associate, and Correlate. This taxonomy has the particularity of being empirical and comes from a study analyzing more than ninety visualizations. This taxonomy contains tasks similar to Shneiderman’s, like Locateas the apprehension task or Identify and Categorize as tasks that allow us to access information. It also brings new tasks like Distinguish, Cluster/Associate, Distribute, Rank, Compare, and Correlate. This taxonomy seems to be more exhaustive, but the presence of two association tasks means that it does not meet the criterion of independence. Except these two association tasks, it makes it possible to identify five new tasks:
• Sort corresponds to identifying the ordering of a set of elements or the ranking of an element among others (see figure 9).
• Compare corresponds to evaluating the difference be-tween two attributes (see figure 10).
• Distinguish corresponds to the detection of a singularity (see figure 11).
• Identify distribution corresponds to identifying the dis-tribution of an attribute (see figure 12).
• Associate corresponds to the identification of a group of
data based on their similarity (see figure 13).
• Correlate corresponds to the identification of a relation
between two data (see figure 14).
However, as the taxonomy of Shneiderman was established in 1990 in a rising field, we prefer to comparison it to more recent taxonomies to ensure that it fully covers today’s activities.
Fig. 9. Chart representing data values by height. This representation
illustrates the sort task by allowing us to identify that the penultimate data on the right have a higher value than the other data.
Fig. 10. Chart representing data values by height. This representation
illustrates the compare task by allowing us to identify that the data on the right has a value one third higher than the data on the left.
Fig. 11. Chart representing data values by color. This representation
illustrates the distinguish task by allowing us to distinguish the fourth square from the others.
Fig. 12. Chart representing the amount of data by height according to their
values. This representation illustrates the identify distribution task by allowing us to identify that the data are spatially distributed according to two values.
Fig. 13. Chart representing data values by position in two dimensions. This
representation illustrates the associate task by allowing us to associate data in two groups.
Fig. 14. Chart representing data values by color and shape. This
represen-tation illustrates the correlate task by allowing us to conclude that there is a correlation between the value encoding the color and that encoding the shape, as the circles are always darker than the squares.
Keller’s taxonomy is used by Ward [26], who briefly rede-fines the tasks for which the initial definition was ambiguous. Ward thus proposes the following tasks: Identify characteristic; Locate boundaries, critical points, other features; Distinguish regions of different characteristics; Categorize or classify; Rank based on some order; Compare to find similarities and differences; Associate into relationship; and Correlate by classifying. It is worth noting that Ward does not include the tasks Cluster and Distribute. One can understand that the Cluster task is covered by the Associate into relation-ship task. However, Ward says nothing about the Distribute task. As Ward details Keller’s taxonomy, according to our interpretation, it does not impact the previous proposition but consolidates its definition. While not being an outcome of Wehrend’s work, Amar’s taxonomy [2] is still very similar. This taxonomy is also empirical but is more recent and used in many studies [18]. It comprises the following tasks: Retrieve value; Filter; Compute derived value; Find extremum; Sort; Determine range; Characterize distribution; Find anomalies; Cluster; and Correlate. As such, it includes the task of iden-tification of a distribution and an additional Compute derived value task, which we generalize as follow :
• Create information corresponds to the production of new information by the user (see figure 15).
Finally, some recent taxonomies identify different levels of abstraction for the tasks [6], [29]. In this work we aim to identify a synthetic taxonomy enabling us to enumerate user needs, which corresponds to a unique task type. Based on that, we argue that these taxonomies describe more than the tasks we aim for. For example some also describe the interaction functions, and thus are too large for our purpose. They propose
DRAFT
Fig. 15. Chart representing data values by position in two dimensions. This
representation illustrates the create data task by allowing us to create a group of data.
a complete approach that follows a different path that the one chosen in this paper.
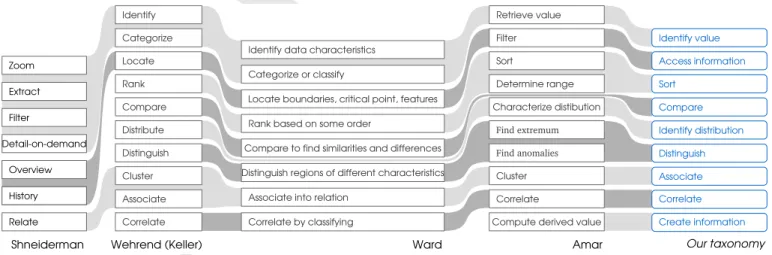
To summarize, we have compiled the strengths of existing taxonomies in a set of nine tasks (see figure 16).
C. Context of use
The context of use is defined by Thevenin and Coutaz as having three dimensions: the platform, the environment and the user [31]. In this section we examine these three dimensions. 1) Platform: The platform corresponds to the physical devices through which users interact. It regroups the devices used for action, processing and perception. We have stated previously that the processing performance was not within the scope of this paper, as such we do not consider the different processing devices. Regarding the action devices that belong to the interaction field, we cannot summarize an entire field with a set a parameters, so we do not take them into account in our characterization so far. As such we are only interested in describing the different devices that influence the perception. The majority of representation propositions are designed to be perceived on a medium screen, around 15 inches wide. However, with the generalization of touch and multi-touch interactions, this use is extended to larger displays, such as tables [35], [3]. With the increasing need for portability, the representations are also designed to be perceived on mobile displays, such as smartphones [5], [21]. Moreover, with the increasing quantity of data, the representations also extend their use to large-scale displays, such as walls [16], [25]. Finally, with the increasing dataset sizes, we see more and more visualizations on immersive devices [32], [13], [11].
Quite often, the choice of the platform is not made a priori and the designer may need to be oriented towards the most appropriated platform. However, as it may also be a design constraint, we add it to the proposed characterization (see figure 17).
Fig. 17. Icons representing devices types: portable device, simple screen(s),
large screen(s) and immersive device.
2) Environment: The work environment can impact the user’s performance in a number of different ways based on: lighting, thermal comfort, physical ergonomics, noise, and vibration [23]. However, we cannot clearly establish that these characteristics condition the representation. With some exceptions, such as the use of night and day light modes, the environment impacts performance a lot, but it does not impact the representation.
3) User: Users also have an impact on the visualization process because of their knowledge, experience or physical capabilities. We focus on the characterization of the user experience and user expertise. User experience includes all the characteristics that globally distinguish users. For example, the signification of colors varies between countries, so that users from different cultures will not experience color visualization in the same manner. Taking into account user experience means considering what characterizes a user. This means taking into consideration a great number of details. It is therefore difficult to propose an exhaustive characterization of the user experience. As such, we propose to highlight the impact of user experience in the characterization of the representation. User expertise defines the user’s reaction when facing a problem. This reaction depends on how often the user has been confronted with the problem. Rasmussen et al. propose a characterization of several cognitive functions associated with expertise levels: skills, rules and knowledge [27]. The cognitive function knowledge induces the highest
Ward
Shneiderman Wehrend (Keller) Amar Our taxonomy
Filter Compute derived value Retrieve value Characterize distibution Sort Determine range Find extremum Find anomalies Cluster Correlate Sort Identify value Access information Compare Distinguish Identify distribution Associate Correlate Create information Rank based on some order Distinguish regions of different characteristics Locate boundaries, critical point, features Categorize or classify Identify data characteristics Associate into relation Compare to find similarities and differences Correlate by classifying Locate Distinguish Rank Distribute Compare Cluster Associate Correlate Identify Categorize Relate Detailondemand Zoom Filter Extract Overview History Overview History
DRAFT
cognitive load. It is used in the case of a new problem to solve. The user who has no expertise in a subject can only rely on his/her knowledge. The cognitive function rules induces less cognitive load because it is based on the use of acquired predefined processes, called rules. The rules correspond to actions that the user knows must be performed in a particular situation. Rules creation implies already having faced the situation several times. Finally, the skill level implies the lowest amount of cognitive load, because it is based on almost unconscious reactions acquired through long-term experience. We include these three characteristics in our characterization (see figure 18).
Fig. 18. Icons representing the level of user’s expertise: skill, rules and
knowledge.
D. Context synthesis
Considering a survey of existing visualization characteriza-tions, we have formalized the characteristics of visualization challenges. We have identified these characteristics according to the data type, the user’s need and the context of use. However, all these elements characterize the visualization challenges on different levels. A visualization challenge is de-scribed by a unique context of use (device and user expertise) and a set of activities. Each activity is described by a task and the characteristics of the data on which the task is applied, namely the data volume, the data structure and the properties of the attributes. Each attribute is described by a structural property and a nature. The whole context characterization is synthesized in figure 19. This characterization does not take into account the attribute cardinality, as it is implied by the number of referential attributes.
CHALLENGE a device a user expertise activities ACTIVITY a task a data volume a data structure attributes ATTRIBUTE a structural prop. a nature
Fig. 19. Schematic representation of the organization of the characteristics
of the visualization challenges
IV. IDENTIFICATION OF THE REPRESENTATION COMPONENTS
To list the different components that constitute the rep-resentations, we use the structure brought by the InfoVis Pipeline, which describes the representation as comprising data transformations, visual mappings, view transformations and interaction [8]. We do not aim to be exhaustive but rather to highlight the possible segmentations of a representation.
The data transformations are all techniques that enable us to extract meaning from the data by processing. The main data transformations in visualization are aggregation,
projection, and filtering techniques [15]. The visual map-ping corresponds to the transposition of the information to be presented into visual elements (attribute value, structure). Bertin [4] identifies the visual variables position, size, color intensity, grain, color hue, orientation and shape. This list was completed over years [19], [20] adding connection, volume, and motion. The visual transformations correspond to the set of processes that cause variation int the view parameters [10]. There are three possible variations: the level of details (e.g. Overview+Detail, Zoom), the represented attributes (e.g. parallel coordinates) and the represented data (e.g. navigation). Accessing the different views is performed through a spatial separation (e.g. parallel coordinate) or tem-poral separation (e.g. zoom), enabling various representation solutions. Even though the interaction is already represented in the previous processes (e.g. zoom, like almost every temporal separation transformation), it also includes other aspects, such as selecting, linking or filtering [22].
We have identified several representation components from the three parts of the InfoVis Pipeline [8]. Despite the fact that our identification may not be exhaustive, it allows us to decompose most of the representations into elementary components.
V. CHARACTERIZATION OF THE RELATIONSHIPS BETWEEN
CHALLENGE ASPECTS AND REPRESENTATION COMPONENTS
To fill the repository of the relationships between challenge aspects and representation components, we propose extracting these relationships from numerous existing representations, using the characterization of the context and of the compo-nents of a representation. We thus propose consolidating the extracted relationships by comparing them with the theoretical studies on the matter. To illustrate our approach, we exemplify these two steps through the analysis of an existing represen-tation tool.
A. Extraction on an existing representation
First, to extract relationships from an existing representa-tion, we need to describe the representation according to the proposed characterization of the context. We need to identify characteristics of the context of use, and then describe the activity thanks to the proposed task taxonomy. By doing this, we identify which data these tasks apply to and how many attributes we also characterize. Once these different levels of characterization are processed, we can describe the representa-tion components involved and link them to different levels of the context (challenge, activity or attribute), according to their nature (data transformation, visual mapping, view transforma-tion and interactransforma-tion). For instance, each visual variable is often associated with the characteristics of a specific attribute, while the view transformation is often common to the activity. The links being established, we associate sets of components with each activity, duplicating the other characteristics, as they are common to the entire challenge. We exemplify the extraction of the relationships between the representation context and
DRAFT
representation components over a complex use case, namely the analysis of radar signal pulses to extract radar signal characteristics.
One of the tools used for radar signal analysis consists of several 2D charts (see Figure 20). Each chart represents attributes specific to the radar signal: the pulse width, the pulse repetition period and the frequency over time. This representation makes it possible to identify the characteristics of the attributes of the radar signal that may vary through time or may be mixed with other signals. The first step of the analysis involves identifying clusters inside the charts that are considered to belong to the same radar. Once a cluster is identified (often according to frequency attribute), the operator selects the data and colors them in order to distinguish their values throughout the representation. The operator thus identifies the variation of each attribute.
Now, we use our characterization of the challenge aspects and the representation components to extract the relationships that we summarize in Table I. In the table, the relationships are divided according to the activity level (such that each task is related to a set of components). This use-case description highlights four tasks. The first task processed by the operator is the association of the data according to their values of time and frequency. Secondly, by selecting these data, the user creates the information that they potentially belong to the same radar. Thirdly, through the color, the operator accesses this information throughout the view and fourthly, the operator can identify the values of each attribute of these data. We know that the operator is an expert in his/her domain and that the volume of data is medium, as it is higher than four and lower than the number of pixels. For the nature of the attributes, the radar attributes are all quantitative, but concerning the create information tasks, the ”potentially belongs to a unique radar” value is nominal, and given the nature of the radar signal all these attributes are characteristic, except for time and frequency, which are referential. Finally, the device currently used to access this representation is a simple screen. The first task, the association according to two attributes, is enabled by the position, one for each attribute. The creation task is brought by the selection. The access information task is feasible using the color and the multiview. The value identification task is possible four times thanks to the position.
Among the relationships established above, some are clear, such as the selection that we illustrate by our iconography (see figure 21), but some others are yet to be discussed. For instance, the position is present four times in the extracted
TABLE I
SYNTHESIS OF THE RELATIONSHIPS ESTABLISHED FOR THE RADAR USE-CASE.
representation component challenge aspect
position and position • Device: simple screen
• Expertise: high
• An activity:
− Task: associate
− Data volume: medium
− An attribute:
∗ Structural prop.: quantitative
∗ Nature: referential
− An attribute:
∗ Structural prop.: quantitative
∗ Nature: referential
selection • Device: simple screen
• Expertise: high
• An activity:
− Task: create information
− Data volume: medium
− An attribute:
∗ Structural prop.: nominal
∗ Nature: characteristic
color and multiview • Device: simple screen
• Expertise: high
• An activity:
− Task: access information
− Data volume: medium
− An attribute:
∗ Structural prop.: nominal
∗ Nature: characteristic
position and position • Device: simple screen
• Expertise: high
• An activity:
− Task: identify value
− Data volume: medium
− An attribute:
∗ Structural prop.: quantitative
∗ Nature: characteristic
− An attribute:
∗ Structural prop.: quantitative
∗ Nature: referential
relationships, and while we cannot deny the implication of the use of the position to represent time in the identification of varying values, we can question the association task. To make a decision about this type of uncertainty and more generally to validate the extracted relationships, we analyze other existing representations and compare the extracted propositions with theoretical studies.
B. Comparison with theoretical studies
In order to consolidate the relationships extracted from the analysis of an existing tool, we compare them with studies about component properties. We exemplify our approach by analyzing the properties of the position component.
pulse width time pulse repetition period time frequency time
DRAFT
Fig. 21. Illustration of the extracted relationship concerning selection: it
summarizes one of the challenges that the selection solves.
Bertin identifies different visual variables and associates them with one or more perceptive powers, laying the foun-dation of graphic semiology [4]. This work states that the use of a particular visual variable to represent a given datum en-courages a specific perception. According to him, the encoding of a value with the position strongly enables the identification of its quantitative, ordinal and dissociative aspects, and also permits the identification of its associative aspect. These are respectively related to the tasks compare, sort, distinguish and associate. Mackinlay continues Bertin’s work by highlighting the fact that this perceptual power comes directly from the data [19]. Instead of combining the perceptual power and visual variables, he proposes associating the properties of the data with visual variables. For instance, as ordering and comparison tasks are based on the use of the ordinal and quantitative properties respectively, it is useless to perform these tasks on data that do not have the corresponding properties. Regarding position, Mackinlay states that it allows us to reveal any property of the data (quantitative, ordinal and nominal). These propositions confirm the facts deduced from the previous representation description that position permits us to process an identification task on quantitative attributes.
Following the Gestalt theory [7], when elements are placed close to each other they tend to be perceived as a group, and contrarily when elements are placed without proximity they tend to be perceived as separate shapes. This allows us to validate the use of position for association tasks. However, this does not give any precision about the data used, nor about the context of use.
Regarding the nature of the data, only time and space rep-resentations allow us to distinguish a represented element that has different values, and the values of referential components differ from one another, by definition. As such the position is a first choice to represent referential attributes. Moreover, as a matter or fact, position is usable in only three dimensions,
such that it allows only data with three referential components to be displayed.
Regarding the amount of data and the device, Jankun-Kelly et al. explain that there is a perceptive limitation in the use of the position [15]. According to Ware, humans need at least an angle of one arc per minute between two visual elements on a screen to distinguish them [36]. At a viewing distance of 57 cm, this requires a density of 60 pixels per centimeter. As such, the position can be used for medium volume of data on small and normal screens and for high volume of data for large screens. Regarding stereo acuity, and as such most immersive devices, the angle is ten arcs per second but the distance to the screen is biased by the lens. We were not able to find a study that offers a precise specification.
To conclude, we have established that the position is indeed an appropriate visual variable to process identification tasks on quantitative attributes. It is also preferred for referential attributes and make it possible to handle medium to high data volume according to the device. Finally, the position makes the association task possible.
C. Synthesis of the characterization of the relationships We have detailed the different components of a representa-tion and used them to describe an existing visualizarepresenta-tion tool. We have described the context of this tool and identified the relationships between the characterized context and the com-ponents. Moreover, we have compared an extracted relation-ship with theoretical studies to consolidate this relationrelation-ship.
Components identification and the two examples have en-abled us to present the approach we use to identify the rela-tionships between challenges and representation components.
VI. CONCLUSION
The present study presents a procedure to create a repository that identifies the relations between aspects of visualization challenges and representation components. Its objective is to support the resolution of new visual challenges and the implementation of a visualization design recommendation system. According to a synthesis of existing definitions of the visualization process, we have identified the three main parameters that characterize visualization challenges: the data typology, the user’s task and the context of use. We have an-alyzed in detail these parameters using a synthesis of existing characterizations. Then we have presented our approach to extract the relations by identifying the main components of a representation, illustrated a relation extraction on a complex use case and exemplified the reinforcement of the extraction by detailing the identification of the properties of the position component. In further work, we first aim to augment the presented repository with inference rules in order to set the basis of a recommendation system for visualization. Then, we will test this system on several use-cases to produce representations and evaluate them with end users, in order to assess the whole approach.
DRAFT
REFERENCES
[1] Roland Aigner, Daniel Wigdor, Hrvoje Benko, Michael Haller, David Lindlbauer, Alexandra Ion, Shengdong Zhao, and Jeffrey Tzu Kwan Valino Koh. Understanding mid-air hand gestures : A study of human preferences in usage of gesture types for hci. Tech. Rep. MSR-TR-2012-11, page 10, 2012.
[2] R. Amar, J. Eagan, and J. Stasko. Low-level components of analytic activity in information visualization. Proceedings of the 2005 IEEE Symposium on Information Visualization (INFOVIS’05), pages 15–15, 2005.
[3] Craig Anslow, Stuart Marshall, James Noble, and Robert Biddle. Inter-active multi-touch surfaces for software visualization. In Workshop on Data Exploration for Interactive Surfaces DEXIS 2011, page 20, 2012. [4] Jacques Bertin. S´emiologie Graphique. Paris, 1967.
[5] Steven Birr, Raimund Dachselt, and Bernhard Preim. Mobile interactive displays for medical visualization. In Workshop on Data Exploration for Interactive Surfaces DEXIS 2011, page 28, 2012.
[6] Matthew Brehmer and Tamara Munzner. A multi-level typology of
abstract visualization tasks. IEEE Transactions on Visualization and Computer Graphics, 19(12):2376–2385, 2013.
[7] Vicki Bruce, Patrick R Green, and Mark A Georgeson. Visual Percep-tion: Physiology, Psychology, & Ecology. Psychology Press, 2003. [8] Stuart K Card and Jock Mackinlay. The Structure of the Information
Visualization Design Space. IEEE Symposium on Information Visual-ization, pages 92–99, 1997.
[9] Min Chen and Heike Jaenicke. An information-theoretic framework for visualization. IEEE Transactions on Visualization and Computer Graphics, 16(6):1206–1215, 2010.
[10] Andy Cockburn, Amy Karlson, and Benjamin B. Bederson. A review of overview+detail, zooming, and focus+context interfaces. ACM Comput. Surv., 41(1), jan 2009.
[11] Matt Cooper and Marcus Lange. Interactive and immersive 3d visualiza-tion for atc. In Proceedings of the 3rd Eurocontrol Innovative Research Workshop, Paris, France, 2004.
[12] Stanislas Dehaene. The Number Sense: How the Mind Creates Mathe-matics. OUP USA, 2011.
[13] Ciro Donalek, S. G. Djorgovski, Alex Cioc, Anwell Wang, Jerry Zhang, Elizabeth Lawler, Stacy Yeh, Ashish Mahabal, Matthew Graham, Andrew Drake, Scott Davidoff, Jeffrey S. Norris, and Giuseppe Longo. Immersive and collaborative data visualization using virtual reality platforms. 2014 IEEE International Conference on Big Data Immersive, pages 609–614, 2014.
[14] Mountaz Hascoet and Michel Beaudouin-Lafon. Visualisation interactive d’information. Revue I, 1(1):77–108, 2001.
[15] T J Jankun-Kelly, Tim Dwyer, Danny Holten, Christophe Hurter, Chris Weaver, and Kai Xu. 10 scalability considerations for multivariate graph visualization. In Andreas Kerren, editor, Multivariate Network Visual-ization, chapter 10, pages 207–235. Springer International Publishing, 2014.
[16] Daniel F. Keefe, Ankit Gupta, Daniel Feldman, John V. Carlis, Susi Krehbiel Keefe, and Timothy J. Griffin. Scaling up multi-touch selection and querying: Interfaces and applications for combining mobile multi-touch input with large-scale visualization displays. International Journal of Human Computer Studies, 70(10):703–713, 2012.
[17] Peter R Keller and Mary M Keller. Visual Cues: Practical Data
Visualization, volume 2. IEEE Computer Society Press Los Alamitos, 1993.
[18] Bongshin Lee, Catherine Plaisant, Cynthia Sims Parr, Jean-Daniel Fekete, and Nathalie Henry. Task taxonomy for graph visualization. In Proceedings of the 2006 AVI Workshop on BEyond Time and Errors: Novel Evaluation Methods for Information Visualization, pages 1–5. ACM, 2006.
[19] Jock Mackinlay. Automating the design of graphical presentations of relational information. ACM Transactions on Graphics, 5(2):110–141, apr 1986.
[20] Tamara Munzner. Visualization Analysis and Design. CRC Press, 2014. [21] Denis Nikitenko and Daniel Gillis. Touching the data: Exploring data sonification on mobile touchscreen devices. Procedia Computer Science, 34:360–367, 2014.
[22] Chris North. Information Visualization, pages 1209–1236. John Wiley & Sons, Inc., 2012.
[23] KC Parsons. Environmental ergonomics: a review of principles, methods and models. Applied ergonomics, 31(6):581–594, 2000.
[24] Darius Pfitzner, Vaughan Hobbs, and David Powers. A unified taxo-nomic framework for information visualization. In Proceedings of the Asia-Pacific Symposium on Information Visualisation, volume 24, pages 57–66. Australian Computer Society, Inc., 2003.
[25] Arnaud Prouzeau, Anastasia Bezerianos, and Oliver Chapuis. Evaluating multi-user selection for exploring graph topology on wall-displays. IEEE Transactions on Visualization and Computer Graphics, 2016. [26] Helen C Purchase, Natalia Andrienko, T J Jankun-Kelly, and Matthew
Ward. Theoretical foundations of information visualization. Information Visualization, pages 46–64, 2008.
[27] Jens Rasmussen. Skills rules and knowledge, other distinctions in
human performance models. IEEE Transactions on Systems, Man, and Cybernetics, 13(3):257–266, 1983.
[28] Dominik Sacha, Hansi Senaratne, Bum Chul Kwon, and Daniel A. Keim. Uncertainty resolution and trust building in visual analytics. In Provenance for Sensemaking (Workshop), Paris, France, 2014. [29] Hans-J¨org Schulz, Thomas Nocke, Magnus Heitzler, and Heidrun
Schu-mann. A design space of visualization tasks. IEEE Transactions on Visualization and Computer Graphics, 19(12):2366–2375, 2013.
[30] B. Shneiderman. The eyes have it: A task by data type taxonomy
for information visualizations. Proceedings 1996 IEEE Symposium on Visual Languages, pages 336–343, 1996.
[31] D Thevenin and J Coutaz. Plasticity of user interfaces: Framework and research agenda. Agenda, 99:110–117, 1999.
[32] Andries Van Dam, Andrew S Forsberg, David H Laidlaw, Joseph J LaViola, and Rosemary M Simpson. Immersive vr for scientific visual-ization: A progress report. IEEE Computer Graphics and Applications, 20(6):26–52, 2000.
[33] Jarke J Van Wijk. The value of visualization. In Visualization, 2005. VIS 05. IEEE, pages 79–86. IEEE, 2005.
[34] Paul Vickers, Joe Faith, and Nick Rossiter. Understanding visualization: A formal approach using category theory and semiotics. IEEE Trans-actions on Visualization and Computer Graphics, 19(6):1048–1061, jun 2013.
[35] Ulrich von Zadow, Florian Daiber, Johannes Sch¨oning, and Antonio Kr¨uger. Geolens: Multi-user interaction with rich geographic informa-tion. Proc. DEXIS 2011, pages 16–19, 2012.
[36] Colin Ware. Information Visualization: Perception for Design. Elsevier, 2012.
[37] S. Wehrend and C. Lewis. A problem-oriented classification of
vi-sualization techniques. Proceedings of the First IEEE Conference on Visualization: Visualization ‘90, pages 139 – 143, 469, 1990. [38] Leland Wilkinson. The grammar of graphics, 1999.