HAL Id: hal-00687317
https://hal.archives-ouvertes.fr/hal-00687317
Submitted on 13 Apr 2012
HAL is a multi-disciplinary open access
archive for the deposit and dissemination of
sci-entific research documents, whether they are
pub-lished or not. The documents may come from
teaching and research institutions in France or
abroad, or from public or private research centers.
L’archive ouverte pluridisciplinaire HAL, est
destinée au dépôt et à la diffusion de documents
scientifiques de niveau recherche, publiés ou non,
émanant des établissements d’enseignement et de
recherche français ou étrangers, des laboratoires
publics ou privés.
A Novel Data Compression Techniques for Remote
Sensing Data Mining
Avid Roman Gonzalez, Miguel Veganzones, Manuel Grana, Mihai Datcu
To cite this version:
Avid Roman Gonzalez, Miguel Veganzones, Manuel Grana, Mihai Datcu. A Novel Data
Compres-sion Techniques for Remote Sensing Data Mining. ESA-EUSC-JRC 2011 Image Information Mining:
Geospatial Intelligence from Earth Observation Conference, Mar 2011, Ipsra, Italy. pp.101-104.
�hal-00687317�
A NOVEL DATA COMPRESSION TECHNIQUE FOR REMOTE SENSING DATA MINING
Avid Román-González, Miguel A. Veganzones, Manuel Graña and Mihai Datcu
TELECOM ParisTech, Paris, France
Grupo de Inteligencia Computacional, Universidad del País Vasco (UPV/EHU), San Sebastián, Spain
German Aerospace Center - DLR, Oberpfaffenhofen, Germany
ABSTRACT
In this article we propose a parameter-free method for Remote Sensing (RS) image databases Data Mining (DM). DM of RS images requires methodologies robust to the diversity of con-text found in such large datasets, as well as methodologies with low computational costs and low memory requirements. The methodology that we propose is based on the Normal-ized Compression Distance (NCD) over lossless compressed data. Normalized Compression Distance is a measure of sim-ilarity between two data files using the compression factor as an approximation to the Kolmogorov complexity. This ap-proach allows to directly compare information from two im-ages using the lossless compressed original files, and avoid-ing the feature extraction/selection process commonly used in pattern recognition techniques. This shortcut makes the pro-posed methodology suitable for DM applications in RS. We provided a classification experiment with hyperspectral data exemplarizing our methodology and comparing it with com-mon methodologies found on the literature.
1. INTRODUCTION
Earth Observation (EO) data have increased significantly over the last decades with orbital and suborbital sensors collecting and transmitting several terabytes of data a day. Image infor-mation mining (IIM) is a new field of study that has arisen to seek solutions to automating the mining (extracting) of in-formation from EO archives that can lead to knowledge dis-covery and the creation of actionable intelligence (exploiting) [1].
Hyperspectral sensors densely measure the spectral re-sponse of the elements on the sensed scene, forming images with rich information for thematic mapping, identification of materials (even at subpixel resolution) or anomalies detec-tion. However, hyperspectral image analysis poses several issues [2] as the Hughes phenomenon, due to the small ra-tio between the number of samples and the number of spec-tral bands; a high spatial correlation, violating the sampling independence assumption; and the non-stationary behavior of the spectral signatures in the spatial domain. Also, the lack of reference (labelled) samples with respect to the com-plexity of the problem and the lack of inherent superiority
of any predictive learning classifier as well as data cluster-ing algorithm, make mappcluster-ing assesment and comparison a re-ally hard problem [3]. This issues have been faced with new promissing techniques as such implementing the Structural Risk Minimization (SRM) inductive principle [4], semisuper-vised learning methods or unsupersemisuper-vised thematic map quality assesments.
However, Pattern Recognition techniques have to cope with new problems when information have to be extracted from large databases of remote sensing images. Feature ex-traction/selection techniques and classification algorithms are usually chosen and their parameters tuned to solve the mapping task for an specific scene and fail to be applied to different contexts or similar scenes taken in different con-ditions. Moreover, Data Mining imposes another restric-tions such as computational efficiency or memory allocation capacity. In this work, we propose a new parameter-free methodology suitable for data mining of large hyperspectral image databases. The proposed methodology uses lossless compression techniques to compress the hyperspectral data, and defines a Normalized Compression Distance (NCD) over the compressed data as a meassure of similarity between two data files, using the compression factor as an approximation to the Kolmogorov complexity.
We provide a classification experiment over a hyperspec-tral dataset, showing an example of applicability of the pro-posed methodology, and comparing it to other methodolo-gies found on the literature. We show in our experiment that the proposed parameter-free NCD-based methodology perfor-mance is similar to other well-known approaches, while skips the feature extraction/selection process.
The paper is structured as follow. Section 2 presents the proposed methodology and the theorical basis on which it is based. Section 3 shows a practical application in classification of buildings, forest and fields over a hyperspectral dataset. Finally, section 4 reports our conclusions.
2. PROPOSED METHODOLOGY
In this section we present the theoretical bases for the method-ology such as the Kolmogorov complexity and the normalized
compression distance; and finally we present the methodol-ogy itself.
2.1. Kolmogorov Complexity and Normalized Informa-tion Distance (NID)
The Kolmogorov Complexity K(x) of an object x is de-fined as the minimum amount of computational resources, q, needed to represent x:
K(x) = min
q∈Qx
|q| (1)
where Qxis the set of instantaneous codes that give x as
out-put.
It is true that some dependence of the size on the descrip-tive language we use exists, but it is not very worrying as it is reduced to some constant, i.e., given two languages L1
and L2, and any string of symbols x,|K1(x) − K2(x)| < k.
This may seem surprising, but it is not, because all we need to move from a description in L1to another in L2is a program
interpreter of L1in L2writing. The interpreter may be more
or less long, but it’s fixed, so that its size is a constant (and the corresponding program size in L2is the size on L1program
plus the interpreter). Another interesting but less surprising result is that there exists a constant k (depending on the lan-guage) such that for any string x, K(x) < |x| + k. This is easy to see if we think of the worst case, a program containing the string itself as internal constant.
Within the Information Theory we can say that the Kol-mogorov complexity or algorithmic complexity (as was top lines) is the amount of information needed to recover x. It is important to note that K(x) is a non-calculable function. The conditional complexity K(x, y) of x related to y is de-fined as the length of the shortest program with which we can obtain an output x from y. An important application of this notion is to estimate the shared information between two ob-jects: The Normalized Information Distance (NID) [5]. The NID is proportional to the length of the shortest program that can calculate x given y. The distance calculated from these considerations is then normalized as follows:
N ID(x, y) = K(x, y) − min {K (x) , K (y)} max {K (x) , K (y)} (2) The NID result is a positive value r, 0 ≤ r ≤ 1, being r= 0 if the objects are identical and r = 1 for the maximum distance between them.
If we have a string x and a program P smaller than x which describes it, then this program can be interpreted as a compression (lossless information) of x. Therefore, if K(x) < |x| we say that x is compressible.
2.2. Normalized Compression Distance (NCD)
Since the Kolmogorov Complexity, K(x), is a non-computable function, the work in [5] defines the Normalized
Compres-sion Distance (NCD) as an approximation to the Normal-ized Information Distance (NID) considering K(x) as the compressed version of x, and a lower limit of what can be achieved with the compressor C. That is, to approximate K(x) with C (x) = K (x) + k, the length of the compressed version of x obtained by a lossless compressor C plus an unknown constant k. The presence of k is necessary because it is not possible to estimate how close of K(x) this approach is. To clarify this concept, we take two strings b and p having the same length n, where the first is a random output of a Bernoulli process and the second represents the first n digits of π. The quantity K(p) would be smaller tan K (b) because there is a natural language program of length K(p) ≪ n which output is the number π, while a program that has as output a random sequence of bits would have a close to n length, so K(p) ≪ K (b). Thus, equation (2) could be estimated by the Normalized Compression Distance (NCD):
N CD(x, y) = C(x, y) − min {C (x) , C (y)} max {C (x) , C (y)} (3) where C(x, y) represents the size of the compressed file ob-tained by the concatenation of x and y.
The NCD can be calculated explicitly between two strings or two files x and y, and this represents how different are these files, facilitating the use of this result into various applications with different data into a parameter-free approach [6, 7, 8, 9]. The NCD is a positive result0 ≤ N CD ≤ 1 + e, being e a representation of the imperfections of the compression al-gorithms. It is necessary to remark that the K(x) approx-imation by C(x) depends on the data with which to work. Knowing that common compressors are built based on dif-ferent hypotheses, some are more efficient than others with a specific type of data.
2.3. Methodology
Figure 1 shows a block diagram of the proposed methodology. The goal is to calculate a distance between two hyperspectral images without the need of selecting/extracting features, not tuning any parameter neither. First, hyperspectral images are converted to strings, by concatenating the spectral response of the pixels of each image one after another. To compare two hyperspectral images, H1 and H2, the string representations
of each image, x1and x2, are compressed by a lossless
com-pressor C, and their individual compression factors, C(x1)
and C(x2), are calculated. Then, x1and x2are concatened
and compressed to calculate C(x1, x2). Now, we can
meas-sure the distance between the two images, H1and H2, using
the Normalized Compression Distance, N CD(x1, x2) as it
was defined in (3).
It is possible to use this methodology to calculate the ma-trix of NCD distances between pairs of hyperspectral images from a hyperspectral dataset. That is,
Fig. 1. Block diagram of the proposed methodology
Fig. 2. Subscenes of the hyperspectral image showing the DLR facilities (Band 7).
where N is the number of images in the dataset, and dijis the
NCD distance between images Hiand Hj. Then, the matrix
D of NCD distances can be used as the input to a classifier. Although we make emphasis here in hyperspectral imagery, this methodology is easily modifiable for the analysis of other RS data. It is also to be noted that the analysis of the RS im-ages by this methodology allows to use the image as a whole, independently of their size.
3. EXPERIMENTAL RESULTS
We realized some experiments to show the use of the pro-posed methodology for hyperspectral classification, and we compared the results to other methodologies found on the lit-erature. The hyperspectral data taken by the HyMap sensor have been provided by the German Aerospace Center (DLR). The sensed scene corresponds to the facilities of the DLR cen-ter in Oberpfaffenhofen and its surroundings, mostly fields, forests and small towns. Figure 2 shows some subscenes of the hyperspectral image used on the experiments. The data cube has2878 lines, 512 samples and 125 bands; and the pixel values are represented by 2-bytes signed integers.
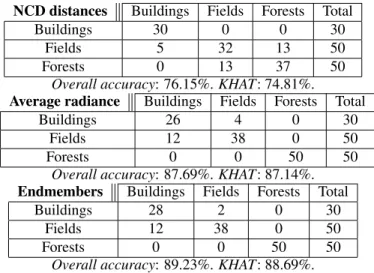
We took the original image and divided it into several patches of8 × 8 pixels, and we selected by visual inspection 130 among them corresponding to three different classes:
NCD distances Buildings Fields Forests Total
Buildings 30 0 0 30
Fields 5 32 13 50
Forests 0 13 37 50
Overall accuracy: 76.15%. KHAT: 74.81%. Average radiance Buildings Fields Forests Total
Buildings 26 4 0 30
Fields 12 38 0 50
Forests 0 0 50 50
Overall accuracy: 87.69%. KHAT: 87.14%. Endmembers Buildings Fields Forests Total
Buildings 28 2 0 30
Fields 12 38 0 50
Forests 0 0 50 50
Overall accuracy: 89.23%. KHAT: 88.69%. Table 1. Results using the unsupervised K-Means algorithm buildings (30 patches), fields (50 patches) and forests (50 patches). We transformed these patches into strings, xi, as it
has been described in section 2, and we calculated the matrix of distances D (4), between all image pairs using the NCD function (3). Then, we used the distance matrix D as the input to well known classification algorithms: K-Means (un-supervised clustering) and K-NN ((un-supervised classification).
We compared the results obtained with the proposed NCD-based methodology to results obtained using the aver-age patch radiance and the induced endmembers characteri-zation:
• The average patch radiance ¯rifor a patch piis given by
¯ ri= N1 P N j=1p (j) i , where p (j)
i is the j-th pixel
belong-ing to patch i, and N is the total number of pixels in the patch (N = 64 in our case).
• The induced endmember characterization Ei= (ei1, . . . , eimi)
for a patch pi is a set of endmembers, eij, j =
1, . . . , mi, where mi is the number of endmembers
for the patch pi, obtained by applying an Endmember
Induction Algorithm [10, 11] to the patch.
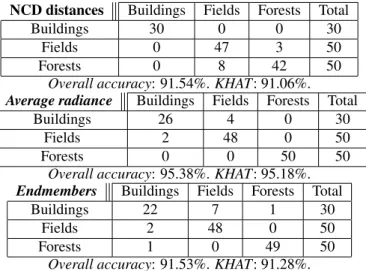
All the experiments have been run using a K-Fold resam-pling with 10 folds. Experiments with the induced endmem-ber characterization of the patches have been done using the EIHA endmember induction algorithm [12] and the endmem-bers distance function in [13] to calculate an endmember dis-tance matrix analogous to the NCD disdis-tance matrix used as input to the classifiers. Tables 1 and 2 show the confusion matrix, the overall accuracy and the KHAT index for the K-Means and K-NN algorithms respectively.
4. CONCLUSIONS
In this work we proposed the Normalized Compression Dis-tance (NCD) as the base for a novel data compression
tech-NCD distances Buildings Fields Forests Total
Buildings 30 0 0 30
Fields 0 47 3 50
Forests 0 8 42 50
Overall accuracy: 91.54%. KHAT: 91.06%. Average radiance Buildings Fields Forests Total
Buildings 26 4 0 30
Fields 2 48 0 50
Forests 0 0 50 50
Overall accuracy: 95.38%. KHAT: 95.18%. Endmembers Buildings Fields Forests Total
Buildings 22 7 1 30
Fields 2 48 0 50
Forests 1 0 49 50
Overall accuracy: 91.53%. KHAT: 91.28%. Table 2. Results using the supervised K-NN algorithm
nique suitable for Remote Sensing data mining. We provided a methodology for the mining of hyperspectral datasets based on this technique. This methodology is easily modifiable for its use with any Remote Sensing data. The applicability of this methodology was tested by a classification and clustering experiments over a dataset of hyperspectral images. The re-sults of the experiments show that the proposed methodology performance is similar to other methodologies found on the literature, while presents some advantadges (e.g. no need for a feature extraction/selection process, parameter-free, adapt-ability to any image size) that makes it suitable for RS data mining.
Acknowledgement
HyMap data was made available from HyVista Corp. and DLRs optical Airbone Remote Sensing and Calibration Fa-cility service (http://www.OpAiRS.aero). The authors very much acknowledge the support of Dr. Martin Bachmann from DLR.
5. REFERENCES
[1] M. Datcu, S. D’Elia, R. L. King, and L. Bruzzone, “In-troduction to the special section on image information mining for earth observation data,” Geoscience and Re-mote Sensing, IEEE Transactions on, vol. 45, no. 4, pp. 795–798, 2007.
[2] L. Bruzzone and C. Persello, “A novel approach to the selection of spatially invariant features for the classifica-tion of hyperspectral images with improved generaliza-tion capability,” Geoscience and Remote Sensing, IEEE Transactions on, vol. 47, no. 9, pp. 3180–3191, 2009.
[3] A. Baraldi, L. Bruzzone, and P. Blonda, “Quality assess-ment of classification and cluster maps without ground truth knowledge,” Geoscience and Remote Sensing, IEEE Transactions on, vol. 43, no. 4, pp. 857–873, 2005.
[4] Vladimir N. Vapnik, Statistical Learning Theory, Wiley-Interscience, Sept. 1998.
[5] Ming Li, Xin Chen, Xin Li, Bin Ma, and P.M.B. Vi-tanyi, “The similarity metric,” Information Theory, IEEE Transactions on, vol. 50, no. 12, pp. 3250–3264, 2004.
[6] Eamonn Keogh, Stefano Lonardi, and Chotirat Ann Ratanamahatana, “Towards parameter-free data min-ing,” Seattle, WA, USA, 2004, pp. 206–215, ACM. [7] T. Watanabe, K. Sugawara, and H. Sugihara, “A new
pattern representation scheme using data compression,” Pattern Analysis and Machine Intelligence, IEEE Trans-actions on, vol. 24, no. 5, pp. 579–590, 2002.
[8] R. Cilibrasi and P.M.B. Vitanyi, “Clustering by com-pression,” Information Theory, IEEE Transactions on, vol. 51, no. 4, pp. 1523–1545, 2005.
[9] D. Cerra, A. Mallet, L. Gueguen, and M. Datcu, “Al-gorithmic information Theory-Based analysis of earth observation images: An assessment,” Geoscience and Remote Sensing Letters, IEEE, vol. 7, no. 1, pp. 8–12, 2010.
[10] A. Plaza, P. Martinez, R. Perez, and J. Plaza, “A quan-titative and comparative analysis of endmember extrac-tion algorithms from hyperspectral data,” Geoscience and Remote Sensing, IEEE Transactions on, vol. 42, no. 3, pp. 650–663, 2004.
[11] Miguel A. Veganzones and Manuel Grana, “Endmem-ber extraction methods: A short review,” in Knowledge-Based Intelligent Information and Engineering Sys-tems, 12th International Conference, KES 2008, Zagreb, Croatia, September 3-5, 2008, Proceedings, Part III, vol. 5179 of Lecture Notes in Computer Science, pp. 400–407. Springer, 2008.
[12] Manuel Grana, Ivan Villaverde, Jose O. Maldonado, and Carmen Hernandez, “Two lattice computing approaches for the unsupervised segmentation of hyperspectral im-ages,” Neurocomput., vol. 72, no. 10-12, pp. 2111– 2120, 2009.
[13] J.O. Maldonado, D. Vicente, M.A. Veganzones, and M. Grana, “Spectral indexing for hyperspectral image CBIR,” Torrejon air base, Madrid (Spain), 2006.