Study of Zn-Ni Alloy Coatings Modified by Nano-Al2O3 Particles Incorporation
Malika Diafi 1)*, Elhachmi Guettaf Temam 1), Brahim Gasmi 1), Said Benramache 1) Adaika Mohamed Lakhdar
1)
Physic Laboratory of Thin Films and Applications (LPCMA), University of Biskra, 07000, Algeria
*Corresponding author: e-mail: diafimalika@gmail.com, Tel.: +213557286468, Physic Laboratory of Thin Films and Applications (LPCMA), University of Biskra, 07000, Algeria
Abstract
The aim of this research work was to codeposit nano-Al2O3 particles into Zn-Ni alloy coatings in order to improve some surface ,properties, the influence of the concentration of Al2O3 is the principal object in order to improve the corrosion resistance of the deposit, which has been made by electroplating on steel substrates previously treated, have been studied by several characterization methods, as the X-ray diffraction, measurement of micro hardness and scanning electron microscopy (SEM), protection against corrosion properties studied in a solution of 3% NaCl in the potentiodynamic polarization measurements (Tafel), electrochemical impedance spectroscopy (EIS) to the potential of corrosion free. The parameters that characterize the corrosion behavior can be determined from the plots and Nyquist plots and chronopotentiometry. Trends of increasing the charge transfer resistance and the decrease of capacitance values. XRD and SEM results and identify any coatings Zn-Ni and Zn-Zn-Ni-Al2O3 alloy composition have similar phase ( γ-phase structure) and the addition of Al2O3 in the Zn-Ni matrix increases the microhardness, and we note the maximum hardness is obtained for 50 g/L Al2O3.
1) Introduction
Electroplated binary Zn–Malloys, where metals is an Fe group such as Ni, Co and Fe, exhibit improved properties compared to pure Zn [1-5]. It is well-known that zinc alloys can provide protection of steel against corrosion, with Zn–Ni, Zn–Co and Zn–Fe being most commonly used [6,7]. The use of specific bath additives has also been found beneficial with respect to corrosion resistance, even for low contents of Meals [6]. Electrodeposited Zn–Ni alloys exist in the form of three dominant phases: α,γ and η. The α-phase is a solid solution of Zn in Ni with an equilibrium solubility of about 30 % Zn. The η-phase is a solid solution of Ni in Zn, with a Ni solubility of less than 1 %. The composition range of the pure γ-single phase was determined to be between 10 and 30 % Ni. The amount of Ni in the alloy, which finds industrial application in the corrosion protection field, is around 15% and its dominant structure is the γ-phase Zn21Ni5 [8] , Electroplated co-deposition is widely used for preparing metal matrix composite coatings because of its low cost and versatility. In general, hard oxide such as Al2O3, TiO2, ZrO2, SiO2, SiC, incorporation of second-phase and established applications and possess good chemical stability, high microhardness, and good wear resistance and corrosion resistance at elevated temperature [9–14]. Zn–Ni composite coatings for example Zn–Ni–Al2O3 [9, 10, 15,16], Zn–Ni–TiO2 [11,17], Zn–Ni–SiO2 [13] and Ni–Zn– P [14] ,ZnNi–SiC[16,18] , this research work was to codeposit nano- Al2O3 particles into the Zn-Ni alloy coatings deposits on a mild steel substrate.under in order to improve the surface properties and the corrosion resistance in aggressive media Then, the composite coatings had been characterized, morphological (SEM), structural (XRD), and electrochemical properties of the composite coatings had been studied by potentiodynamic polarization and electrochemical impedance spectroscopy in a solution of 3 % NaCl.
2 Experimental 2.1 Coating processes
The deposition of Zn–Ni coatings was carried out onto steel substrates under galvanostatic conditions at operating current density of 30 A cm−2 and a temperature of 30°С, The chemical composition of the basic electrolyte of Zn–Ni alloys deposition was given in Table 1 [8]. Electrodeposits Zn–Ni were obtained by varying the concentration of Al2O3 in the bath (0, 30, 50 g·L−1).
2.2 Coating characterization
XRD characterization of samples was carried out with a D8 Advance-Brucker using a Cu Kα line at λ= 0.1540 nm in the 2ϴ ranged of 10–95° in steps of 0.02° at a scan speed 2°/min. Bruker GAADS soft-ware was utilized to calculate.
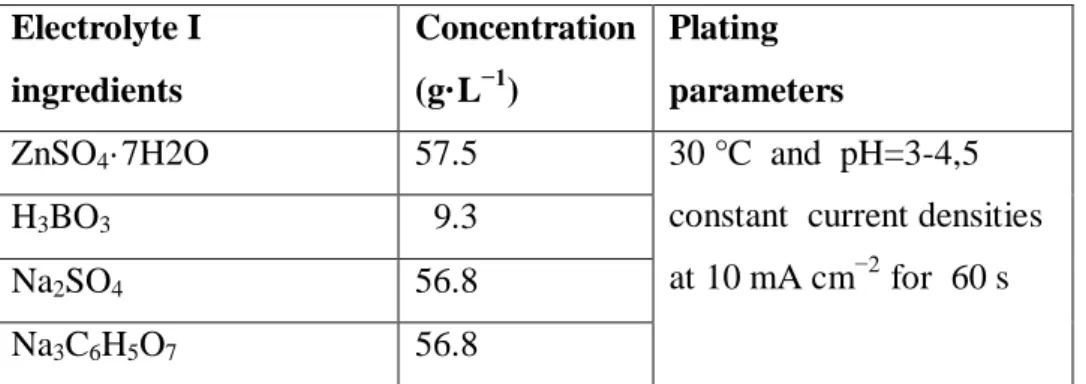
Table 1 Electrolyte I composition and conditions for alloy plating.
Electrolyte I ingredients Concentration (g·L−1) Plating parameters
ZnSO4·7H2O 57.5 30 °C and pH=3-4,5
constant current densities at 10 mA cm−2 for 60 s
H3BO3 9.3
Na2SO4 56.8
Na3C6H5O7 56.8
the biaxial stress along the lateral and longitudinal directions with 2D area detector using a standard 2ϴ sin2Ѱ method [19]. The average grain size of the coatings was determined from X-ray peak broadening by applying the Scherrer formula [20,21]:
where D is the grain size, is the X-ray wavelength (λ = 1.5406 A), β is the full width at half-maximum (FWHM), and θ is Bragg angle position of peak. For (330) reflections and peak broadening was measured by the integral width method [22] , Surface morphology of the deposits was followed with A JEOL (model JSM6390LV) ,Microhardness of coatings was measured using a load of 100 g with a holding time of 15 s by using a Vickers hardness tester(HV) of deposits were performed in the surface by using a Wolpert Wilson Instruments (model 402UD) [23].
2.3 Electrochemical measurements
Corrosion behavior and protection performance of Zn–Ni and Zn–Ni–Al2O3 alloy coatings was studied by using electrochemical impedance spectroscopy (EIS) and electrochemical Tafel extrapolation in 3 % NaCl solution. The tests were performed using a potentiostat /ga- lvanostat (using a Volta Lab 40), The working electrode was a coated sample, the counter
electrode was platinum with an area of 1 cm2 and the reference electrode was Hg/HgO/ 1 M KOH. All potentials in the text have been referred to this reference electrode. Electrochemical impedance spectroscopy (EIS) measurements were obtained at the open circuit potential (OCP) in a frequency range of 10 kHz–0.001 Hz, with an applied AC signal amplitude perturbation of 10 mV. During the measuring process of Tafel polarizing curves, the polarization curve scanning rate was 5 mV/s, with a scanning range from ‒0.25 V of open circuit potential to +0.25 V of open circuit potential. The ECorr and ICorr were determined from
the intercepts by Tafel extrapolation method .The chronoamperometric studies were conducted to identify the nucleation mode of Zn–Ni–Al2O3 composite and Zn–Ni alloy coatings at potentials E=500mv, vs. Hg/HgO applied for 1 hours of 3% NaCl. This potentiostatic technique has proved to be a powerful tool for evaluation of the nucleation mode by electrocrystallization
3. Results and discussions 3.1. X-ray diffraction
Fig.1 shows the XRD results for Zn–Ni composite coatings , the phase structure is single
γ-Ni5Zn21 phase [ 2,10]. The grain sizes, being the (330) plane always the most intense,Crystallite sizes of the coatings were calculated from the X-ray peak broadening of the (330) diffraction peak using Scherrer's formula , which is well suited to detect grain diameters less than 100 nm, and has been used widely for Zn–Ni deposits [ 10,24]. The grain sizes of all of the coatings were on a nanometer scale, confirming the nanocrystalline structure of coatings. Zn–Ni–Al2O3 coatings showed a smaller grain size compared to the Zn–Ni alloy coating . Zn–Ni alloy deposited in electrolyte I, exhibited a crystallite size of 45 nm, whereas the crystallite size of Zn–Ni alloy coating deposited in electrolyte I+50 g·L−1 Al2O3 decreased to 24 nm. This finer structure presence of smaller grains explained probably the increase microhardness .
Fig 1 XRD patterns of Zn–Ni alloy coatings electrodeposited onto steel substrate at different concentrations of Al2O3). Composite coatings deposited at 30 mA/cm2, T = 30 °C, and pH 3-4,5 for 60 s.
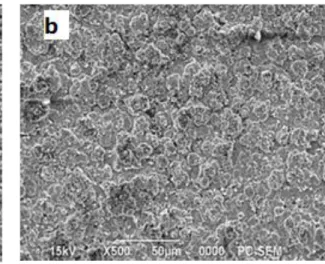
3.2. Surface morphology
The morphology of these coatings plated in different compositions is presented in Fig. 2, Further that the Zn–Ni alloy exhibits a uniform [8], Zn-Ni-Al2O3 composite coating was uniform and compact, with a fine grained morphology. Therefore, the presence of Al2O3 in the electroplating bath and incorporation of Al2O3 in the Zn–Ni coating, increased refinement of crystal size [10],
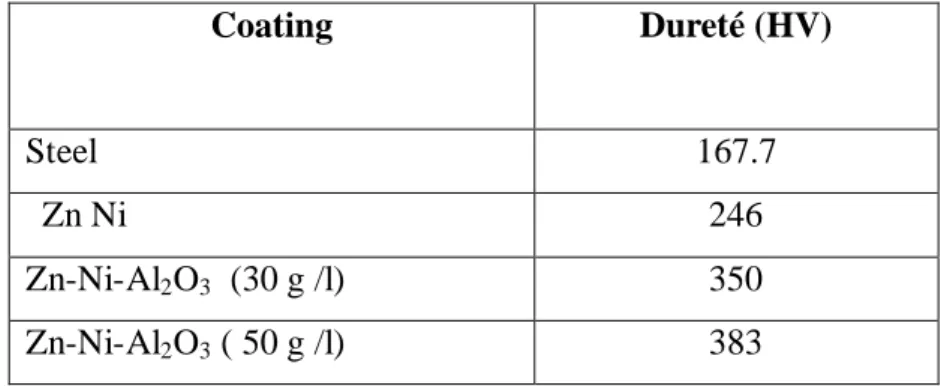
Table 2 Values of micro-hardness Vickers hardness (HV) registered different electro deposition
3.3. Effect of Al2O3 content in the bath on microhardness of the coatings
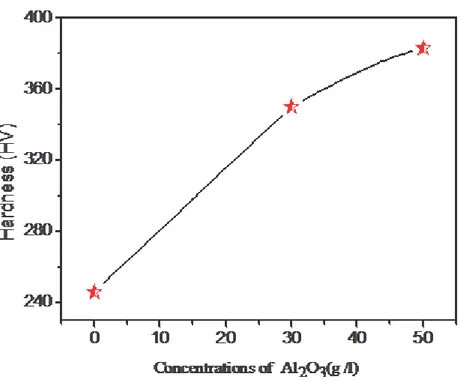
The microhardness results are presented in Figs. 3, showing the change in hardness of Zn–Ni alloy and the Zn–Ni–Al2O3 nanocomposite coatings as a function of the concentrations of Al2O3,indicates that the microhardness of all Zn-Ni-Al2O3 composite coatings is considerably
Coating Dureté (HV)
Steel 167.7
Zn Ni 246
Zn-Ni-Al2O3 (30 g /l) 350
higher than the Ni–Zn alloy coatings. the hardness increased from 246 Hv for Zn–Ni [8], alloy to 350 and 383 Hv for 30 and 50 g /l Al2O3 nanocomposite coating respectively.. Hardness of composite coatings containing Al2O3 has been attributed to the hindrance of dislocation movement by Al2O3 particles [9, 15,25], the hardness of nanocomposite coating depends directly on the alumina content of nanocomposite coating.
Fig 2 Surface morphology of (a) Zn–Ni alloy coatings and (b) Zn–Ni–Al2O3 (30 g /l Al2O3), (c) Zn–Ni–Al2O3 (50 g /l Al2O3) Composite coatings deposited at 30 mA/cm2, T = 30 °C, and pH 3-4,5 for 60 s.
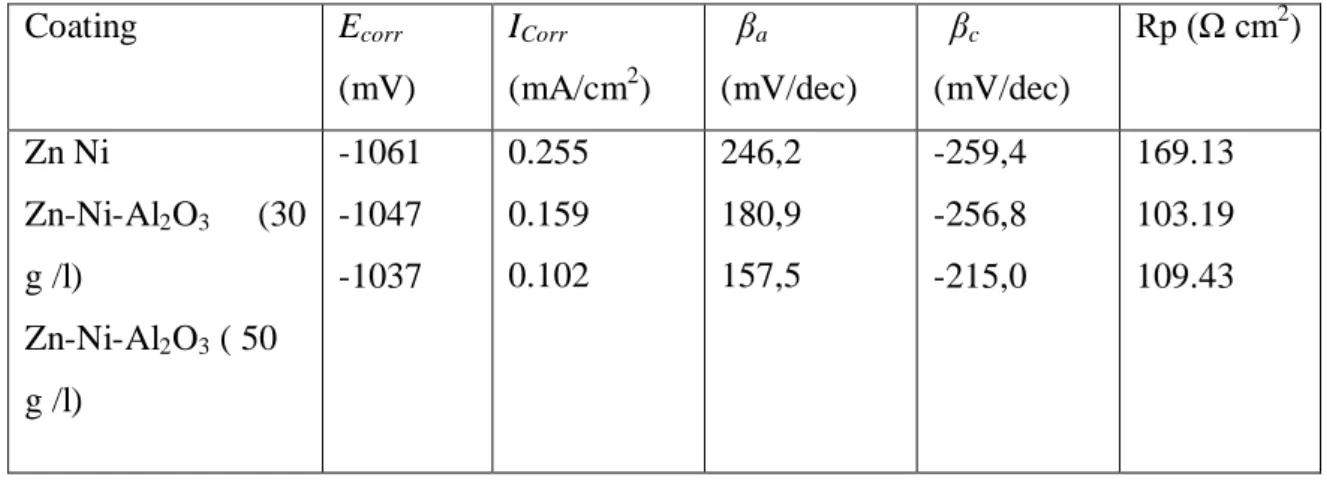
Table 3 The electrochemical parameters (Ecorr, ICorr, βa, βc) of the coatings samples in a 3 % NaCl solution.
2.4 Corrosion studies
3.4.1. Potentiodynamic polarization studies
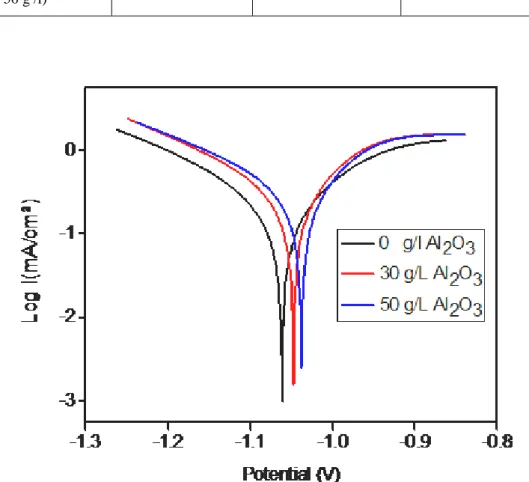
Fig. 4 shows the Tafel curves measured for the Zn–Ni alloy coating and Zn–Ni–Al2O3 nanocomposite coating in 3 % NaCl solution The corrosion potentials and corrosion currents calculated from Tafel plots [12] , The corrosion potential Ecorr ,the polarization resistance Rp and corrosion current (icorr) . Values were determined from this figure and cited in Table 3.
The corrosion potential and corrosion current for the Zn-Ni-Al2O3 (50 g /l) nanocomposite coating, obtained from the polarization curves were -1,0376 V and 0.255 mA/cm2 respectively and those for the Zn–Ni alloy coating were determined to be -1,0614 V and 0.1025 mA/cm2, respectively. It is seen that the nanocomposite coatings have lower positive corrosion potentials and smaller corrosion current densities than the Zn–Ni alloy coating. the Zn–Ni–Al2O3 nanocomposite coatings have better corrosion resistance than the Zn–Ni alloy, The corrosion potential increased with the increase of nano-alumina content [15].
Coating Ecorr (mV) ICorr (mA/cm2) βa (mV/dec) βc (mV/dec) Rp (Ω cm2 ) Zn Ni Zn-Ni-Al2O3 (30 g /l) Zn-Ni-Al2O3 ( 50 g /l) -1061 -1047 -1037 0.255 0.159 0.102 246,2 180,9 157,5 -259,4 -256,8 -215,0 169.13 103.19 109.43
Fig 3 The effect of nano-alumina contents in the composite coatings on the hardness of deposits. Zn–Ni alloy and Zn–Ni–Al2O3 nanocomposite coatings.
3.4.2. Electrochemical impedance spectroscopy (EIS) studies
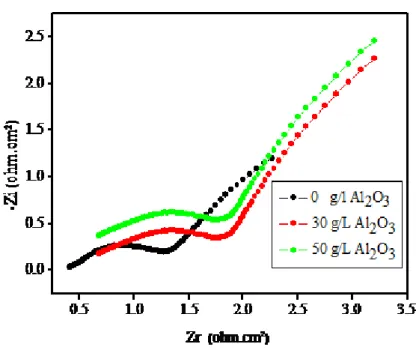
Fig 6 presented a comparison of Nyquist responses obtained for Ni alloy coatings and
Zn-Ni alloy composites elaborated under the same quantities of electricity in 3% NaCl solution . L'impédance, Dans le Plan de Nyquist, is represented by a boucle capacitive ,The charge transfer resistance (Rct), the Warburg impedance (Zw) and the capacity of the double layer (Cdl) are determined by analysis of the complex-plane impedance plot and the equivalent circuit model. From the data obtained in Table 3, the spectra presented show at least two time constants. The first time constant, recorded at higher frequency, where the properties of a electrode/electrolyte interface are particularly reflected, is displayed as a depressed incomplete semicircle. The electrical-equivalent-circuit (EEC) parameters, describing the process included in this time constant are Rct and Cdl. The second time constant, depicted at lower frequencies, corresponds to a straight line Figs 6 . This linear dependence between the imaginary and real part of the capacitance is related to the diffusion process of the soluble species, while is called Warburg impedance. Therefore, EEC parameters describing the process included in the second time constant clearly indicates the diffusion control of the soluble species. The equivalent model used to fit the experimental data is shown in Fig. 5 as previously reported .
Table 4 Table 4: Extracted fitted data from the equivalent circuit of Zn–Ni alloy coatings in a 3 % NaCl Coaing Rp (Ω.cm2) Rs (Ω.cm2 ) Cdl (µF/cm2) Table 5 Zn Ni Table 6 Zn-Ni-Al2O3(30g /l) Zn-Ni-Al2O3 ( 50 g /l) 1.259 1.762 1.797 0.405 0.677 0.697 Table 7 1.310 0.936 0.918
Fig 4 Polarizing curves obtained for the alloy coatings in a 3 % NaCl solution at different concentrations of Al2O3
The data of the charge transfer resistance, Rct, and the capacity of the double layer (Cdl) were calculated using both the Nequist and Bode plots of the impedance spectrum (Table 3) However, the Warburg impedance (Zw) is determined from the following equations :
The Rct can be related to iCorr [26]
Rsol : solution resistance Rct :charge transfer resistance
ba and bc anodic and cathodic tafel slopes
The double layer capacitance Cdl value is obtained from the frequency at which Z imaginary is maximum [26]
The Warburg coefficient σ , can be determined from the slope of the Warburg plot (the slope of real parts of Z, vs. 1/ω1/2; ω=2πF), or by fitting to an equivalent circuit model which includes a Warburg impedance. However, most equivalent circuit modeling programs return “Zw” rather than σ, Zw is the Warburg impedance (Zw =W) which are calculating from the following equation (Table 3):
The increased Rct values and decreased Cdl with increasing Al2O3 content values for the Zn– Ni– Al2O3 alloy clearly confirm the better corrosion resistance. and this behavior is in good agreement with that obtained of the Tafel plot measurements. Zn–Ni– Al2O3 provides better protection against corrosion on the steel substrate [13].
Fig 6 The Nyquist plots obtained Zn–Ni–Al2O3 composite and Zn–Ni alloy coatings electrodeposited at different concentrations of Al2O3.
3.4.3. Chronoamperometry studies
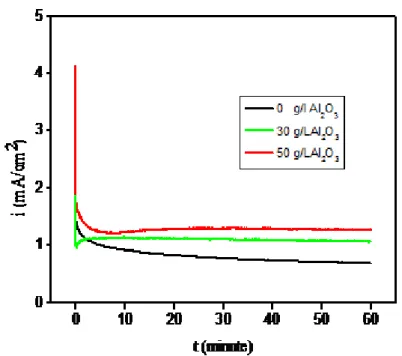
The chronoamperometric studies were conducted to identify the nucleation mode of Zn–Ni– Al2O3 composite and Zn–Ni alloy coatings at potentials E=500mv. This potentiostatic technique has proved to be a powerful tool for evaluation of the nucleation mode by electrocrystallization [10, 27, 28]. The chronoamperometric studies were performed at 30 °C vs. Hg/HgO applied for 1 hours of 3 % NaCl. Fig. 7 The transients have the characteristic shape of a diffusion controlled three-dimensional nucleation [10, 27]. current is observed a rapid decrease , which is typical of a diffusion-controlled process [10,27,29].
Fig 7 Chronoamperograms of Zn–Ni–Al2O3 composite and Zn–Ni alloy coatings at potentials E=500mv, vs. Hg/HgO applied for 1 hours of 3 % NaCl.
4 Conclusion
This work represented the electrodeposition and the corrosion behavior of Zn-Ni alloy deposits elaborated in absence or in presence of 30 and 50 g /l of nano-Al2O3 in the acid sulfate bath. This study was made to evaluate the influence of nanoparticles addition on some properties such as hardness, morphologic structure characteristics, and corrosion resistance. In comparison with Zn-Ni alloy coatings, the results revealed that Zn-Ni alloy composites:
XRD and SEM results indicate all the Zn-Ni alloy coatings have similar composition phase ( γ-phase structure), with smaller crystallite size
The test of the micro-hardness on the various electro deposited coatings has a maximum value 50 g /l of nano-Al2O3, because the increase of nano-Al2O3 concentration in the plating bath increases of micro-hardness.
The corrosion potential increased with the increase of nano-alumina content, while the corrosion current decreased from 0.255 mA/cm2 for Zn–Ni matrix to 0.1020 mA/cm2 for Zn–Ni–Al2O3 composite coating containing 50 g /l nano-alumina .
The data obtained from electrochemical impedance spectroscopy (EIS) assumes that, the charge transfer resistance (Rct) is higher and the capacity of the double layer (Cdl) value is lower for Zn–Ni–Al2O3 composite coating containing 50 g /l nano-alumina alloy compared with those of Zn–Ni matrix. This behavior is in good agreement with that obtained from Tafel plot measurements.
The study of nucleation has determined the growth electrochemical processes in the first moments following an instantaneous nucleation mode in three dimensions (3D) controlled diffusional
ACKNOWLEDGMENTS
I would like to thanks "Responsible of LABORATORY OF THIN FILMS AND APPLICATIONS” FOR THEIR ASSISTANCE IN THE PREPARATION OF THIS WORK
References
[1] A. Conde , M.A. Arenas, J.J. de Damborenea, Corrosion Science 53 (2011) 1489–1497, DOI:10.1016/j.corsci.2011.01.021
[2] Soroor Ghaziof, Wei Gao, Applied Surface Science , 311 (2014) 635–642, DOI:10.1016/j.apsusc.2014.05.127
[3] T.V. Byk , T.V. Gaevskaya, L.S. Tsybulskaya, Surface & Coatings Technology 202 (2008) 5817–5823, DOI:10.1016/j.surfcoat.2008.05.058
[4] Olfa Hammami , Leila Dhouibi, Ezzeddine Triki, Surface & Coatings Technology 203 (2009) 2863–2870, DOI:10.1016/j.surfcoat.2009.02.129
[5] R. Ramanauskas, R. Juškėnas, A. Kaliničenko, L.F. Garfias-Mesias, J. Solid State
Electrochem. 8 (2004) 416, DOI:10.1007/s10008.003–0444–2
[6] N. Eliaz , K. Venkatakrishna , A. Chitharanjan Hegde , Surface & Coatings Technology ,205 (2010) 1969–1978, DOI:10.1016/j.surfcoat.2010.08.077
[7] A. Chitharanjan Hegde , K. Venkatakrishna , N. Eliaz , Surface & Coatings Technology 205 (2010) 2031–2041, DOI:10.1016/j.surfcoat.2010.08.102
[8] Malika Diafi , Nadjette Belhamra , Hachemi Ben Temam, Brahim Gasmi , Said
Benramache Acta Metallurgica Slovaca, 21 (2015) 226-235, DOI
10.12776/ams.v21i3.472
[9] Soroor Ghaziof , Wei Gao , Journal of Alloys and Compounds 622 (2015) 918–924 DOI:.org/10.1016/j.jallcom.2014.11.025
[10] Soroor Ghaziof , Paul A. Kilmartin , Wei Gao , Journal of Electroanalytical Chemistry 755 (2015) 63–70, . DOI:org/10.1016/j.jelechem.2015.07.041
[11] Olfa Hammami. Leila Dhouibi . Patrice Berc¸ot . El Mustafa Rezrazi. J Appl Electrochem 44 (2014)115–121, DOI 10.1007/s10800-013-0613-7
[12] Lei Shi , Chufeng Sun , Ping Gao , Feng Zhou , Weimin Liu ,Applied Surface Science 252 (2006) 3591–3599 ,DOI:10.1016/j.apsusc.2005.05.035
[13] Olfa Hammami, LeilaDhouibi, Patrice Berc¸ot, ElMustafa Rezrazi, and Ezzeddine Triki , International Journal of Corrosion ,Volume 2012, Article ID 301392, 8 pages , Doi:10.1155/2012/301392
[14] S. Pouladi , M.H. Shariat, M.E. Bahrololoom , Surface & Coatings Technology 213 (2012) 33–40, Doi.org/10.1016/j.surfcoat.2012.10.011
[15] Huan-Yu Zheng, Mao-Zhong An , Journal of Alloys and Compounds 459 (2008) 548– 552, Doi.10.1016/j.jallcom.2007.05.043
[16] Paulo C. Tulio, Stanley E.B. Rodrigues, Ivani A. Carlos, Surface & Coatings Technology 202 (2007) 91–99, Doi:10.1016/j.surfcoat.2007.04.084
[17] A. Gome , I. Almeida , T. Frade , A. C. Tavares, J Nanopart Res (2012) ,DOI 10.1007/s11051-011-0692-5
[18] C. Mu ller, M. Sarret, M. Benballa, Surface and Coatings Technology 162 (2002) 49–53, PII: S0257-8972Ž02.00360-2
[19] K.R. Sriraman, S. Brahimi, J.A. Szpunar, J.H. Osborned, S. Yue: Electrochimica Acta,105, (2013)314– 323, DOI:10.1016/j.electacta.2013.05.010
[20] F.Z. Lemmadi, A. Chala, O. Belahssen, S. Benramache: Acta Metallurgica Slovaca, 20(2014)375-380, DOI:10.12776/ams.v20i4.354
[21] S. Benramache, B. Benhaoua, O. Belahssen: Optik,125(2014) 5864-5868, DOI:10.1016/j.ijleo.2014.07.055
[22] S.H. Mosavat, M.H. Shariat, M.E. Bahrololoom: Corrosion Science, 59(2012)81–87, DOI:10.1016/j.corsci.2012.02.012
[23] S. Ghaziof, W. Gao: Journal of Alloys and Compounds, 622(2015)918–924, DOI:10.1016/j.jallcom.2014.11.025
[24] K.R. Sriraman, H.W. Strauss, S. Brahimi, R.R. Chromik, J.A. Szpunar, J.H. Osborne, Tribol. Int. l.56, (2012) 107–120.Doi:10.1016/j.triboint.2012.06.008
[25] A.M. Alfantazi, U. Erb: Materials Science and Engineering A,212(1996)p.123–129, DOI:10.1016/0921-5093(96)10187-8
[26] B. Subramanian , S. Mohan, Sobha Jayakrishnan , Surface & Coatings Technology 201 (2006) 1145–1151, Doi:10.1016/j.surfcoat.2006.01.042
[27] B. Scharifker, G. Hills, Theoretical and experimental studies of multiple nucleation, Electrochim. Acta 28 (1983) 879–889. Doi:10.1016/0013-4686(83)85163-9
[28] Noam Eliaz, Moshe Eliyahu, Journal of Biomedical Materials Research Part A, 2006 ,DOI: 10.1002/jbm.a.30944
[29] K. Raeissi, A. Saatchi, M. Golozar, Effect of nucleation mode on the morphology and texture of electrodeposited zinc, J. Appl. Electrochem. 33 (2003) 635–642. 10.1023/A:1024914503902