HAL Id: hal-02918852
https://hal-mines-albi.archives-ouvertes.fr/hal-02918852
Submitted on 1 Sep 2020
HAL is a multi-disciplinary open access
archive for the deposit and dissemination of
sci-entific research documents, whether they are
pub-lished or not. The documents may come from
teaching and research institutions in France or
abroad, or from public or private research centers.
L’archive ouverte pluridisciplinaire HAL, est
destinée au dépôt et à la diffusion de documents
scientifiques de niveau recherche, publiés ou non,
émanant des établissements d’enseignement et de
recherche français ou étrangers, des laboratoires
publics ou privés.
Gasification of biofuels blended from olive mill solid
wastes and pine sawdust under different carbon
dioxide/nitrogen atmospheres
M. Zribi, M. Lajili, Francisco Javier Escudero Sanz
To cite this version:
M. Zribi, M. Lajili, Francisco Javier Escudero Sanz. Gasification of biofuels blended from olive mill
solid wastes and pine sawdust under different carbon dioxide/nitrogen atmospheres. Fuel, Elsevier,
2020, 282, pp.1-8/118822. �10.1016/j.fuel.2020.118822�. �hal-02918852�
Gasi
fication of biofuels blended from olive mill solid wastes and pine
sawdust under di
fferent carbon dioxide/nitrogen atmospheres
M. Zribi
a, M. Lajili
a,⁎, F.J. Escudero-Sanz
baUR: EMIR (Étude des Milieux Ionisés et Réactifs), IPEIM, Monastir 5019, Tunisia
bRAPSODEE: Centre de recherche d'Albi en génie des procédés des solides divisés, de l'énergie et de l'environnement, École des mines d'Albi Carmaux, Campus Jarlard
81013 Albi CT Cédex 09, France
Keywords: Biochar CO2gasifier Conversion Rate of conversion Char reactivity A B S T R A C T
In this paper, we investigated the gasification of charcoals using a macro TG under CO2mixed with nitrogen at
different percentages (40%, 70% and 100% CO2) and at different fixed temperatures (750 °C, 800 °C, and
900 °C). For this purpose, two raw residues were selected; the exhausted olive mill solid wastes (EOMSW) and the pine sawdust (PS). Then, four different samples, which have not been previously studied with a gasification process, were prepared from these residues when investigating the impregnated and the non-impregnated ones using the olive mill waste water (OMWW) as by-product for the impregnation process. Moreover, a comparison between results obtained during this study and those obtained during a previous study based on steam gasi fi-cation was carried out. It was found that the mass loss profiles are consistent with the usual lignocellulosic gasification behaviors. Also, the increase of temperatures or CO2percentages affects positively the conversion,
the gasification rate and the char reactivity. It is worth noting that CO2acts differently from steam. With steam,
gasification is found to be faster and more reactive.
1. Introduction
Fossil fuel combustion has contributed greatly to the unprecedented levels of pollution affecting the environment. These effects on the en-vironment have resulted in renewed interest in renewable energy sources. In this context, biomass and more specifically biofuels have emerged as a sustainable source to meet energy demand thanks to its high availability and low cost. Indeed, biomass presently contributes 10–15% of the global energy demand, which places it in third place after coal and oil[1–3]. The sources of biomass, of course, vary from one region to region and between countries. For Tunisia, the olive mill solid wastes (OMSW) and the olive mill wastewater (OMWW) provided by olive oil manufactures are the most available biomass resources averaging about 400,000 tons of OMSW and about 1,200,000 tons of OMWW per year. For France, major contributors to biomass include forest residues [4](oaks, pines, holm oaks and cork oaks) and agri-cultural residues [5] (cereal residues, vegetables wastes and fruit wastes). It should be remembered that on the basis of 1 ton of OMSW, up to 10% of residual oil can be extracted for the manufacture of any kind of soap (liquid/solid). The rest (approximately 900 kg per metric ton) of solid residue can provide furfural (10%) after proper chemical treatment using hydrolysis with sulphuric acid 0.1 M, and extraction
using CCl4. The rest which is about 800 kg per ton can be used as solid
fuel[6]. Currently, Tunisia exports exhausted olive mill solid wastes (EOMSW) to European countries (mainly Italy and Spain), which are used as fuel for industrial furnaces. These data justify our choice on OMSW and on pine sawdust (PS) in order to carry out the present study. The annual world OMWW production varies from 7 to over 30 million m3[7]. The volume of OMWW produced during the 3-phase process (olive black water) is 0.5–0.8 m3/ton of olive[8]. This by-product is a
complex pollutant mixture causing serious ecological problems when stored in huge quantities in natural basins without any treatment. In-deed, the OMWW is characterized by its chemical oxygen demand (COD) and its biological oxygen demand (BOD) reaching high con-centrations of 100 and 220 kg.m−3, respectively. Moreover, the OMWW, which consists of organic and inorganic compounds, is char-acterized by its high acidity[9,10]. The main organic compounds of this type of biomass are lignin, tannin, phenolics, long-chain fatty acid responsible of phytotoxic and antibacterial activities. The principal inorganic compounds are potassium, calcium, sodium, magnesium etc.
[7,10–12]. However, several researches have confirmed that OMWW can be impregnated on dry biomasses to produce green fuels with im-proved quality[13], for agricultural irrigation or as soil fertilizers when used in small quantities, and as fuel since it holds a great energetic
⁎Corresponding author.
E-mail addresses:marzouk.lajili@ipeim.rnu.tn(M. Lajili),javier.escuderosanz@mines-albi.fr(F.J. Escudero-Sanz).
potential (up to 18 MJ/kg, dry basis)[11]. This work shows the im-portance of the impregnation procedure using the OMWW by-product due to its richness in organic/inorganic matter. Note that biomass can be valorized energetically by three routes: physicochemical, biochem-ical and thermochembiochem-ical [14] routes. The thermochemical route in-cludes pyrolysis[15,16], combustion[17,18], gasification[19,20]etc. In the present study, two different processes were investigated: an isothermic pyrolysis for producing charcoal in a horizontal furnace, and then a gasification of the prepared charcoal in a Macro-TG. Our choice is based on theflexibility of such process with different types of biomass that can be converted into Syngas generating all kinds of secondary energy[21]. It is a relatively new process well known as a new en-vironmentally friendly process needing relatively high temperatures of up to 1400 °C[22–24]. Biomass gasification involves gasifiers such as the supply of air, steam or carbon dioxide mixed with an inert gas like nitrogen or argon [25,26]. However, the use of CO2 in gasification
appears as a promising strategy that can also reduce CO2emissions. In
this scenario, CO2reacts in the gas phase with hydrogen molecules
according to the reverse water gas shift reaction[27]:
+ → + = +
CO2 H2 H O2 CO Δ H 41.2 kJ/mol (1) CO2can also react with hydrocarbons such as methane via the dry
reforming reaction:
+ → + = +
CO2 CH4 2H2 2CO Δ H 246.9kJ/mol (2) Moreover, CO2 can react with the carbon contained in the char
prepared by the pyrolysis process according to the heterogeneous Boudouard reaction:
+ → H= −
C CO2 2CO Δ 179.5kJ/mol (3)
+ ↔ H= −
C 2H2 CH4 Δ 75kJ/mol (4)
Furthermore, the pyrogasification is a complex process involving three main steps: pyrolysis, volatile-matter reforming and char gasifi-cation. The char gasification reaction is considered as the limiting step of the process because it is slower compared to the other steps[28].
Which motivates us is the fact that we value an abundant biomass in Tunisia (EOMSW) and another abundant biomass in France and in Europe (PS) using an innovative process (the gasification). Moreover, the chars’ reactivity’s and the competitiveness between two gasifiers (CO2and H2O) at different concentrations and temperatures were
in-vestigated. This could solve the problem of lack of energy for Tunisia and the problem of pollution caused by the OMWW. Besides, this policy reduces the effect of overexploitation of forests and wood by-products in Europe. Moreover, a key feature of this study was the fact that these samples were rarely studied by thermochemical processes, but perhaps never by gasification under CO2. Hence, after preliminary preparation
of the char in the horizontal furnace, we conducted fast gasification tests under an atmosphere of a mixture of N2and CO2. We focused on
the effect of the CO2percentages and temperatures on the conversion
and its rate and the char reactivity. Moreover, a comparison between these tests and those realized in a previous study[29]allows identifying which gasifier is more efficient.
2. Material and methods 2.1. Samples preparation
The olive mill solid wastes (EOMSW) used in this work were ob-tained from the olive oil and soap factory of Zouila, Tunisia, while, the pine sawdust (PS) was provided by a wood factory situated in France. Samples were prepared using the same procedure detailed in our pre-vious study[12,29]. Four samples types were prepared from the den-sified residues with and without impregnation with the olive mill wastewater (OMWW):
•
PS: composed of 100% pine sawdust.•
PS-OMWW: impregnated PS by OMWW.•
EOMSW-OMWW: Impregnated EOMSW by OMWW.•
EOMSW: composed of 100% olive mill solid waste.The PS-OMWW and EOMSW-OMWW were prepared when adding 100 kg of OMWW with 89% of moisture (in wet basis) to 20 kg of PS and 20 kg of EOMSW in a ratio (5:1) for each sample respectively (for more details see[12]). During the impregnation phase, it is impossible to use more of OMWW (overcome the ratio 5:1) because of the lim-itation of adsorption.
After pyrolysis, the obtained chars were crushed and sieved re-sulting in a powder with particle sizes less than 100μm.
2.2. Methods
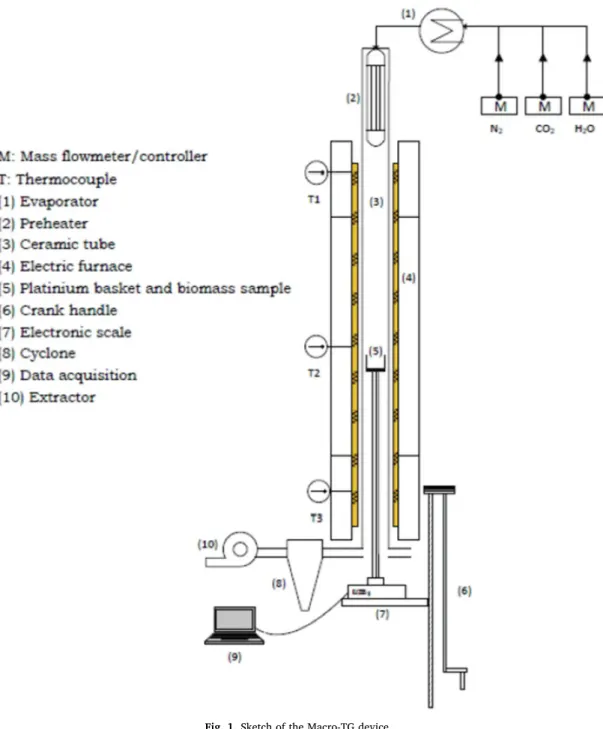
To prevent the negative impact on the reactivity during gasification between volatiles and chars, it is recommended to carry out an atypical gasification strategy separating pyrolysis and gasification into two se-parate steps[30,31]. In afirst step, slow pyrolysis was carried out under an inert atmosphere using a horizontal furnace in order to produce the recommended chars used during the gasification step. In a second step, the samples were crushed and sieved. The obtained product is a powder of less than 100 µm size. Then, themogravimetric analyses were carried out using a Macro-TG reactor as illustrated inFig. 1(see ref. to[32]for a more detailed discussion). The plate on which the samples must be placed has a surface of 16π10-4
m2(about 8 cm diameter). The average speed of thefluid entering the reactor cannot exceed 0.2 m/s to ensure that theflow remains laminar. The volume flow of nitrogen was 6 10-3
Nm3/min. At every experimental run, when the sample is placed in the middle of the electric furnace, we monitor the mass loss using Elec-tronic scales with 1 μg precision (Sartorius Analytical Balance MSU524S-100-DI).
However, when heating the platinum basket, on which the samples are placed, and the ceramic tubes in which circulates the gasflow, the flowing gas dynamic pressure (whichh combines the force exerted on the basket and the drag forces along the ceramic tubes) yields the mass change up to thermal equilibrium. Once such thermal equilibrium was reached and the gas flow was stabilized around the basket and the ceramic tubes, the displayed mass will remain constant. In order to overcome this problem, a preliminary blank test is needed. Then, by simple elimination between blank and real tests, the real mass loss can be determined and corrected for. In this study, we define some key parameters characterizing the gasification process:
The char’s reactivity was obtained following the expression: = − R 1 X dX dt t (5)
Where X is the conversion of char during the gasification, which is defined as: = − − X m m m m 0 t 0 ash (6)
In this expression, m0, mtand mashare the initial mass of char, the
mass at instant t and the mass of the residual ash, respectively. Moreover, when following the Hognon et al.[33]demarche, it is pos-sible to determine an intrinsic and constant kinetic parameter k. Indeed, the kinetic law governing the gasification can be simply written as:
= dX
dt k(PCO2, T)F(x) (7)
where k is the intrinsic kinetic parameter, PCO2is the carbon dioxide
partial pressure, and F(x) is a structural function describing the change in active sites concentration. This function can be obtained from ex-perimental results at any conversion level following the equation:
= F(X) R(X)
R(ref) (8)
Note that the partial pressure of a component of a gas mixture is the product of the molar fraction of this component and the total pressure of the mixture (Raoult’s law):
=
Pi x Pi (9)
In our study, the rate of conversion, the reactivity and the structural function are determined for a conversion between 0.2 and 0.8 when the reference reactivity wasfixed at X = 0.5[28,34,35]. This range was chosen to minimize uncertainties for the small mass loss in the early stages of the reaction (X ∊[0, 0.2]), and to avoid high reactivity values in thefinal stages of the reaction (X ∊[0.8, 1.0])[28].
Correlations expressing k as a function of temperature and partial pressure were reported in the literature [25]. Moreover, a common expression for k is the following:
= ⎛ ⎝ − ⎞ ⎠ k Aexp E RT P a COb 2 (10) where A is the pre-exponential factor, Eais the activation energy, R is
the universal gas constant and b is an exponent highlighting the in-fluence of the CO2partial pressure. The latter parameters can be
de-termined only experimentally. For this study, and because of the ab-sence of alternative models for the gasification of these samples types in the literature, we chose to start with a simple model[36]:
= −
dX
dt k P(CO2,T)(1 X) (11)
By integration of Eq.11, the conversion × takes the following ex-pression:
= − −
X 1 exp( k t1) (12)
where, k1 is a kinetic constant which could be determined by least
squares regression method (Table 1).
3. Results and discussions
In this section, we discuss the effects of the temperature and the CO2
partial pressure on the char gasification process for the samples under investigation. A comparison between the effect of the carbon dioxide and the steam will be also carried out. To study the reactivity profiles, we performed experiments in which we varied the temperature at constant gas partial pressure and vice versa. The Labview system’s ac-quisition allows us to record the mass loss of char during gasification. By using Eq. (6), it is possible to calculate the conversion X at each elapsed time step.
3.1. CO2 gasification experiments
3.1.1. Effects of the CO2 percentage on the Conversion, the rate of
conversion and the char reactivity
Fig. 2shows the influence of the variation of the CO2percentage on
the conversion. In agreement with[28,37,38], it is obvious that when the CO2percentage is increased from 40 to 100%, the char conversion
gradually increases and simultaneously the required time of the char gasification gradually decreases.
At a reference temperature of 750 °C, a conversion level of 90% was reached after 350, 500 and 700 s in gasifying atmospheres containing 100%, 70% and 40% of CO2, respectively. Therefore, increasing of the
CO2from 40% to 100% results in a doubling of the higher char
re-activity. Similar behaviors were found at 800 and 900 °C.
Experimental and modelled conversions were compared versus time as shown onFig. 2. It is seen that model and experiment exhibit the same trend [33]. However, we do not observe a perfect agreement between results of the experiment and of the model. This may be at-tributed to the fact that the chosen model is not very suitable to the studied sample type. This result will provide some guidance to improve the model by considering the samples’ inorganic composition (mainly
K, Si, P) because of their crucial role in the kinetics of gasification due to their catalytic effects.
Figs. 3 and4 illustrate the influence of the CO2 on the rate of
conversion and the char reactivity at 750 °C for PS-OMWW, respec-tively. It can be clearly seen that the char reactivity increases as the CO2
percentage is increased from 40 to 100%. This result was expected since with a higher CO2concentration, the probability of reaction on
avail-able active sites on the char surface area increases. Furthermore, this result shows that there is no CO2percentage effect limitation as it was
stated by Guizani et al.[28]for whom 30% CO2is the limit for
max-imum reactivity. This is may be attributed to the specificity of samples used in this study (mainly organic and inorganic composition) per rapport to wood chips used by Guizani et al.[28].
3.1.2. Effects of the temperature on the Conversion, the rate of conversion and the char reactivity
The effect of the temperature on the conversion is evaluated using experiments realized with temperature ranging between 750 and 900 °C.Fig. 5shows the char conversion evolution versus elapsed time when testing EOMSW for a percentage of 100% CO2 and for three
different temperatures. The results show an increase in the char con-version and, consequently, a decrease of the characteristic time of
Table 1
Kinetic constant values during PSOMWW gasi fica-tion at 750 °C.
CO2 % s−1unit
100% CO2 k1= 0,0069
70% CO2 k2= 0,0051
40% CO2 k3= 0,0033
Fig. 2. Influence of the CO2percentage on the conversion of impregnated PS by
OMWW at 750 °C. Solid and dashed lines correspond to experiment and model (Eq. (12)) respectively.
Fig. 3. Influence of CO2percentage on the rate of conversion at 750 °C for
impregnated PS by OMWW.
Fig. 4. Influence of CO2 percentage on the char gasification reactivity at 750 °C for impregnated PS by OMWW.
gasification. This conclusion is consistent with some results reported in the literature [39–41]. Indeed, Tong et al. [39]realized lignite char gasification tests using CO2, H2O and their mixture in afluidized bed
reactor. They observed that the reactivity of gasification enhances ra-pidly when the temperature increases from 1333 °C to 1483 °C. As for Mani et al.[40], they noticed that at a rate of conversion equal to 50% during biomass char gasification with CO2the reactivity increases with
temperature, and it decreases as the particle size increases. In addition, Hodge et al.[41]concluded that conversion during coal chars gasi fi-cation with CO2increases with increasing residence time and reaction
wall temperature. In the present study and conformingly toFig. 5, the complete conversion was reached after 100, 500, 1080 s with tem-peratures of 900, 800, 750 °C, respectively. Accordingly, a 150 °C in-crease in the gasification temperature ten-fold inin-crease in reactivity
[35].
The kinetic constant k is also determined for the EOMSW using least squares regression (Table 2) to compare the experimental and modelled conversions inFig. 5. Moreover, except 900 °C curve profile for which the model and experimental curves are in a good agreement, the two other profiles show discrepancies. This allows to the conclusion that the model we used is not very suitable for these types of samples and for certain range of temperature.
Besides, for a given percentage of CO2, the effect of the variation of
the temperature from 750 to 900 °C on the rate of conversion and the char’s reactivity is shown inFig. 6, andFig. 7. One can conclude that the samples become more reactive when temperature is increased
[28,35]. Indeed, the influence of temperature can be explained by the
fact that gasification process is governed by several endothermic reac-tions (such as Eqs. (3) and (4)[42]. For example, the carbon hydro-genation resulting in methane formation is enhanced by temperature and the optimum conditions correspond to T above 1100 °C and pres-sures between 0.6 and 0.8 MPa when using nickel as catalyst[43].
3.1.3. Effects of the impregnation by OMWW on the Conversion, the rate of conversion and the char reactivity
The OMWW used for the impregnation process and the production of (EOMSW-OMWW) sample is characterized by organic and inorganic compounds.Table 3shows that alkali metals such as potassium, cal-cium and sodium are highly concentrated in the impregnated samples compared to the raw ones. Moreover, it was reported in the literature that these inorganic elements exhibit catalytic effects during gasifica-tion[44,45].
Fig. 8shows clearly the effect of the OMWW on the char gasification
at 800 °C and for 70% CO2. Indeed, of the impregnation process by
OMWW enhances the char reactivity and reduces the characteristic
Fig. 5. Influence of temperature on the conversion of EOMSW under 100% CO2.
Solid and dashed lines correspond to experiment and model (Eq. (12)) re-spectively.
Table 2
Kinetic constant values during EOMSW gasification under 100% CO2.
Temperature s−1unit
900 °C k1= 0,034
800 °C k2= 0,0076
750 °C k3= 0,0031
Fig. 6. Influence of temperature on the rate of conversion of EOMSW under 100% CO2.
Fig. 7. Influence of temperature on the char gasification reactivity of EOMSW under 100% CO2.
Table 3
Concentration of the main inorganic elements in the used samples (g/kg dry basis).
Parameter EOMSW EOMSW-OMWW PS PS-OMWW
K 3.67 7.53 0.36 3.40
Ca 1.13 1.45 0.36 0.87
time for a 90% of conversion by more than a factor of 3.
Also, as can be seen inFigs. 9and10for a temperature of 800 °C and for 70% CO2, the rate of conversion dX/dt, which is as an indicator
of the samples’ reactivity, depends strongly on the samples’ type. Hence, the addition of the OMWW for each sample enhances its re-activity thanks to its richness in inorganic matter (K, Ca and Na)[6,46].
3.2. H2O vs CO2gasification experiments:
3.2.1. Comparison between the effects of the steam and the carbone dioxide atmospheres
At this stage of the study, one attempt to make comparison between the CO2and the water steam used in our previous work[30]. For this
purpose, we considered two gasification tests realized with (20% H2O,
750 °C) in the previous study and (40% CO2, 750 °C) in the present
work and for the same sample EOMSW-OMWW. The ideal would be to compare exactly under the same conditions of temperature and gasifier percentage. However, even with a lower concentration the effect of H2O
was stronger as it is shown below. The conversion levels versus time are shown inFig. 11. Thefigure shows that the CO2gasification exhibits a
notable increase of the required time for X = 0.9 by nearly two times.
Fig. 8. Influence of the impregnation process on the EOMSW conversion under 70% CO2and at 800 °C.
Fig. 9. Influence of the impregnation process on the rate of conversion of EOMSW under 70% CO2and at 800 °C.
Fig. 10. Influence of the impregnation process on the char gasification re-activity of EOMSW under 70% CO2and at 800 °C.
Fig. 11. Influence of the gasifier agent on the conversion of the impregnated EOMSW at 750 °C.
Fig. 12. Influence of the gasifier agent on the rate of conversion of the EOMSW at 750 °C.
This behavior are consistent with the results reported by [35,39,47]
who proved that at the same temperature, the gasification is enhanced by replacing CO2with H2O.
Figs. 12and13, showing the rates of conversion and the reactivity, confirm the same trend with the rate of CO2gasification being slower
than the rate of the steam gasification. Again, this result is consistent with results reported in the literature[48,49]showing that gasification
with H2O is two tofive times faster than with CO2[35,50]. This gap is
may be due to the difference in the intrinsic reactivity of C-H2O and
C-CO2reactions[35]. Thus, Tong et al.[39]have proved that at the same
temperature, and with three different atmospheres, the gasification rate was higher with: 50%N2/50%H2O, 50%CO2/50%H2O and 50%N2/
50%CO2 respectively, while the order of peak reaction rates was
50%CO2/50%H2O, 50%N2/50%H2O and 50%N2/50%CO2respectively.
Also, they concluded that the average reaction rate in 50%CO2/50%
H2O atmosphere was slower than 50%N2/50%H2O which indicates that
CO2and H2O compete for the same reaction active pores on the char
surface area. Moreover, when increasing the temperature, the compe-tition power of CO2over H2O increases gradually, so that CO2was able
to occupy more active sites (pores) than H2O when the temperature
reaches 1433 °C.
3.3. Determination of the reactivity profile F(X)
Next, we investigate the reactivity profile, F(X).Fig. 14shows this reactivity profile as a function of conversion level, X. The average re-activity profiles for H2O and CO2 show practically the same trends,
except that for the H2O the reactivity profile exhibits a steeper and
more nonlinear trend in terms of X. This may be due, according to[28], to the limited access of the CO2molecules to the core of the char
par-ticle, despite the advanced gasification stage. The average of the function obtained for the H2O gasification experiments has the
fol-lowing expression:
= + +
FH O2 ( )x 1.0223X2 0.4893X 0.7379 (12) While the structural function corresponding to CO2gasification can
be expressed as:
= + +
FCO2( )x 0.6672X2 0.14X 0.8646 (13)
3.4. Synthetic summary on discussions
Following the discussions widely undertaken above, the following points can be noticed:
•
The 4 samples prepared from impregnated and non-impregnated blends of EOMSW and PS using OMWW as impregnation agent show different behaviour compared to woody biomass during gasification. Indeed, we found that there is no CO2percentage effect limitation asit was stated by Guizani et al.[28]for whom 30% CO2is the limit
for maximum reactivity. This is may be attributed to the specificity of samples used in this study (mainly organic and inorganic com-position) per rapport to wood chips used by Guizani et al.[28].
•
Despite that the kinetic model and experiment exhibit the same trend; we do not observe a perfect agreement between results of the experiment and of the model. This may be attributed to the fact that the chosen model by Hognon et al.[33]was simple and not very suitable to the studied sample type. This result will provide some guidance to improve the model by considering the samples’ in-organic composition (mainly K, Si, P) playing a crucial role in the kinetics of gasification due to their catalytic effects.•
The impregnation process using OMWW enriches the samples by inorganic elements which enhance the char reactivity and reduce the characteristic time for a 90% of conversion by more than a factor of 3.•
It was clear that H2O effect is stronger than CO2. Moreover, CO2andH2O compete for the same reaction active pores on the char surface
area. Furthermore, when increasing the temperature, the competi-tion power of CO2over H2O increases gradually, so that CO2was
able to occupy more active sites (pores) than H2O when the
tem-perature reaches high levels.
4. Conclusion
The objective of this work was to carry out gasification experiments on four different chars provided from Tunisian and French biomasses (OMSW, OMWW and PS) under different isothermal temperatures and different percentages of carbon dioxide mixed with nitrogen (N2). It is
shown that the conversion, the rate of conversion and the char’s re-activity increase with temperature for a given carbon dioxide percen-tage and vice versa. Moreover, the EOMSW-OMWW exhibits the highest gasification rate due to the richness of the samples in inorganic ele-ments (K, Na, Ca) concentrated especially in the OMWW. Furthermore, the gasification using the steam was found to be more reactive than the gasification via the carbon dioxide due to the difference in the intrinsic reactivity of C-H2O and C-CO2reactions. Finally, the simple model used
for describing the gasification kinetic was not adequate for the used samples. Hence, an improvement of the model based on inorganic
Fig. 13. Influence of the gasifier agent on the char gasification reactivity of the
EOMSW at 750 °C. Fig. 14. Evolution of structural function versus conversion using steam and
compounds known by their catalytic effects should be investigated in our future work.
CRediT authorship contribution statement
M. Zribi: Validation, Formal analysis, Writing - original draft. M. Lajili: Conceptualization, Methodology, Formal analysis, Investigation, Writing - review & editing, Visualization, Supervision, Project admin-istration.F.J. EscuderoSanz: Methodology, Formal analysis, Writing -review & editing.
Declaration of Competing Interest
The authors declare that they have no known competingfinancial interests or personal relationships that could have appeared to in flu-ence the work reported in this paper.
Acknowledgements
Marwa Zribi would like to express her sincere gratitude to Professor Ange Nzihou the director of Mines Albi and to Professor Sylvain Salvador for receiving her in the RAPSODEE laboratory.
References
[1] Bapat DW, Kulkarni SV, Bhandarkar VP. Design and operating experience on flui-dized bed boiler burning biomass fuels with high alkali ash. Vancouver, New York, NY: ASME; 1997. p. 165–74.
[2] Saidur R, Abdelaziz EA, Demirbas A, Hossain MS, Mekhilef S. A review on biomass as a fuel for boilers. Renew Sustain Energy Rev 2012;15:2262–89.
[3] Heidenreich S, Foscolo PU. New concepts in biomass gasification. Prog Energy Combust Sci 2015;46:72–95.
[4] Felicimo AM, Gomez A, Munoz J. Potential distribution of forest species in dehesas of Extremadura (Spain). Adv Geoecol 2004;37:231–46.
[5] Verma VK, Barm S, Delattin F, Laha P, Vandendeal I, Hubin A, et al. Agropellets for domestic heating boilers: standard laboratory and real life performance. Appl Energy 2012;90:17–23.
[6] Sebban A, Bahloul A, Saadoune M, Kassi AA, Berrada M, Pineau JL, et al. Schéma de valorisation des grignons d’Olives produits les Maasras Marocaines (in French). Déchets-Revue Francophone d’Ecologie Industrielle 2004;34:39–43.
[7] Tsagaraki E, Lazarides HN, Petrotos KB. Olive mill wastewater. In: Oreopoulou V, Russ W, editors. Utilisation of by-products and treatment of waste in the food in-dustry. Springer, Boston: MA; 2007. p. 133–57.
[8] Boari G, Brunetti A, Passino R, Rozzi A. Anaerobic digestion of olive oil mill was-tewater. Agriculture Wastes 1984;10:161–75.
[9] Caputo AC, Scacchia F, Pelagagge PM. Disposal of by-products in olive oil industry: waste to energy solutions. App Therm Eng 2003;23:197–214.
[10] Balice V, Boari G, Cera O, Abbaticchio P. Indagine analittica sulle acque di vege-tazione, Nota 1. Inquinamento 1982;7:49–53.
[11] Jeguirim M, Chouchene A, Reguillon AF, Trouvé G, Le Buzit G. A new valorisation strategy of olive mill waste water: Impregnation on sawdust and combustion. Resour Conserv Recycl 2012;59:4–8.
[12] Kraeim N, Jeguirim M, Limousy L, Lajili M, Dorge S, Michelin L, et al. Impregnation of olive mill wastewater on dry biomasses: Impact on chemical properties and combustion performances. Energy 2014;78:479–89.
[13] Jeguirim M, Dutourmié P, Zopras A, Limousy L. Olive Mill Wastewater: From a pollutant to Green Fuels, Agricultural Water Source and Bio-Fertilizer-Part 1. The drying kinetics. Energies 2017;10:1–16.
[14] McKendry P. Energy production from biomass (part 2): Conversion technologies. Bioresour Technol 2002;83:47–54.
[15] Jahirul MI, Rasul MG, Chowdhury AA, Ashwath N. Biofuels Production through Biomass Pyrolysis-A Technological Review. Energies 2012;5:4952–5001. [16] Gagliano A, Nocera F, Bruno M, Blanco I. Effectiveness of thermodynamic adaptive
equilibrium models for modeling the pyrolysis process. Sustainable Energy Technol Assess 2018;27:74–82.
[17] Kohse-Höinghaus OP, Cool TA, Kasper T, Hansen N, Qi F, Westbrook CK, et al. Angew Chem Int Ed 2010;49:3572–97.
[18] Mami MA, Mätzing H, Gehrmann H-J, Stapf D, Bolduan R, Lajili M. Investigation of the Olive Mill Solid Wastes Pellets Combustion in a Counter-Current Fixed Bed Reactor. Energies 2018;11:1–21.
[19] Sikarwar VS, Zhao M, Fennell PS, Shah N, Anthony EJ. Progress in biofuel
production from gasification. Prog Energy Combust Sci 2017;61:189–248. [20] Farzad S, Mandegari MA, Görgens JF. A Critical review on biomass gasification,
co-gasification, and their environmental assessments. Biofuel Res J 2016;12:483–95. [21] Wu H, Liu Q, Bai Z, Xie G, Zheng J, Su B. Thermodynamics analysis of a novel
steam/air biomass gasification combined cooling, heating and power system with solar energy. App Therm Eng 2020;164:114494.
[22] Umeki K, Yamamoto K, Yochikawa T. High temperature steam-only gasification of woody biomass. Appl Energy 2010;87:791–8.
[23] Zhou J, Chen Q, Zhao H, Cao X, Mei Q, Luo Z, et al. Biomass-Oxygen gasification in a high-temperature entrained-flow gasifier. Biotechnol Adv 2009;27:606–11. [24] Qin K, Lin W, Jensen PA, Jensen AD. High-temperature entrainedflow gasification
of biomass. Fuel 2012;93:589–600.
[25] Di Blasi C. Combustion and gasification rates of cellulosic chars. Prog Energy Combust Sci 2009;35:121–40.
[26] Manatura K, Lu JH, Wu KT, Hsu HT. Exergy analysis on torrefied rice husk pellet in Fluidized Bed gasification. App Therm Eng 2017;111:1016–24.
[27] Ostrowski P, Maj I, Kalisz S, Polok M. Biomass low-temperature gasification in a rotary reactor prior to cofiring of syngas in power boilers. App Therm Eng 2017;118:785–95.
[28] Guizani C, Escudero Sanz FJ, Salvador S. The gasification reactivity of high-heating-rate chars in single and mixed atmospheres of H2O and CO2. Fuel
2013;108:812–23.
[29] Zribi M, Lajili M, Escudero Sanz FJ. Hydrogen enriched syngas production via ga-sification of biofuels pellets/powders blended from olive mill solid wastes and pine sawdust under different water steam/nitrogen atmospheres. Int J Hydrogen Energy 2019;44:11280–8.
[30] Sikarwar VS, Zhao M, Clough P, Yao J, Zhong X, Memon MZ, et al. An overview of advances in biomass gasification. Energy Environ Sci 2016;9:2927–3304. [31] Li CZ. Importance of volatile–char interactions during the pyrolysis and gasification
of low-rank fuels– A review. Fuel 2013;112:609–23.
[32] Lajili M, Guizani C, Escudero-Sanz FJ, Jeguirim M. Fast pyrolysis and steam gasi-fication of pellets prepared from olive oil mill residues. Energy 2018;150:61–8. [33] Hognon C, Dupont C, Grateau M, Delrue F. Comparison of steam gasification
re-activity of algal and lignocellulosic biomass: Influence of inorganic elements. Bioresour Technol 2014;164:347–53.
[34] Ollero P, Serrera A, Arjona R, Alcantarilla S. The CO2gasification kinetics of olive
residue. Biomass Bioenerg 2003;24:151–61.
[35] Van de steene V, Tagutchou JP, Escudero Sanz FJ, Salvador S. Gasificationof wood particles: Experimental and numerical study of char-H2O, char-CO2, and char-O2 reactions. Chem. Eng. Sci. 2011; 66:4499-4509.
[36] Molina A, Mondragón F. Reactivity of coal gasification with steam and CO2. Fuel 1998;77(15):1831–9.https://doi.org/10.1016/S0016-2361(98)00123-9. [37] Dsappa S, Pail PJ, Mukunda HS, Shrinivasa U. The gasification of wood-char
spheres in CO2-N2 mixtures: analysis and experiments. Chem Eng Sci 1994;49:223–32.
[38] Yao X, Yu Q, Wang K, Xie H, Qin Q. Kinetic characterisation of biomass char CO2 gasification reaction within granulated blast furnace slag. Int J Hydrogen Energy 2017;42:20520–8.
[39] Tong S, Li L, Duan L, Zaho C, Anthony EJ. A kinetic study on lignite char gasifi-cation with CO2 and H2O in afluized bed reactor. Appl Therm Eng
2019;147:602–9.
[40] Mani T, Mahinpey N, Murugan P. Reaction kinetics and mass transfer studies of biomass char gasification with CO2. Chem Eng Sci 2011;66:36–41.
[41] Hodge EM, Roberts DG, Harris DJ, Stubington JF. The significance of char mor-phology to the analysis of high-temperature char- CO2 reaction rates. Energy Fuel 2009;24:100–7.
[42] Baláṧ M, Lisý M, Štelcl O. The effect of Temperature on the Gasification Process. Acta Polytechnica 2012;52:7–11.
[43] Baláṧ M, Lisý M, Pospíšil J. Steam Biomass Gasification-Effect of Temperature. Mech Mater 2016;832:49–54.
[44] Jeguirim M, Kraiem N, Lajili M, Guizani C. The relationship between mineral contents, particle matter and bottom ash distribution during pellet combustion: molar balance and chemometric analysis. Environ Sci Pollut Res 2017;24:9927–39. [45] Li R, Zhang J, Wang G, Ning X, Wang X, Wang P. Study on CO2 gasification
re-activity of biomass char derived from high-temperature rapid pyrolysis. App Therm Eng 2017;121:1022–31.
[46] Chouchene A, Jeguirim M, Trouvé G, Favre-Reguillon A, Le Buzit G. Combined process for the treatment of olive oil mill wastewater: Adsorption on sawdust and combustion of the impregnated sawdust. Bioresour Technol 2010;101:6973–82. [47] Guizani C, Jeguirim M, Gadiou R, Escudero Sanz FJ, Salvador S. Biomass char
ga-sification by H2O, CO2 and their mixture: Evolution of chemical, textural and structural properties of the chars. Energy 2016;112:133–45.
[48] Roberts DG, Harris DJ. Char Gasification with O2, CO2, and H2O: Effects of Pressure on Intrinsic Reaction Kinetics. Energy Fuel 2000;14:483–9.
[49] Wang P, Means N, Shekhawat D. Berry D The reactivity of coal char in chemical looping gasification and combustion, World of Coal Ash (WOCA) conference. Tennessee: Nasvhille; 2015.
[50] Harris DJ, Smith IW. Intrinsic reactivity of petroleum coke and brown coal to carbon dioxide, steam and oxygen. Proc Combust Inst 1990;23:1185–90.