HAL Id: hal-01497023
https://hal.inria.fr/hal-01497023
Submitted on 28 Mar 2017
HAL is a multi-disciplinary open access
archive for the deposit and dissemination of
sci-entific research documents, whether they are
pub-lished or not. The documents may come from
teaching and research institutions in France or
abroad, or from public or private research centers.
L’archive ouverte pluridisciplinaire HAL, est
destinée au dépôt et à la diffusion de documents
scientifiques de niveau recherche, publiés ou non,
émanant des établissements d’enseignement et de
recherche français ou étrangers, des laboratoires
publics ou privés.
Distributed under a Creative Commons Attribution| 4.0 International License
Graph-Theoretic Roots of Value Network Quantification
Patrick Zwickl, Peter Reichl
To cite this version:
Patrick Zwickl, Peter Reichl. Graph-Theoretic Roots of Value Network Quantification. 19th Open
European Summer School (EUNICE), Aug 2013, Chemnitz, Germany. pp.282-286,
�10.1007/978-3-642-40552-5_26�. �hal-01497023�
Graph-Theoretic Roots of Value Network Quantification
Patrick Zwickl1, Peter Reichl2,3
1 FTW Forschungszentrum Wien, Donaucitystr. 1, 1220 Vienna, Austria 2 Télécom Bretagne, 2 Rue de la Châtaigneraie, 35510 Cesson-Sévigné, France
3 University of Vienna, Währingerstr. 29, 1090 Vienna, Austria [email protected]; [email protected]
Abstract. Value Networks (VN) are gaining increasing importance for the
analysis of highly complex business ecosystems. While most of the related work focuses on qualitative aspects, we are mainly interested in developing tools for a quantitative VN analysis. In this paper, we discuss the fundamental relationship between graph theory and VN analysis and outline some of the consequences for the specific use case of network interconnection services.
Keywords: Network Economics, Value Networks, Network Interconnection
1
Introduction
While in the telecommunications industry, tremendous network IP traffic growth rates
[1] are opposed by fading revenues1, a proper understanding of inter-firm business
relationships has become critical for Network Service Providers (NSPs), especially in the interconnection (IC) business. Tough, the traditionally prevailing sequential de-scription of production activities as value chains is not sufficient for the strategic as-sessment of such complex business ecosystems anymore. Instead, we aim at capturing the inter-firm perspective through Value Network (VN) analysis [2][3] which focuses on interactions between business entities in networks rather than sequential chains. Orthogonally, the broadly applied intra-firm concept of Business Models has emerged about a decade ago [4], and recently has been interlinked with VN concepts [5]. In this paper, we thus focus on strategic inter-firm aspects playing a key role in network-ing IC, while providnetwork-ing proper links to Business Model Design aspects known from literature. While the relatively limited amount of related work on VN analysis [2][6] strongly emphasizes a qualitative approach, we are mainly interested in tools support-ing the quantitative analysis of inter-actor value creation. More specifically, this paper outlines the fundamental relationship between graph theory and VN analysis and thus aims at a very general perspective on VN quantification.
The remainder of the paper is structured as follows: in Section 2, we briefly review recent advances in quantitative VN analysis, before we describe in Section 3 the con-cept of Value Network Graphs (VNG) and atomic operations on them. Section 4
1 Tellabs: http://www.tellabs.com/markets/tlab_end-of-profit_study.pdf, last accessed: June 26, 2013
lines resulting extensions to the basic model, before Section 5 concludes with a brief summary and outlook on future work.
2
Value Network Quantification
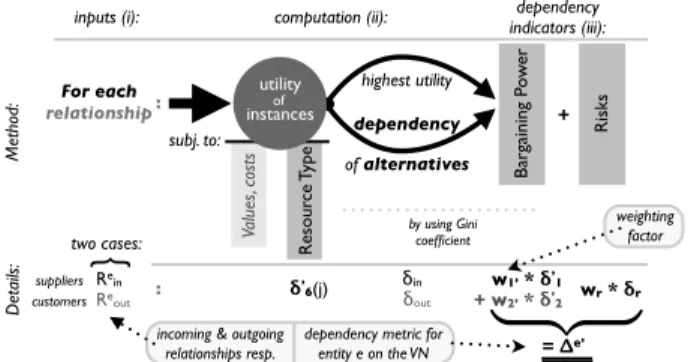
Our general approach for quantifying VN dependencies is depicted in Fig. 1, with three main building blocks: (i) competitive information as input for VN quantification, mainly based on a VN dependency model [7], (ii) the computation phase which calcu-lates actual dependencies, and (iii) the resulting dependency indicators. In contrast to [7] which is based on six relevant factors strongly inspired by Porter’s “five forces” [8] and putting them to an inter-firm context, in the present model we aim at an ag-gregation into two dependency indicators only which are synthesized from and re-vised over [9]. They are derived separately from the bargaining power of suppliers and customers and joined into a final dependency metric afterwards.
Figure 1: Framework for VN Dependency Quantification
Computation starts from the utility assessment of potential relationship alternatives, e.g. due to industry rivalry, potential market entrance or substitution. The utility is subject to the fungibility of exchanged resources, which equals the fraction of entities to which a resource could be supplied or sold. Then, the utility for the j-th best alter-native for a given relationship of an entity is calculated using exponential spreading factors, which ensures that alternatives with high utility (low j) are picked with higher probability. The revised utilities then feed a Gini-based value distribution coefficient – widely applied in economics – for each entity. In this way, we determine a depend-ency indicator relative to the maximum Gini coefficient for any outgoing/incoming (to customers/suppliers) relationship. Thus, the dependency quantification shifts to-wards fine-granular relationship instances, which together reflect an entity’s bargain-ing power of suppliers/customers [9]. Furthermore, whenever an entity strongly de-pends on a single customer/supplier, its relative dependency rises w.r.t. the VN. While the idea of dependency indicators is built on well-known concepts, it still lacks formal validation of its adequacy. Therefore, in the rest of the paper we provide first steps into this direction, leveraging on graph-theoretic foundations, defining the con-cept of VN Graphs and discussing their properties as starting point for an axiomatic derivation of basic forces which impact dependency indicators for VN quantification.
Va lu es , c ost s Ba rg ai ni ng P ow er Res our ce Type For each relationship : computation (ii): Δe’Dependency of entity e on the Value Network Outgoing Relationships Incoming Relationships Reout Rein inputs (i): subj. to: dependency indicators (iii): Met ho d: δ’6(j) Rein Reout
{
w1’ * δ’1 + w2’ * δ’2 two cases: δout δin : = Δe’ D et ails: suppliers customers highest utility dependency of alternatives utility instancesof by using Gini coefficient Ri sks + wr * δr(
weighting factordependency metric for entity e on the VN incoming & outgoing
3
Value Network Graphs
In order to be able to create and manipulate graphs representing VNs, we define a Value Network Graph (VNG) as a directed, labeled consistent graph where each node represents an entity of the VN, and each edge corresponds to a business relationship between two entities, whose properties are described by corresponding labels. The following atomic modifications of VNG are considered relevant:
• Addition and deletion of edges or nodes: this is caused by product
develop-ment and/or stakeholder substitution (→ influence on bargaining powers).
• Modification of edges or nodes: this may be caused by the exchange of
dif-ferent resources (→ fungibility), redirection e.g. due to diversification (→ substitution, influence on bargaining powers), entity size changes and mar-ket entrance/exit (→ competition, influence bargaining powers, risks).
• VNG evolution over time: this results from perspective changes, e.g. due to
temporal development of vertical integration.
Based on that, we obtain a total of eight forces causing the changes: bargaining power of suppliers, bargaining power of customers, substitution, industry rivalry, market entrance, resource type, entity size, and risks. As these factors seem to have a high influence on the graph representing a VN, we argue that they have to be considered as forces on entities (nodes) also in the inter-firm case of VNs. Nevertheless, following up on [9] we see that several forces can be merged to form the mechanism in Fig. 1. Besides that, all factors (not exclusively) arise from atomic edge or node modifica-tions. The resource type dependency (fungibility of resources) may result from modi-fying the type (e.g., to money) of the edge, as already targeted in [7][9] based on [10]. However, the size of entities has not been sufficiently targeted so far: in the context of economies of scale of Internet services, the size of companies may have considerable influence on their dependency on a VN. Furthermore, risks like e.g. customer owner-ship, large-scale substitutions, and product evolutions of other entities represent more complex special cases and may have relevant influence on the nature of the graph. Moreover, unmentioned risks like financial risks or unstable business partners may pose dis-utilities for a firm’s long-term strategic positioning, while being hardly cap-tured by graph manipulations. The following section will give an outlook on how these missing components can be added to the quantification concept of [7][9].
4
Revised Dependency Quantification
So far, our graph-theoretic analysis supports the relevance of the six factors identified in [7] as well as the need for risk and size of entity forces as additional forces. In this chapter we briefly discuss the consequences for the model in [9].
As demand-side and supply-side bargaining powers need to be independently as-sessed, two independent dependency factors are created whose weights may vary from industry to industry, depending on the role of economies of scale. The depend-ency resulting from entity sizes may best be captured by the worth/volume of re-sources exchanged with suppliers and customers, i.e., shifts in bargaining powers. Risk forces are more complex to be treated. While low profitability may lead to drop
outs or defaults and thus creates risks for business partners, comparable risks may originate from many intrafirm sources and are hardly to be controlled exogenously. Moreover, entities at larger distances to customers or (raw) materials may especially be prone to spreading risks, i.e., customer ownership is critical. However, such factors spanning multiple nodes may be difficult to be captured by graph modifications, and thus we propose to additionally resort to context-independent risk analysis methods. There exists a wide range of risk analysis concepts in literature [11], however no ap-proach dedicated to network services is available, and thus we have to adapt more generic frameworks like the Composite Risk Index (CRI) for our purpose. Our aim is to construct such an adaptation for the networking industry on the basis of feasible VN crossings with Business Model (BM) design parameters. Likewise to [5], we distinguish control parameters (VN parameters, functional architecture parameters) and value parameters (financial model parameters, value proposition parameters), which amongst others cover customer ownership in the VN parameters. From this we derive corresponding risk categories, which are eventually quantified or estimated.
5
Conclusions and Outlook
Our graph theoretic analysis has largely confirmed VN dependency indicators intro-duced by [7][9]. By a top-down reorganization originating from the bargaining pow-ers of entities and an integration of context-optimal risk assessment techniques as well as entity sizes as scaling factors, an enhanced and modular quantification system has been derived. The determination of corresponding weighting factors together with the revision of quantification details and practical applications remain for further work.
References
[1] Cisco Visual Networking Index: Forecast and Methodology, 2012–2017 (white paper), 2013.
[2] R. Gulati, N. Nohria, A. Zaheer: Strategic Networks. Strat. Mgmt. J., 21, 203-215, 2000. [3] J. Peppard, A. Rylander: From Value Chain to Value Network: Insight for Mobile
Opera-tors. European Management Journal, 24 (2-3), 128–141, 2006.
[4] D. Teece: Business Models, Business Strategy and Innovation. Long Range Planning, 43 (2-3), 172-194, 2010.
[5] P. Ballon: Business models revisited: the configuration of control and value. Info, 9 (5), 6-19, 2007.
[6] V. Allee: Reconfiguring the value network. J. Busin. Strat., 21 (4), 36-39, 2000.
[7] P. Zwickl, P. Reichl, A. Ghezzi: On the Quantification of Value Networks: A Dependency Model for Interconnection Scenarios. Proc. ICQT’11, 63-74, LNCS 6995, 2011.
[8] M. Porter: How Competitive Forces Shape Strategy. Harvard Bus. Rev., 102, 1979. [9] P. Zwickl, P. Reichl: An Instance-based Approach for the Quantitative Assessment of Key
Value Network Dependencies. Proc. Networking 2012 Workshops, 97-102, 2012. [10] A. Biem, N. Caswell: A Value Network Model for Strategic Analysis. Proc. HICSS-41,
361-367, 2008.
[11] D. White: Application of system thinking to risk management: a review of the literature. Management Decision, 3 (10), 35-45, 1995.