HAL Id: hal-01183805
https://hal.archives-ouvertes.fr/hal-01183805
Submitted on 11 Aug 2015HAL is a multi-disciplinary open access
archive for the deposit and dissemination of sci-entific research documents, whether they are pub-lished or not. The documents may come from teaching and research institutions in France or abroad, or from public or private research centers.
L’archive ouverte pluridisciplinaire HAL, est destinée au dépôt et à la diffusion de documents scientifiques de niveau recherche, publiés ou non, émanant des établissements d’enseignement et de recherche français ou étrangers, des laboratoires publics ou privés.
Required Density of Multicast Capable Optical Cross
Connects to Assure Efficient Multicasting
Shadi Jawhar, Bernard Cousin, Samer Lahoud
To cite this version:
Shadi Jawhar, Bernard Cousin, Samer Lahoud. Required Density of Multicast Capable Optical Cross Connects to Assure Efficient Multicasting. First International Conference on Networking and Future Internet (ICNFI 2011), Apr 2011, paris, France. �hal-01183805�
Required Density of Multicast Capable Optical Cross
Connects to Assure Efficient Multicasting
Shadi Jawhar, Bernard Cousin, Samer Lahoud
IRISA laboratory, University of Rennes 1, Campus universitaire de Beaulieu, 35042, France [email protected]
Many algorithms are developed to deploy multicast in optical networks. Those algorithms are designed to resolve the main issue of multicasting in optical networks, which is not all optical cross-connect in the network are capable to split an incoming light signal to more than one output interface. Some of those algorithms are based on additional signaling exchanged to generate the appropriate multicast trees, some use rerouting to source, and some generate multiple multicast trees for the same multicast group. The performance of those algorithms depends basically on the number and location of multicast capable cross-connects. A multicast capable cross-connect (MCOXC) is an optical node equipped with light splitter that allows splitting an incoming light signal to any two or more output interfaces. This paper studies how many nodes in optical networks must be equipped with light splitters to assure good performance of multicast algorithms in sparse splitting networks. This depends basically on the topology in terms of number of nodes, the average node degree and the variation of the node degree distribution over the network nodes. The more the variation of the node degree is, the more splitters are required.
I. INTRODUCTION
Consider an optical network where optical nodes are connected by fibers links. If all nodes possess light splitting capability, then multicasting can be deployed easily in this high speed network. However, light splitters are expensive devices; thus it will be very expensive to implement splitters on all optical switches. Nevertheless, to generate multicast trees that efficiently assure data delivery to multicast group members, a minimum number of optical nodes must be equipped with light splitters. Many different network parameters affect the number of optical cross-connects (OXC) that require to be multicast capable. The network topology in terms of number of nodes, number of links, node degree, and link capacity is the main parameter that may affect the number of splitters required.
II. OPTIMAL PERCENTAGE OF MCOXC REQUIRED
Many parameters have been selected to indicate which nodes on the network are optimal to be MCOXC. The node degree which is the count of links attached on a node makes a good indicator on how many neighbors the node has. The higher the node
degree is, the more likely the node in a multicast session is participating as a branching. Another parameter is the links weights. Link weights can be assigned in the network design phase based on provisioned multicast traffic (and thus the link weights reflect the physical characteristics i.e. utilization rate or bandwidth- of the links). In this paper, without lack of generality, we will assume that all links are identical. Implicitly, that means the multicast sessions are evenly distributed over all the network nodes, and the network topology has been well designed.
To know how many MCOXC are required, a study of the network topology itself is required. To demonstrate this, we consider two different topologies New Jersey LATA network and NSFNET.
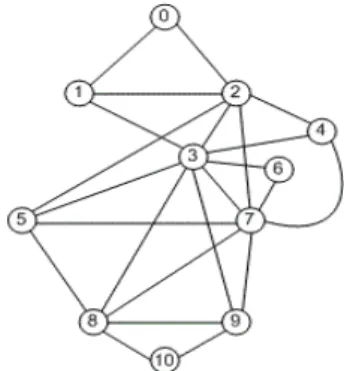
Figure 1 New Jersey LATA Network
Figure 2 NSF NET Network
The following tables show the node degree population for each network. Table 1 : New Jersey LATA Node Degrees Node Node degree 3 8 7 7 2 6 8 5 5,9 4 1,4 3 0,6,10 2 Mean: 4.18 Standard Deviation 2.08
Table 2 : NSF NET Node Degrees Node Node degree 5,9 4 1,3,4,8,12,13 3 0,2,6,7,10,11 2 Mean: 2.71 Standard Deviation 0.73
In the first, nodes 3, 2, and 7 are the ones with the highest degrees, thus could be MCOXCs. But also, nodes 5 and 9 may in some cases require splitting. The node degree distributions in the two networks are different. In the first, nodes 3,7,2,8 have a node degree higher than the mean, showing that those nodes are more likely to be MCOXC. In the second network, the diversity is less, thus it possible for a larger percentage of nodes to be MCOXC. Any of nodes 5,9,1,3,4,8,12,13 may be a good place for a splitter. This seems to indicate that the percentage of MCOXC in the second network must be higher because diversity is less.
III. SIMULATIONS AND RESULTS
a. Simulating different network topologies
We consider several optical networks with different sizes, node degree means and node degree standard deviations. As shown in the next table, we consider 4 different network topologies, with different number of nodes, different node degree mean and different node degree standard deviation.
Table 3: Different Network Topologies Network Number of nodes Degree Mean Degree Standard Deviation New Jersey 11 4.18 2.08 NSF NET 14 14 2.71 0.73 EON 19 4.00 1.77 US backbone 24 3.58 1.02
The first network which is, New Jersey LATA network, is composed of 11 nodes interconnected by 23 links. The node degree mean is 4.18. The standard deviation of this network is 2.04, which means that the node degree values are spread apart.
The second simulated network is NSFNET network. This network is composed of 14 nodes interconnected by 19 links. As a result, the node degree mean is 2.71. The standard deviation of this network is 0.73, which means that the node degree values are
very close to each others. Nodes 0, 2, 6, 7, 10, 11 have degree 2, and nodes 3, 4, 8, 12, and 13 have degree 3.
The third network is the European optical network which consists of 19 nodes with 38 links. The mean is 4 and the standard deviation is 1.77. Finally, the last network is the US IP backbone network which consists of 24 nodes with 43 links. The mean is 3.58 and the standard deviation is 1.02.
In order to know how many multicast capable nodes are enough to assure efficient multicasting, we simulated different multicast sessions. We generated a large number of multicast groups. The next table shows the average cost in terms of number of links used in the multicast trees generated when all nodes in the network are MCOXC versus when all nodes in the network are not multicast capable.
Table 4: Average cost when no multicast capable nodes are available
Network No MCOXC nodes All nodes are
MCOXC Difference
New Jersey 7.77 6.02 23%
NSF NET 11.17 8.80 21%
EON 15.50 11.23 28%
US backbone 21.02 15.57 26%
We start to add splitters in the network and we measure the effect of their presence in the network on the cost of the generated trees. We measured this in terms of percentage of nodes being MCOXC.
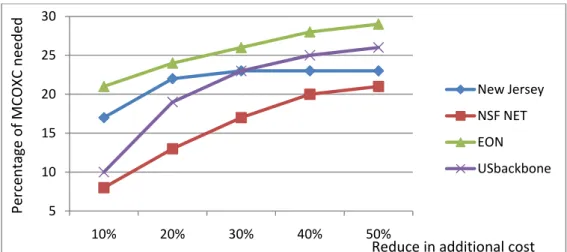
Table 5: Effect of MCOXC density on the cost over all generated trees MCOXC % 10% 20% 30% 40% 50% 100% New Jersey 17 22 23 23 23 23 NSF NET 8 13 17 20 21 21 EON 21 24 26 28 28 28 US backbone 10 19 23 25 26 26
Table 5 shows that if 10% of the network nodes are MCOXC in the New Jersey network, then an enhancement of 17% is achieved. If 20% of the network nodes are MCOXC then it perform as if all nodes are MCOXC. This is because this network variance is the highest, and there are few nodes of the network which have high degree compared to the rest.
On the other hand, if 10% of the NSFNET network nodes are multicast capable, then only an 8% enhancement is achieved. And a 20% density of MXOXC result in an enhancement in the performance equal to almost half the enhancement given when all network nodes are MCOXC. This is because its network node degree variance is low, and most of the nodes have relatively close network degree.
Table 6: Percentage of MCOXC to assure good performing of the generated multicast trees. SD 75% Cost Reduce 85% Cost Reduce 95% Cost Reduce NSF NET 0.73 28% 34% 42% US backbone 1.02 21% 26% 36% EON 1.77 10% 21% 33% New Jersey 2.08 9% 14% 19%
Table 6 shows the percentage of nodes that must be MCOXC to reduce the additional rerouting cost added because of the light splitters constraints by a 75%, 85% and 95%. This indicates how many MCOXC are required to assure good performing of the generated multicast trees in each network. The next figures show that the percentage of MCOXC required to reduce the additional cost due to multicast incapability constraint depends on standard deviation of the node degree.
Figure 3 Effect of additional splitters Figure 4 Required percentage of MCOXC versus the standard deviation of the node degree 5 10 15 20 25 30 10% 20% 30% 40% 50% New Jersey NSF NET EON USbackbone Reduce in additional cost Percentage o f MCOXC ne ed ed 0% 5% 10% 15% 20% 25% 30% 35% 40% 45% 0,5 1 1,5 2 75% reduce 85% reduce 95% reduce Standard Deviation of Node Degree Pe rc en ta ge of MCOXC
IV. CONCLUSION
In this paper, we study an important factor in optical network design which is the number of light splitters required to assure efficient multicast in all-optical networks. We study the relation between the required percentage of MCOXC that must be placed in the network and the network topology structure. We analyze the effect of the network size in terms of number of nodes and number of links, and we realize that those two factors do not give good indication of how many MCOXC are required. In contrast, the way the links are distributed between the nodes in the network is the main factor on how many splitters are required. We measure this, using the standard deviation of the node degree distribution over the network nodes. We use in our performance evaluation several well-known real optical networks. We then assume one network topology and design minor modification to simulate different scenarios. Numerical examples on a variety of network topologies and different traffic patterns demonstrate that the percentage of MCOXC must be between 10% and 40% to assure efficient multicasting.
Also this percentage is depends on the standard deviation of the node degree distribution. Simulations show that when the node degree distribution has large standard deviation, then 15% of MCOXC will result in 95% performance efficiency. In contrast, when the node degree population is very close to the mean (I.e. the standard deviation is low), then 40% of MCOXC may be required to assure the same efficiency.