Aspects of Applied Biology 132, 2016 International Advances in Pesticide Application
Reduced span spray – Part 1: Retention
By M MASSINON1, N DE COCK1, S OULED TALEB SALAH1,2 and F LEBEAU1 1Biosystems Engineering, Gembloux Agro-Bio Tech (GxABT) - University of Liege (ULg),
Gembloux, Belgium
2AgricultureIsLife, Gembloux Agro-Bio Tech (GxABT) - University of Liege (ULg), Gembloux, Belgium
Corresponding Author Email: [email protected]
Summary
Maximising treatment efficiency for a given target lies mainly on depositing a maximum part of the spray volume within an optimal droplet size range, which has to be as narrow as possible to reduce retention variability and drift issues. The present work focuses on exploring the effect of span factor of the droplet size distribution on the final retention by a 3D target plant using a modelling approach with the final aim of guiding the development of a reduced span nozzle (Reduced span spray – Part 3: Design of narrow span nozzle). Five droplet size spans have been tested for three VMD and three wetting scenarios on the same 3D plant architecture. Performing a screening of the different parameters involved in spray retention with a modelling approach based on a deeper understanding of leaf/droplet interactions is a valuable approach for highlighting the optimal droplet size distribution maximising droplet retention for a given target/formulation combination.
Key words: Spray retention, spray impact, droplet-leaf interactions, virtual spraying model,
plant architecture, span factor
Introduction
Plant protection products are accredited with buffer zones. To reduce the size of these buffer zones in ground applications, farmers may use drift reduction technologies (DRT) such as shielded sprayers, air assistance sprayers, but also by acting on the droplet size distribution by changing the nozzle type and the operating pressure. Increasing the mean droplet size will reduce the risk of drift because smaller droplets are prone to drift. Reducing the percentage of spray volume in smaller droplet sizes is also possible by reducing the span factor of the droplet distribution. However, smaller droplets are better for adhesion on leaf surfaces because their impact energy is reduced. Finding an optimal droplet size distribution reducing drift while maximising the spray retention remains a difficult task because of the numerous factors that are involved (Knoch, 1994; Massinon & Lebeau, 2013). For instance, when using air-induction nozzles for early grow stage weed control, poor treatment efficacies may result from high variabilities of deposits (Butler Ellis et al., 2007), this variability being influenced by the application volume and the method of application. The variability of deposits on the target will increase both by reducing applied volumes and by applying larger droplets. The plant properties also influence the retention efficiency: early grow stage weeds with (super) hydrophobic, small and slanted leaves increase the variability of a treatment (Massinon et al., 2015).
A simulation approach could be highly valuable in this context in order to discriminate between all the possible application method combinations prior to field trials. A lot of work has already been performed in order to understand the complex interactions between spray droplets and leaf surfaces. (Forster et al., 2005) proposed a universal spray adhesion model able to explain 72% of the deviance between observed and predicted adhesion values. (Dorr et al., 2015) used process-driven models including experimental correlations between droplet impact behaviours and mixture physicochemical parameters. Another possible approach consists to study experimentally agricultural spray impaction on target surface and to derive droplet impact probabilities from image analysis and integrate them in a virtual spraying model (Massinon et al., 2015).
This study aims at highlighting the effect of the use of a reduced span on the spraying efficacy in ground applications with hydraulic nozzles. It focuses on the spray retention by a virtual plant with a numerical approach comprising a versatile virtual spraying model that can be used for theoretically predict the mean levels as well as the variability of spray deposits at the plant scale.
Materials and Methods
Model overview
The virtual spraying model was developed in Matlab (R2012a) on a standard personal computer. This is a stochastic model with three mains experimental inputs: the droplet size distribution, the plant architecture and the spray droplet impact behaviours. The model described in (Massinon et al., 2015) is summarised hereafter.
Virtual spraying model
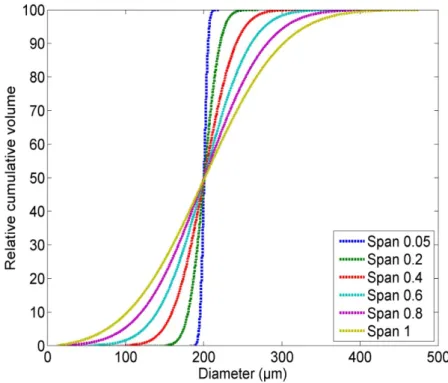
Eighteen droplet size distributions with volumetric mean diameters (VMD) of 200, 250 and 300 µm and span factors of 0.05, 0.2, 0.4, 0.6, 0.8 and 1 were drawn from normal distributions N(µ,σ), where the mean µ corresponded to the VMD and σ was adapted in order to obtain the desired span factor. Droplets were drawn until reaching the volume of 50L ha-1 on a ground surface area of one square metre. Fig. 1 shows, for example, six droplet size distributions of VMD=200µm for different span factors. The range of VMDs tested in this study has been chosen to prevent drift (smaller droplets) while preserving an expected good retention.
Then, droplets were uniformly distributed within the ground surface area of 1 square metre using uniformly distributed random numbers: U(0,1000) in mm. Then, the sprayed area was divided into a grid of squares of identical size. Each grid cell gathered therefore different droplet size distributions resulting in various applied volumes representative of the field variability. Droplet velocity for each diameter was randomly drawn from normally distributed pseudo random numbers N(µ,σ), where the mean µ was computed from droplet transport and evaporation equations (Guella et al., 2008) with still air hypothesis at 21°C and 55% RH, water droplets at 20°C with 16 m-1 of initial velocity and the standard deviation σ was chosen at 0.1 m-1. Droplet trajectories were assimilated as straight lines with random directions, representative of the actual moving nozzle spray.
3D plant architecture
A DAVID Structured Light Scanner SLS-2 (DAVID Vision Systems GmbH, Koblenz, Germany) was used to reconstruct barley plants in 3D. It is composed of an industrial USB CMOS monochrome camera (1280 × 960 pixels, 25 FPS) with a focusable lens (12mm) and a HD video projector providing the structured light patterns. This 3D system allows a scan size of 60–500 mm with accuracy up to 0.1% of the object size, down to 0.06 mm. The calibration was performed using the DAVID calibration panels set. A barley at two leaf growth stage provided was placed on a rotating table and scanned at 30° steps over 360°. The scans were merged afterwards using the DAVID-Laserscanner Pro Edition 3 software and exported in STL format. The virtual plant surface was therefore composed of a triangle mesh.
Droplet interception by the plant model and spray impact behaviour
The droplet impact on the 3D plant involved to test whether a droplet direction intersects or not each triangle of the 3D plant mesh. The implemented method is detailed by Möller & Trumbore (1997). To reduce the computational cost of the spray interception algorithm, the number of triangles of the 3D plant was reduced by 90% using the quadratic edge collapse decimation filter (Garland & Heckbert, 1997) implemented in MeshLab (free and open-source 3D mesh processing software).
If a droplet intersected the leaf surface, the impact behaviour was included to determine the contribution of each droplet on the retention by the 3D plant model. The spray impact behaviour was assessed with high-speed imaging according to the method described in Massinon and Lebeau (2012) and impact behaviour probabilities (Massinon et al., 2014), fitted with logistic regression, were implemented in the algorithm depending on the droplet incidence angle.
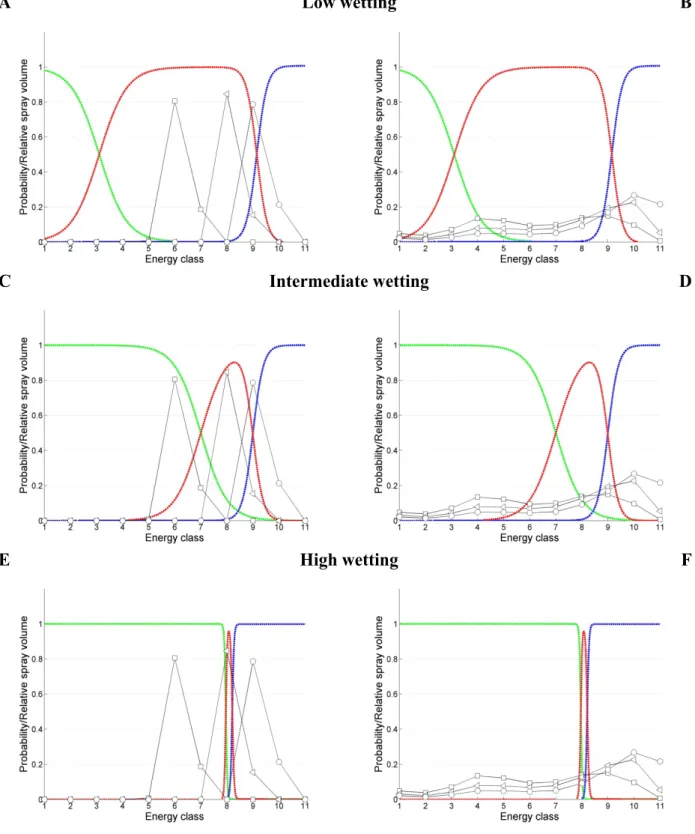
Three possible wetting scenarios were tested by the model for various spray characteristics detailed previously on a difficult-to-wet surface (Fig. 2): low (Fig. 2A,B), intermediate (Fig. 2C,D) and high wettability (Fig. 2E,F). Fig. 2 is given as an example of impact probability maps used in the algorithm (surface tilted at 45°) for three impact outcomes that may occur in foliar spray applications: adhesion, rebound and splashing. These impact probabilities are plotted as a function of 11 energy classes whose upper class boundaries are computed with the dimensionless droplet Weber number, from 0.02–394 with an 3 times increment. The Weber numbers are computed according to:
We = ρV 2D/σ,
where ρ liquid density, V is the droplet velocity, D is the droplet diameter and is the water surface tension. In the algorithm, the impact behaviour is given to each droplet based on probability maps such as Fig. 2 using the actual incidence angle. However the impact probabilities remained constant for the intermediate wetting scenario depending on the incidence angle. Fig. 2 also shows the relative spray volume within each energy class for two extreme spans: span of 0.05 (Fig 2A,C,E) and span of 1 (Fig 2B,D,F). Fig 2 summarises spray droplet behaviour at impact, therefore an estimated final retention by the target surface can be quickly obtained in relation with the spray characteristics.
Fig. 2. Spray droplet impact probabilities depending on the impact energy (water Weber number) for an artificial superhydrophobic surface: … adhesion, …rebound, … splashing, relative volume of the spray within energy classes: —□— VMD = 200µm, — ∆— VMD = 250µm, —○—VMD = 300µm , (A-C-E): span factor = 0.05, (B,D,F): span factor = 1. (A,B): low wettability scenario, (C,D): intermediate wettability scenario and (E,F): high wettability scenario.
Results
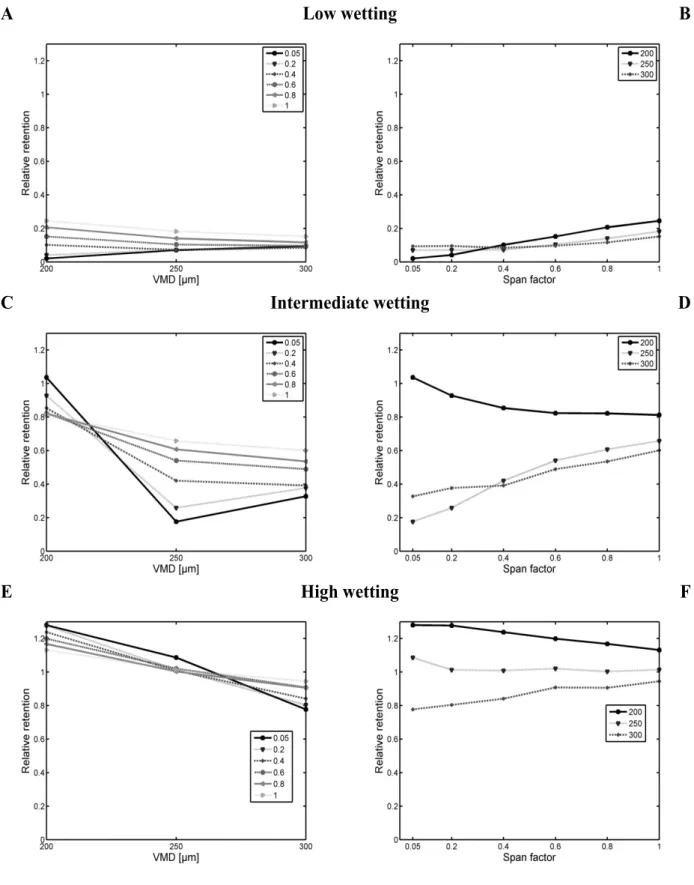
The relevance of using a reduced span factor spray in relation with the mean droplet size is given in Fig. 3 and 4 for various wetting scenarios. Fig. 3 presents the relative retention, defined as the
A Low wetting B
C Intermediate wetting D
Fig. 3. Relative mean retention for various VMD (A,C,E), span factors (B,D,F) and formulation scenarios: (A,B) low wettability, (C,D) intermediate wettability and (E,F) high wettability. Each point represents 100 virtual sprayings on the same plant architecture.
actual retention by the target (µL cm-² of projected plant surface area on the ground) divided by the nominal applied volume for 18 VMD/span combinations and 3 formulation scenarios (Fig. 2).
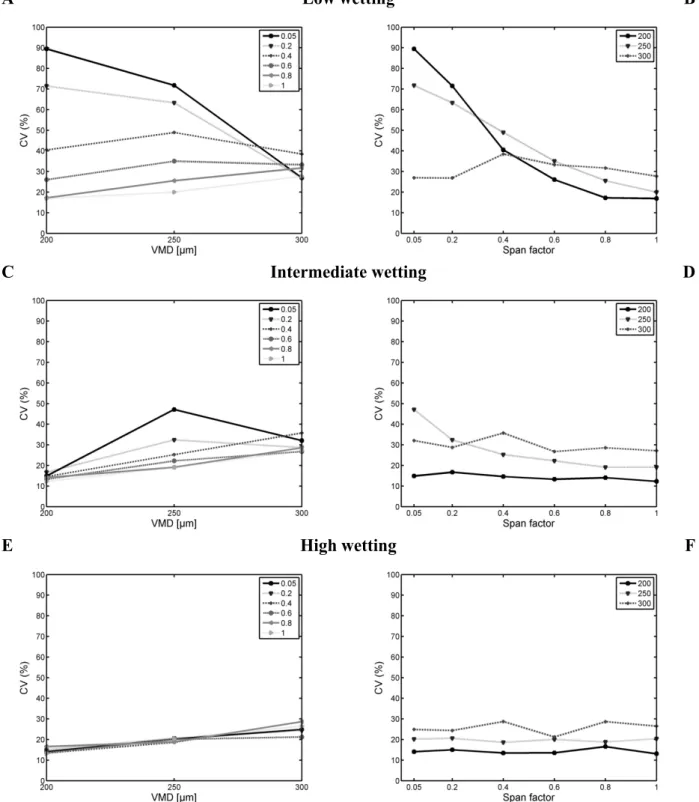
Fig. 4 shows the coefficient of variation of spray retention resulting from the simulations which can be used as an indicator of the variability of deposits (Butler Ellis et al., 2007). Table 1 presents the mean number of intercepted droplets per unit of projected leaf surface area (1.43 cm²).
A Low wetting B
C Intermediate wetting D
Fig. 4. Coefficients of variation for various VMD (A,C,E), span factors (B,D,F) and formulation scenarios: (A,B) low wettability, (C,D) intermediate wettability and (E,F) high wettability. Each point represents 100 virtual sprayings on the same plant architecture.
Table 1. Average number of intercepted droplets per projected leaf surface area [N cm-²] for an application at 50 L ha-1 VMD [µm] 0.05 0.2 0.4Span factor0.6 0.8 1 200 152 159 181 268 901 2440 250 78 81 92 150 621 1817 300 45 47 53 88 419 1387 A Low wetting B C Intermediate wetting D E High wetting F
Discussion
Mean deposits levels increased with increasing spray mixture wettability scenario (Fig. 3) as expected. For the ‘low wetting scenario’ (Fig. 3A,B), a slight influence of the VMD is highlighted on the relative retention. Retention increased with increasing span factor because droplets covered more energy classes contributing the spray mixture adhesion (Fig. 2A,B). Moreover, it can be noted than the coefficient of variation decreased with increasing span factor (Fig. 4B), especially for VMDs of 200 and 250 µm. A low retention with high variability denotes very poor expected treatment efficacies. For the ‘high wetting scenario’ (Fig. 3E,F), the mean level of deposits decreased as the VMD increased because the number of droplets lying in the rebound outcome increased. It should be noted that the relative retention can be greater than unity: this is due to the plant architecture since droplets can be intercepted by the lower part of the 3D plant. The retention also decreased as the span factor increased; except for a VMD of 300 µm because these spray distribution is centred within the rebound’s range of existence. Variability of deposits seems rather constant for this scenario. For an ‘intermediate wetting scenario’ (Fig. 3C,D), the VMD of 200 µm clearly stands out: an increase of VMD will shift droplets towards higher energy classes where the probability of rebound and splashing is greater (Fig. 2C). Higher spans will lead to an increase of the probability of other impact outcomes. In terms of variability of deposits, CV increased with increasing VMD and seems rather constant as a function of the span factor, excepted for the VMD of 250 µm (Fig. 4D) which seems to decrease with increasing span factor because more droplets contribute gradually to adhesion. Using reduced span spray with a poorly chosen VMD may result in very low retention efficiencies, such as Fig. 3C with VMD of 250 µm.
A virtual spraying model has been used for highlighting the effect of the spray characteristics, i.e. VMD and span factor, on the spray retention at the plant scale. The model was based on droplet impact probabilities determined on an artificial superhydrophobic surface representative of very difficult-to-wet leaf surfaces. Results from this study have shown that the importance of knowing the spray droplet behaviours at impact on a given target in order to determine the optimal spray characteristics maximising spray retention.
References
Butler Ellis M C, Knight S, Miller P C H. 2007. Spray behaviour and Efficacy of Herbicides and
Fungicides Applied to Wheat at Reduced Volumes. AHDB Project Report (408). London: AHDB. 52 pp.
Dorr G, Wang S, Mayo L, McCue S, Forster W A, Hanan J, He X. 2015. Impaction of spray
droplets on leaves: influence of formulation and leaf character on shatter, bounce and adhesion. Experiments in Fluids 56:1–17.
Forster W A, Kimberley M O, Zabkiewicz J A. 2005. A universal spray droplet adhesion model.
Transactions of the ASAE 48:1321–1330.
Garland M, Heckbert P S. 1997. Surface simplification using quadric error metrics. In Proceedings
of the 24th Annual Conference on Computer Graphics and Interactive Techniques.
Guella S, Alexandrova S, Saboni A. 2008. Evaporation d’une gouttelette en chute libre dans l’air.
International Journal of Thermal Sciences 47:886–898.
Knoche M. 1994. Effect of droplet size and carrier volume on performance of foliage-applied
herbicides. Crop Protection 13:163–178.
Massinon M, Lebeau F. 2012. Experimental method for the assessment of agricultural spray
retention based on high-speed imaging of drop impact on a synthetic superhydrophobic surface. Biosystems Engineering 112:56–64.
Massinon M, Lebeau F. 2013. Review of physicochemical processes involved in agrochemical
Massinon M, Boukhalfa H, Lebeau F. 2014. The effect of surface orientation on spray retention.
Precision Agriculture 15:241–254.
Massinon M, Dumont B, De Cock N, Ouled Taleb Salah S, Lebeau F. 2015. Study of retention
variability on an early growth stage herbaceous plant using a 3D virtual spraying model. Crop Protection 78:63–71.
Miller P C H, Butler Ellis M C, Bateman R, Lane A G, O’Sullivan C M O, Tuck C R, Robinson T H. 2010. Deposit distributions on targets with different geometries and treated with a range
of spray characteristics. Aspects of Applied Biololgy 99, International Advances in Pesticide Application, pp. 241–248.
Möller T, Trumbore B. 1997. Fast, minimum storage ray-triangle intersection. Journal of Graphical