Any correspondence concerning this service should be sent
to the repository administrator:
tech-oatao@listes-diff.inp-toulouse.fr
This is an author’s version published in:
http://oatao.univ-toulouse.fr/19090
Official URL:
https://dl.acm.org/citation.cfm?doid=3121050.3121091
DOI :
http://doi.org/10.1145/3121050.3121091
Open Archive Toulouse Archive Ouverte
OATAO is an open access repository that collects the work of Toulouse
researchers and makes it freely available over the web where possible
To cite this version:
Fraisier, Ophélie and Cabanac, Guillaume and Pitarch,
Yoann and Besancon, Romaric and Boughanem, Mohand Uncovering
Like-minded Political Communities on Twitter. (2017) In: ACM SIGIR
International Conference on Theory of Information Retrieval (ICTIR 2017), 1
October 2017 - 4 October 2017 (Amsterdam, Netherlands).
Uncovering Like-minded Political Communities on Twitter
Ophélie Fraisier
CEA, CEA-Tech Occitanie IRIT, Université de Toulouse, CNRS
F-31062, Toulouse, France ophelie.fraisier@cea.fr
Guillaume Cabanac
IRIT, Université de Toulouse, CNRSF-31062, Toulouse, France guillaume.cabanac@irit.fr
Yoann Pitarch
IRIT, Université de Toulouse, CNRS F-31062, Toulouse, France yoann.pitarch@irit.fr
Romaric Besançon
CEA, LIST F-91191, Gif-sur-Yvette, France romaric.besancon@cea.frMohand Boughanem
IRIT, Université de Toulouse, CNRSF-31062, Toulouse, France mohand.boughanem@irit.fr
ABSTRACT
Stance detection systems often integrate social clues in their algo-rithms. While the influence of social groups on stance is known, there is no evaluation of how well state-of-the-art community de-tection algorithms perform in terms of detecting like-minded com-munities, i.e. communities that share the same stance on a given subject. We used Twitter’s social interactions to compare the results of community detection algorithms on datasets on the Scottish Inde-pendence Referendum and US Midterm Elections. Our results show that algorithms relying on information diffusion perform better for this task and confirm previous observations about retweets being better vectors of stance than mentions.
CCS CONCEPTS
• Applied computing → Sociology; • Information systems → Web mining;
KEYWORDS
Stance detection, Social media, Benchmarking
1
INTRODUCTION
The impact of communities and homophily1on the construction of people’s opinions have been studied by sociologists for decades. Bourdieu [3] noted that choosing between opinions usually meant choosing between groups supporting underlying opinions. Sub-sequent studies showed that these observations still held true on virtual social media, where users tended to interact with people sharing their opinions rather than debating with opponents, a phe-nomenon known as “echo chambers” [11, 13].
1Homophily is the principle that a contact between similar people occurs at a higher
rate than among dissimilar people.
This project is co-financed by the European Union – Europe is committed to Midi-Pyrénées with the European fund for regional development.
DOI: http://dx.doi.org/10.1145/3121050.3121091
With the rapid growth of user-generated content, many re-searchers decided to built opinion mining systems, to automatically detect the subjective information users shared in their writings on the web [12]. These systems led to stance detection, which can be used in online social media to automatically determine the stance of specific users in favor or against a particular topic. Successful detec-tion of stance can be very useful in various downstream tasks, such as information retrieval, text summarization or irony detection.
But an important question remains unanswered: can social inter-actions and communities alone be used to determine users’ stances? We decided to use the phenomenon of echo chambers and commu-nity detection to try to answer this question. This paper makes the following contributions: (a) a comparison of state-of-the-art community detection algorithms, testing their ability to uncover un-derlying groups who share a common stance and (b) a comparison between the potential of retweet, mention, and their combination graphs, as a means to uncover like-minded communities.
2
RELATED WORK
The relationship between opinions and social relations has been exploited in opinion mining for many years, with researchers try-ing to deepen their analysis by ustry-ing social theories [20]. Some researchers, while not formally using community detection, inte-grated some aspects of it to improve their opinion classification systems. Speriosu et al. [19] used for example label propagation along the follower graph to assign polarity labels to tweets. On the other hand, opinion was sometimes used as a feature to detect like-minded community in conjonction with classical algorithms. Dinsoreanu and Potolea [9] exploited opinions extracted from doc-uments and the infomap community detection algorithm to detect consistent communities of users.
Several benchmarks compared performances on ground-truth communities and some systems are explicitely made for detect-ing like-minded communities — like Deepak et al. [8] who used a bottom-up hierarchical clustering approach — but we did not find a benchmark focusing on how classical algorithms performed when detecting like-minded communities.
3
EXPERIMENTAL SETUP
3.1
Definitions
In this paper, we define a community as a group of users interacting for enough time and with enough commitment for connections to appear in the cyberspace [17].
The stance of a user is its publicly stated viewpoint on a particular subject. In our experiments, we focused on datasets with political viewpoints. Each dataset contains N stances, with N ≥ 2. A stance may be shared by users belonging to different communities, and a community may contain several stances. Our aim is to detect if some algorithms obtain better performances in finding communities as homogeneous as possible in terms of stances, that is communities where a large majority of users share the same stance. We will call them like-minded communities.
3.2
Algorithms
We chose to compare in this study some popular and easily-accessible graph-based community detection algorithms2, implemented in the igraph library [6]. Table 1 lists some characteristics of the algo-rithms presented below.
Table 1: Characteristics of community detection algorithms, including complexity on typical sparse data – W stands for edges weights and D for edges direction.
Family Algorithm W D Complexity Modularity
maximisation
Fast-greedy[22] ✓ ✗ O(mn log n) Leading eigenvectors[14] ✗ ✗ O(n2)
Multi-level[1] ✓ ✗ O(n) Information Infomap[18] ✓ ✓ O(n (n + m)) diffusion Label propagation[16] ✓ ✗ O(n + m) Random walk Walktrap[15] ✓ ✗ O(n2log n)
Modularity maximisation. The modularity measures the number of intra-community links versus links joining communities. Fast-greedyattempts to maximize modularity of the community struc-ture by merging pairs of communities with a bottom-up approach. Leading eigenvectorsuses a matrix-based approach analogous to a spectral partitioning method. Multi-level iteratively merges partitions representing local maxima of modularity at different scales.
Information diffusion. Infomap attempts to create communities according to the flow of information present in the network. Label propagationis a simple iterative process where, at each step, each node adopts the label most present in its neighbors.
Random walk. Walktrap detects communities based on a dis-tance that quantify the structural similarity between vertices using random walks.
3.3
Interactions
In this work we consider only the two main tweet-level interac-tions3: retweets (RT) and mentions (@). Retweeting means sharing another user’s tweet with one’s followers while mentioning is cit-ing another user’s username. Three graphs are built per dataset: one per interaction plus one taking into account both interactions indifferently. In these graphs, vertices are users and edges are in-teractions. The weight of the edges are the number of times the
2We used non-parametric algorithms with respect to the number of communities to
detect since, as expressed in Section 3.1, the ideal situation for us is not having one unique community per stance, but simply having homogeneous communities.
3We did not consider the Follow interaction because it is a user-level interaction, so
hardly comparable with retweets and mentions, and it shows a more passive way of participating on Twitter.
users interacted. A vertex can represent an annotated or a non-annotated user: non-annotated users are those for which we know the stance, whereas non-annotated users appear in annotated users’ tweets because of mentions or retweets, but we do not know their stance. When a directed graph is required by the algorithm, we follow the information path: from retweeted users to users sharing tweets, and from mentioning users to users being cited.
3.4
Scoring functions
To compare the performance of algorithms on like-minded commu-nities we used the purity [10] and the normalized mutual informa-tion [7], defined as follows:
Purity(Ω,C) = P kmaxj |ωk∩cj| N NMI(Ω,C) = 2×I (Ω,C) H(Ω)+H (C)
with Ω the partition of detected communities, C the set of stances, ωkthe set of annotated users in community k, cjthe set of annotated users in class j, N the total number of annotated users in P, I the mutual information, and H the entropy.
Purity is known to be biased in favor of small communities but in our case, since we want communities as homogeneous as possible, it is still a valid indicator. To examine the consistency of the community detection, we also used the standard deviation (SD) of the intra-communities purity scores.
4
EXPERIMENTS
4.1
Datasets
The use of community detection algorithms as a mean to detect like-minded communities forces us to have a non-negligible amount of interactions between the users. For this reason we cannot use datasets built around keywords, like the ones featured in the task 6 of SemEval20164because users in this kind of datasets seldom inter-act with one another. We used two datasets published by Brigadir et al. [4], both constructed by gathering all available tweets for a fixed subset of users (see Table 2). DMI-TCAT [2] collected the tweets from Twitter API, based on the released users accounts and tweets ids.
Scottish Independence Referendum (SR). This dataset was origi-nally collected from Aug 11th to Oct 19th 2014. It reflects the debate around the Scottish Independence referendum of the 18th of Sep-tember 2014. The official “Yes” and “No” campaigns were very active on social media. To be included as a “Yes” or “No” supporter, users had to be part of the Scottish Independence Referendum Electoral Commission or unambiguously self-identify as such on their profile.
Table 2: Dataset sizes5
Dataset Stance Original Retrieved Users Tweets Users Tweets SR YesNo 618610 799,096570,024 535508 344,563263,569
ME DemocratRepublican 942997 89,29680,840 701756 56,67156,506
4http://alt.qcri.org/semeval2016/task6/
5The differences between the original sizes and the retrieved ones are due to users
US Midterm Elections (ME). This dataset concerns the US Midterm elections held on the 4th of November 2014 and was originally col-lected from Oct 10th to Nov 20th 2014. Third parties were ignored so users are either “Democrat” or “Republican”. They were selected thanks to several sources listing official Twitter accounts of cam-paigners in these elections.
4.2
Scores on all users
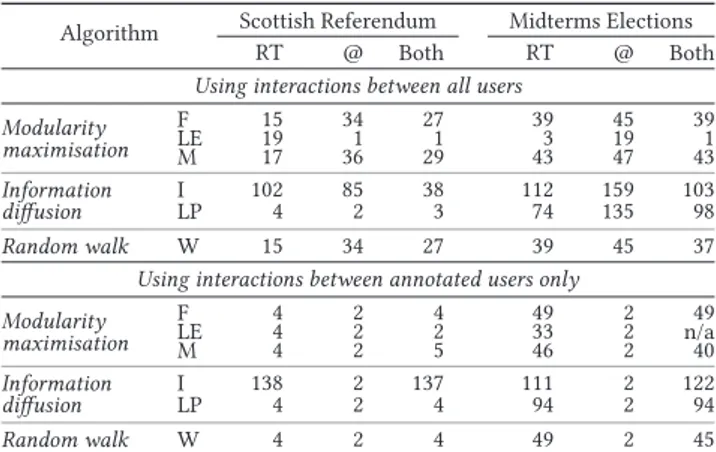
Table 3 presents some characteristics of the resulting graphs. Given the construction method for the graphs, we do not have annotated users in all communities. In order to measure consistent scores, we exclusively consider communities having at least 3 annotated users (see Table 4). We will discard from the observations below the scarce cases where we only have one community to analyse, since standard deviation and NMI cannot be calculated on a unique community.
Table 5 presents the scores by interaction and algorithm. The first observation we can make is that retweets appear to be more important in terms of stance diffusion. For retweets, while almost all algorithms obtain a purity score of more than 90%, label propaga-tionand infomap obtain smaller standard deviation values. Label propagationalso obtain the best NMI scores for both dataset. For mentions, results are more variable. Infomap, Fast-greedy and
Table 3: Characteristics of the constructed graphs – D is the density measure and C the clustering coefficient.
# Vertices # Edges Degrees D C Mean Med Max
Using interactions between all users
SR RT 78,854 266,146 7 1 7,391 10 −5 0.019 @ 59,122 200,631 7 1 1,721 10−4 0.044 Both 120,165 443,322 7 1 7,785 10−5 0.031 ME RT 149,137 291,137 4 1 10,125 10 −5 0.001 @ 23,148 35,141 3 1 2,278 10−4 0.004 Both 163,646 320,007 4 1 10,288 10−5 0.001
Using interactions between annotated users only
SR RT@ 898258 16,938278 382 211 302237 0.0080.042 0.2980.002 Both 902 16,938 38 21 302 0.041 0.298 ME RT@ 973126 2,056125 42 21 12269 0.0150.004 0.1340.000 Both 989 2,180 4 2 123 0.004 0.106
Table 4: Number of communities containing at least 3 anno-tated users – the algorithms are represented by their initials.
Algorithm Scottish Referendum Midterms Elections RT @ Both RT @ Both Using interactions between all users
Modularity maximisation F 15 34 27 39 45 39 LE 19 1 1 3 19 1 M 17 36 29 43 47 43 Information I 102 85 38 112 159 103 diffusion LP 4 2 3 74 135 98 Random walk W 15 34 27 39 45 37 Using interactions between annotated users only
Modularity maximisation F 4 2 4 49 2 49 LE 4 2 2 33 2 n/a M 4 2 5 46 2 40 Information I 138 2 137 111 2 122 diffusion LP 4 2 4 94 2 94 Random walk W 4 2 4 49 2 45
Walktrapobtain good performances. Taking into account both in-teractions does not seem to offer an advantage, since purity and NMI scores for these graphs are inferior to those of the retweet graphs. All in all, algorithms based on information diffusion seem to have a slight advantage. They consistenly detect communities with a high purity, and despite the fact that they detect more communities, they still obtain better NMI scores than the other algorithms most of the time. For all graphs, multi-level and label propagation are the quickest algorithms with a runtime under 2 seconds. The slowest ones are fastgreedy and walktrap, with a runtime up to 25 minutes for the Scottish Independence Referendum dataset, and up to 75 minutes for the US Midterm Elections dataset. These obser-vations are not really surprising given the respective complexities of the algorithms (see Table 1).
4.3
Scores on annotated users only
One important caveat of this analysis is of course the communities without annotated users. Indeed, since all interactions are used to
Table 5: Scores for the SR and ME datasets – best scores are presented in bold and cases for which we have one commu-nity only to analyse in gray and in italic (see table 4).
Algorithm Scottish Referendum Midterms Elections RT @ Both RT @ Both Using interactions between all users
Purity Modularity maximisation F 0.97 0.78 0.86 0.93 0.63 0.77 LE 0.87 0.51 0.51 0.62 0.58 0.51 M 0.97 0.72 0.84 0.87 0.66 0.78 Information I 0.96 0.80 0.88 0.97 0.79 0.91 diffusion LP 0.98 0.53 0.54 0.93 0.78 0.90 Random walk W 0.97 0.78 0.86 0.93 0.63 0.77 SD Modularity maximisation F 0.16 0.13 0.15 0.14 0.12 0.15 LE 0.15 n/a n/a 0.24 0.15 n/a
M 0.17 0.15 0.16 0.17 0.12 0.17 Information I 0.10 0.19 0.17 0.10 0.18 0.15 diffusion LP 0.02 0.33 0.24 0.09 0.17 0.15 Random walk W 0.16 0.13 0.15 0.14 0.12 0.15 NMI Modularity maximisation F 0.55 0.12 0.25 0.28 0.02 0.12 LE 0.33 n/a n/a 0.14 0.023 n/a
M 0.52 0.08 0.21 0.22 0.04 0.13 Information I 0.22 0.13 0.21 0.24 0.11 0.20 diffusion LP 0.85 0.01 0.01 0.25 0.11 0.20 Random walk W 0.55 0.12 0.25 0.28 0.02 0.12
Using interactions between annotated users only
Purity Modularity maximisation F 0.99 0.76 0.99 0.98 0.58 0.94 LE 0.98 0.76 0.86 0.86 0.58 n/a M 0.99 0.76 0.98 0.98 0.58 0.94 Information I 0.96 0.75 0.97 0.97 0.58 0.96 diffusion LP 0.99 0.74 0.98 0.98 0.58 0.94 Random walk W 0.99 0.76 0.99 0.98 0.58 0.94 SD Modularity maximisation F 0.01 0.06 0.01 0.06 0.06 0.10 LE 0.02 0.06 0.16 0.07 0.06 n/a M 0.01 0.06 0.01 0.06 0.06 0.10 Information I 0.09 0.09 0.09 0.08 0.06 0.09 diffusion LP 0.01 0.09 0.01 0.08 0.06 0.09 Random walk W 0.01 0.06 0.01 0.06 0.06 0.10 NMI Modularity maximisation F 0.88 0.18 0.86 0.32 0.001 0.29 LE 0.69 0.18 0.50 0.26 0.001 n/a M 0.84 0.18 0.81 0.32 0.001 0.29 Information I 0.22 0.15 0.23 0.24 0.001 0.23 diffusion LP 0.86 0.15 0.85 0.27 0.001 0.24 Random walk W 0.88 0.18 0.86 0.32 0.001 0.29
construct the retweets and mentions graphs, we have a majority of users for whom we do not know the stance, and therefore a lot of communities for which we cannot evaluate stance homogeneity since they do not contain enough annotated users. To overcome this issue, we opted for detecting communities on the sub-graphs representing the interactions between annotated users only (see Table 3 for sub-graphs characteristics).
The results (see Table 5) show again that, even when using only the interactions between the subset of users used to build the datasets, stance can be determined by community.6By focusing on annotated users only, we obtain for almost all graphs better scores. Interestingly, for retweets, algorithms based on information diffusion do not seem to have an advantage over the others, contrary to the previous section. This may be due to the fact that focusing on interactions between annotated users does not allow to properly model the diffusion of information.
5
DISCUSSION
Retweet graphs generally seem to be a better way to detect homo-geneous like-minded communities than mention graphs. This is consistent with the previous observations made in the literature so far [5].
When considering retweet interactions, the leading algorithms are label propagation and infomap, two algorithms relying on information diffusion. This is a valuable observation, suggesting that, in a certain way, stance “follows” information on Twitter. These observations suggest that to efficiently detect like-minded communities on Twitter, it is a better idea to look at the information circulating between users rather than considering purely structural criteria. However the direction of diffusion does not seem to be important, since the implementation of label propagation we used in this work considers undirected edges. For mentions however, we can see that these algorithms do not really have an advantage compared to others, suggesting that mention graphs do not have the same underlying principles that retweet graphs, stressing a difference in use between these interactions.
This work featured only two interactions taken separately and focuses mainly on atypical users, limiting the generalization ca-pability of this study. The formation and diffusion of stances is a much more complex process, still hard to grasp by computing methods. We may assume that every interactions on social media has its own role in this process. It would be interesting to expand this comparison to more algorithms, datasets (including some with more than 2 stances), and interactions, and to see how well the systems taking into account several interactions [21] perform on like-minded communities.
6
CONCLUSION
In this article, we compare the performances of three classes of community detection algorithms for the detection of like-minded communities on Twitter. Despite the growing integration of social features in opinion mining systems, there is no existing comparison of state-of-the-art community detection methods on this particular task.
6We must note that leading eigenvector does not succeed in extracting communities
on the graph taking into account both interactions (see Table 4).
We found out that algorithms based on information diffusion seem to perform better when using retweet interactions and upheld the fact that retweets are a better vector of opinion than mentions. Overall, label propagation seems to be a good choice for detecting like-minded communities, it achieves excellent results and is one of the fastest among the algorithms we benchmarked.
Our results confirms that popular community detection algo-rithm can indeed be used as-is to reliably detect users’ stance under certain conditions.
REFERENCES
[1] Vincent D Blondel, Jean-Loup Guillaume, Renaud Lambiotte, and Etienne Lefeb-vre. 2008. Fast Unfolding of Communities in Large Networks. JSTAT 10 (2008), P10008. DOI:http://dx.doi.org/10.1088/1742-5468/2008/10/P10008
[2] Erik Borra and Bernhard Rieder. 2014. Programmed Method: Developing a Toolset for Capturing and Analyzing Tweets. AJIM 66, 3 (2014), 262–278. DOI: http://dx.doi.org/10.1108/AJIM-09-2013-0094
[3] Pierre Bourdieu. 1973. L’opinion Publique n’existe pas. Les temps modernes 318 (1973), 1292–1309.
[4] Igor Brigadir, Derek Greene, and Pádraig Cunningham. 2015. Analyzing Dis-course Communities with Distributional Semantic Models. In WebSci. 1–10. DOI: http://dx.doi.org/10.1145/2786451.2786470
[5] M. D. Conover, J. Ratkiewicz, M. Francisco, B. Gonçalves, A. Flammini, and F. Menczer. 2011. Political Polarization on Twitter. In ICWSM. 89–96.
[6] Gabor Csardi and Tamas Nepusz. 2006. The Igraph Software Package for Complex Network Research. InterJournal Complex Systems (2006), 1695.
[7] Leon Danon, Albert Díaz-Guilera, Jordi Duch, and Alex Arenas. 2005. Comparing Community Structure Identification. JSTAT 09 (2005), P09008. DOI:http://dx.doi. org/10.1088/1742-5468/2005/09/P09008
[8] Talasila Sai Deepak, Hindol Adhya, Shyamal Kejriwal, Bhanuteja Gullapalli, and Saswata Shannigrahi. 2016. A New Hierarchical Clustering Algorithm to Identify Non-Overlapping Like-Minded Communities. In HT. 319–321. DOI: http://dx.doi.org/10.1145/2914586.2914613
[9] Mihaela Dinsoreanu and Rodica Potolea. 2015. Opinion-Driven Communi-ties’ Detection. IJWIS 10, 4 (2015), 324–342. DOI:http://dx.doi.org/10.1108/ IJWIS-04-2014-0016
[10] M. Girvan and M. E. J. Newman. 2002. Community Structure in Social and Biological Networks. NAS 99, 12 (2002), 7821–7826. DOI:http://dx.doi.org/10. 1073/pnas.122653799
[11] Shanto Iyengar and Sean J. Westwood. 2015. Fear and Loathing across Party Lines: New Evidence on Group Polarization. AJPS 59, 3 (2015), 690–707. DOI: http://dx.doi.org/10.1111/ajps.12152
[12] Bing Liu. 2012. Sentiment Analysis and Opinion Mining. Synthe-sis Lectures on HLT 5, 1 (2012), 1–167. DOI:http://dx.doi.org/10.2200/ S00416ED1V01Y201204HLT016
[13] Miller McPherson, Lynn Smith-Lovin, and James M Cook. 2001. Birds of a Feather: Homophily in Social Networks. Annual Review of Sociology 27, 1 (2001), 415–444. DOI:http://dx.doi.org/10.1146/annurev.soc.27.1.415
[14] M. E. J. Newman. 2006. Finding Community Structure in Networks Using the Eigenvectors of Matrices. PRE 74, 3 (2006). DOI:http://dx.doi.org/10.1103/ PhysRevE.74.036104
[15] Pascal Pons and Matthieu Latapy. 2005. Computing Communities in Large Networks Using Random Walks. In ISCIS. Vol. 3733. 284–293. DOI:http://dx.doi. org/10.1007/11569596_31
[16] Usha Nandini Raghavan, Réka Albert, and Soundar Kumara. 2007. Near Linear Time Algorithm to Detect Community Structures in Large-Scale Networks. PRE 76, 3 (2007). DOI:http://dx.doi.org/10.1103/PhysRevE.76.036106
[17] Howard Rheingold. 1993. The virtual community: Finding commection in a com-puterized world. http://www.rheingold.com/vc/book/
[18] M. Rosvall, D. Axelsson, and C. T. Bergstrom. 2009. The Map Equation. EPJ ST 178, 1 (2009), 13–23. DOI:http://dx.doi.org/10.1140/epjst/e2010-01179-1 [19] Michael Speriosu, Nikita Sudan, Sid Upadhyay, and Jason Baldridge. 2011.
Twit-ter Polarity Classification with Label Propagation over Lexical Links and the Follower Graph. In EMNLP. 53–63.
[20] Jiliang Tang, Yi Chang, and Huan Liu. 2014. Mining Social Media with Social Theories: A Survey. ACM SIGKDD Explorations Newsletter 15, 2 (2014), 20–29. DOI:http://dx.doi.org/10.1145/2641190.2641195
[21] Lei Tang, Xufei Wang, and Huan Liu. 2012. Community Detection via Heteroge-neous Interaction Analysis. DMKD 25, 1 (2012), 1–33. DOI:http://dx.doi.org/10. 1007/s10618-011-0231-0
[22] Ken Wakita and Toshiyuki Tsurumi. 2007. Finding Community Structure in Mega-Scale Social Networks. In WWW. 1275. DOI:http://dx.doi.org/10.1145/ 1242572.1242805