1
Linking groundwater quality to residence times and regional geology in the St.
1Lawrence Lowlands, southern Quebec, Canada
23
Marion SABY1,*, Marie LAROCQUE1, Daniele L. PINTI1, 2,
4
Florent BARBECOT1, Yuji SANO2, Maria Clara CASTRO3
5
6
1 -GEOTOP and Département des sciences de la Terre et de l’atmosphère, Université du Quebec
7
à Montréal, CP8888 succ. Centre-Ville, Montréal, QC, Canada
8
2- Atmosphere and Ocean Research Institute, the University of Tokyo, Kashiwa, Chiba
277-9
8564, Japan
10
3 - Dept. of Earth and Environmental Sciences, University of Michigan, 1100 N. University, Ann
11
Arbor, MI 48109-1005, USA
12
13
* Corresponding author: marion.saby23@gmail.com
14
Keywords: groundwater quality, groundwater residence times, regional geology, St. Lawrence
15
Lowlands, Quebec (Canada).
2
ABSTRACT
17
The assessment of groundwater quality in shallow aquifers is of high societal relevance given
18
that large populations depend directly on these water resources. The purpose of this study was to
19
establish links between groundwater quality, groundwater residence times, and regional geology
20
in the St. Lawrence Lowlands fractured bedrock aquifer. The study focuses on a 4500 km2
21
watershed located in the St. Lawrence Lowlands of the province of Quebec in eastern Canada. A
22
total of 150 wells were sampled for major, minor, and trace ions. Tritium (3H) and its daughter
23
element, 3He, as well as radiocarbon activity (A14C) were measured in a subset of wells to
24
estimate groundwater residence times. Results show that groundwater evolves from a Ca-HCO3 25
water type in recharge zones (i.e., the Appalachian piedmont) to a Na-HCO3 water type 26
downgradient, toward the St. Lawrence River. Locally, barium (Ba), fluoride (F), iron (Fe), and
27
manganese (Mn) concentrations reach 90, 2, 18, and 5.9 mg/L respectively, all exceeding their
28
respective Canadian drinking water limits of 1, 1.5, 0.3, and 0.05 mg/L. Release of these
29
elements into groundwater is mainly controlled by the groundwater redox state and pH
30
conditions, as well as by the geology and the duration of rock-water interactions. This evolution
31
is accompanied by increasing 3H/3He ages, from 4.78±0.44 years upgradient to more than 60
32
years downgradient. Discrepancies between calculated 3H/3He and 14C water ages (the latter
33
ranging from 280 ± 56 to 17,050 ± 3410 years) suggest mixing between modern water and paleo-
34
groundwater infiltrated through subglacial recharge when the Laurentide Ice Sheet covered the
35
study area, and during the following deglaciation period. A linear relationship between 3H
36
activity and corrected 14C versus Mg/Ca and Ba support a direct link between water residence
37
time and the chemical evolution of these waters. The Ba, F, Fe, and Mn concentrations in
3
groundwater originate from Paleozoic rocks from both the St. Lawrence Platform and the
39
Appalachian Mountains. These elements have been brought to the surface by rising hydrothermal
40
fluids along regional faults, and trapped in sediment during their deposition and diagenesis due to
41
reactions with highly sulfurous and organic matter-rich water. Large-scale flow of meltwater
42
during subglacial recharge and during the subsequent retreat of the Laurentide Ice Sheet might
43
have contributed to the leaching of these deposits and their enrichment in the present aquifers.
44
This study brings a new and original understanding of the St. Lawrence Lowlands groundwater
45
system within the context of its geological evolution.
46
4
1. INTRODUCTION
48
Anthropogenic activity and climate change are arguably the largest threats to groundwater
49
quality in the 21st century (Aeschbach-Hertig and Gleeson, 2012), however local geology can
50
also have a significant impact (e.g., Nickson et al., 1998; Marimon et al., 2012). Groundwater quality 51
assessment has primarily been carried out using either statistical approaches applied to
52
geochemical data (Li et al. 2012; Mahlknecht et al., 2004; Maclear et al., 2003; Pacheco, 1998;
53
Paralta and Ribeiro, 2001), geochemical modeling (Carrillo-Rivera et al., 2002; Homoncik et al.,
54
2010; Marimon et al., 2012), or by tracing groundwater flow using stable and radioactive
55
isotopes (Clark and Fritz, 1997; Barbecot et al., 2000). These approaches require an
56
understanding of the present geological context, but not of the geological evolution of the region.
57
However, knowledge of the geological evolution of a particular region might prove critical to
58
understand which individual element or set of elements are present and how they interact with
59
each other and with the host media, in addition to their spatial distribution in a particular area.
60
Very few studies consider the diverse relationships between the past and present hydrogeological
61
contexts and the geological evolution of the studied area, the groundwater residence time, the
62
occurrence of highly mineralized fluids, and their role in the formation of economic deposits
63
(e.g., Aquilina and De Dreuzy, 2011a; Kloppmann et al., 2002).
64
With more than five million inhabitants, the St. Lawrence Lowlands is the most densely
65
populated region in the Canadian province of Quebec. This region hosts most of the agricultural
66
and industrial activities of the province. Approximately 5% of the groundwater extracted in this
67
area is used as drinking water (MDDELCC, 2012). The region is characterized by a regional
5
fractured bedrock aquifer of Cambro-Ordovician age, overlain by discontinuous and often
69
perched Quaternary granular aquifers. Several studies carried out in southern Quebec have
70
highlighted the presence of high barium (Ba), fluorine (F), iron (Fe), and manganese (Mn)
71
concentrations (Lacasse, 2013) in fresh and brackish groundwater (Cloutier et al., 2010). High
72
concentrations of these elements have been observed in the Becancour (Meyzonnat et al., 2015)
73
and Eastern Monteregie (Beaudry, 2013) watersheds in particular, but their origins (i.e.,
74
anthropogenic or natural) and release mechanisms into groundwater are not yet fully understood.
75
The purpose of this study was to establish links between groundwater quality, groundwater
76
residence times, and regional geology in the St. Lawrence Lowlands fractured bedrock aquifer.
77
This study focused on the Nicolet-St. François watershed (henceforth referred to as NSF), which
78
is located between the previously mentioned Becancour and Eastern Monteregie watersheds (Fig.
79
1). Understanding the regional geology and the emplacement of geological units over time is
80
extremely important to understanding past fluid circulation and the impact of these mineralized
81
fluids and rocks on the current groundwater chemical signature. Here, groundwater contains
82
relatively high levels of F, Ba, Mn, and Fe. To understand the spatial distributions of these ions
83
and their origins in groundwater, the groundwater chemistry and regional flow were traced using
84
major and trace elements measured in 150 wells, and residence times were estimated with the
85
3H/3He and 14C methods in a few select wells. Geochemical analyses were also made on rock 86
cuttings to constrain concentrations of anomalous elements in the bedrock aquifer. These were
87
compared with the corresponding concentrations in the groundwater.
88
6
2. GEOLOGY AND HYDROGEOLOGY OF THE STUDY AREA
90
2.1 Geology 91
The study area corresponds to the Nicolet River Basin and the lower part of the
Saint-92
François River watershed, in the Centre-du-Québec region (Fig.1a). The regional fractured
93
aquifer is composed of rocks belonging to two geological provinces: the Appalachian Mountains
94
in the southeastern part of the basin, and the St. Lawrence Platform in the northwestern part (Fig.
95
1a). Geographically, the area is part of the St. Lawrence Lowlands.
96
The St. Lawrence Platform is a Cambrian-Lower Ordovician siliciclastic and carbonate
97
platform, formed in an extensional context related to the opening of the Iapetus Ocean, and
98
overlain by Middle-Late Ordovician foreland carbonate-clastic deposits, which were deposited
99
during the closure of Iapetus and the Appalachian Mountains buildup. Cambrian Potsdam Group
100
quarztitic sandstone, Early Ordovician dolostone of the Beekmantown and Chazy Groups,
101
Middle-Late Ordovician carbonates of the Black River and Trenton Groups, carbonate-rich Utica
102
shale and the silty-shale of the Lorraine/Sainte-Rosalie Groups, and molassic shales of the
103
Queenston Group are unconformably deposited on the gneiss granite anorthosite terrains of the
104
Proterozoic Grenville Province (Globensky, 1987). Cambrian green and red shales of the Sillery
105
Group, slate, limestone, and sandstone conglomerate of the Bourret Fm, schists of the
106
Drummondville Olistostrome, calcareous slate of the Bulstrode and Melbourne Fm, and schists,
107
shales, sandstone and conglomerates of the Shefford, Oak Hill, and Sutton-Bennett Groups
108
outcrop in the Appalachian piedmont (Globensky, 1993).
7
Unconsolidated Quaternary fluvio-glacial deposits cover the fractured Paleozoic aquifer
110
(Lamothe, 1989). Basal deposits are tills from the last two Quaternary deglaciation episodes (45
111
and 13 ka BP), followed by glacio-lacustrine sandy and organic deposits. A thick clay layer
112
deposited during the Champlain Sea episode (12-9 ka BP; Bolduc and Ross, 2001) covers sandy
113
deposits over a 30 km strip along the St. Lawrence River (Lamothe and St-Jacques, 2014). This
114
thick clay layer led to the confinement of the underlying fractured bedrock aquifer and
115
Quaternary deposit aquifers in this narrow area. Further upgradient, the clay layer is no longer
116
uniform, creating a flat area composed of sand, patches of clay, and shale, which led to a
117
heterogeneous and semi-confined hydrogeological context. Upgradient, reworked till and bedrock
118
outcrops leave the fractured aquifer unconfined in its main recharge zone (Fig. 1b).
119
2.2. Hydrogeology 120
The study area is divided into two main aquifer systems (Larocque et al., 2015). The first
121
corresponds to superficial unconsolidated Quaternary aquifers of relatively limited thickness (1 to
122
80 m), and the second system is the underlying Paleozoic fractured bedrock aquifer. Hydraulic
123
conductivities in the fractured bedrock aquifer are heterogeneous and range from 5 x 10⁻⁹ m/s to 7
124
x 10-6 m/s (Larocque et al., 2015). Hydraulic conductivities in the Quaternary units range from
125
1.2x10⁻⁵ m/s for sand to 5.8x10⁻⁷ m/s for till. Groundwater flows from recharge zones in the
126
Appalachian piedmont toward the St. Lawrence River, and the main tributaries, the Nicolet and
127
Saint-François rivers. The mean depth of the water table is 4.4 m. The annual volume of
128
abstracted groundwater is 23.4 Mm3, corresponding to 3% of the annual recharge (152 mm;
129
Larocque et al., 2015). Most of the study area is either cultivated (48%, mainly along the
8
St. Lawrence River) or forested (45%, mainly in the Appalachian piedmont) (Larocque et
131
al., 2015). Urbanized zones, surface water, and wetlands occupy 2, 1.1, and 3.7% of the study
132
area respectively. Agriculture is dominated by corn (27%), hay (22.4%), and soybean (19.8%)
133
production (Larocque et al., 2015). The 1961-2010 average annual temperature for the study area
134
is 5.6°C, and the average annual precipitation is 1018 mm/yr (25% as snowfall; Nicolet and
135
Drummondville stations, Environment Canada, 2014).
136
137
3. SAMPLING AND ANALYTICAL METHODS
138
Between June and August 2013, 150 groundwater samples (147 in the fractured bedrock
139
aquifer, and 3 in the granular deposits; designated by NSF in Tables 1 and A1) were collected
140
from private and municipal open bedrock wells with depths ranging between 1 and 250 m
141
(Fig. 2). Ten additional observation wells and five piezometers were drilled and instrumented as
142
part of this project (designated by NSF-R in Tables 1 and A1). The five piezometers are 2.5 cm in
143
diameter, have a 1 m screen at their lower end, and reach between 2 and 10 m depth. The ten
144
drilled bedrock wells and all the other private bedrock wells are cased along the section crossing
145
the unconsolidated Quaternary deposits and are open in the bedrock aquifer (depths ranging
146
between 52 and 91 m). Domestic and observation wells were purged of a volume equivalent to
147
three times the borehole volume (GRIES, 2011) and water was sampled once its chemo-physical
148
parameters had stabilized (pH, temperature, redox potential, and electric conductivity, measured
149
with an air-tight cell). Continuously pumped municipal wells were sampled directly.
150
Groundwater was collected at the observation wells using a submersible pump with speed control
9
(Redi-Flo2®), maintaining the whole sampling line under pressure to prevent water degassing. All
152
samples were filtered to 0.45 µm in the field and analyzed for chemo-physical parameters in situ.
153
A subset of twenty samples was also analyzed for 3H and helium isotopic ratios (3He/4He). Ten of
154
these were also analyzed for 14C and δ13C of the total dissolved inorganic carbon (TDIC). This
155
last subset of samples was selected such that the wells would be representative of the general
156
flow gradient, spanning the Appalachian recharge zone to the St. Lawrence River. A further 14
157
water samples (Fig. 2) were collected for noble gas analysis using 3/8 inch refrigeration-type
158
copper tubes (Weiss, 1968). Water was allowed to flow for several minutes prior to sealing the
159
copper tubes with stainless steel clamps. All water samples were kept at 4°C during storage and
160
transport. Rock samples were taken from drilling wastes of the seven bedrock wells drilled
161
during the study in order to quantify the amount and distribution of different elements found in
162
excess of drinking water limits in the aquifer material. These samples have been selected to
163
follow the regional groundwater flow path, from the recharge zone to the discharge zone (cf. Fig.
164
2).
165
A certified laboratory (ISO/CEI 17025) analyzed major, minor (±0.5%) and trace (±2%)
166
solute ions and alkalinity using the ICP-MS method for ion analysis and titration at pH 4.5 for
167
alkalinity. HCO3 was computed from alkalinity using Diagramme® software (available at 168
http://www.lha.univ-avignon.fr/LHA-Logiciels.htm). Helium isotopes were analyzed at the
169
Noble Gas Laboratory of the University of Michigan and at the Atmospheric and Ocean Research
170
Institute (AORI) of the University of Tokyo. At the Noble Gas Laboratory of the University of
171
Michigan, noble gas isotopes were measured on a MAP-215 mass spectrometer. Elemental
172
abundances of He and Ne are associated with uncertainties of 1.5 and 1.3% respectively, at ± 1σ
10
level. Details on the noble gas analytical procedure of the University of Michigan can be found in
174
Ma et al. (2005) and Castro et al. (2009). Samples analyzed at AORI of the University of Tokyo
175
were degassed offline and subsequently purified in a line connected to a Helix SFT. Helium
176
isotopes were analyzed and compared to the Helium Standard of Japan (HESJ) standard (Matsuda
177
et al., 2002), with a 2σ precision of ±0.2% (Sano et al., 2008). 4He and 20Ne concentrations were
178
measured on a Pfeiffer QMS PrismaTM connected to the purification line. Details on the analytical
179
procedure of the University of Tokyo can be found in Sano et al. (2008). Tritium was analyzed at
180
the Environmental Isotope Laboratory (EIL) of the University of Waterloo using liquid
181
scintillation counting (LSC). Samples analyzed for tritium were concentrated 15 times by
182
electrolysis prior to counting. The detection limit for enriched samples is 0.8 TU (Heemskerk and
183
Johnson, 1998). Groundwater for 3H/3He and 14C age determination was sampled from wells
184
along what was expected to be the main groundwater flow directions (Fig. 2; Table 1).14C
185
activity and δ13C in groundwater were analyzed at the Beta Analytic Inc. Laboratory, Florida,
186
using a Single Stage Accelerator Mass Spectrometer (SSAMS). 14C measured activity (A14C) was
187
expressed in percent of modern carbon (pMC). The 13C content of TDIC is reported using (‰)
188
notation, as a deviation from the Vienna-Belemnite from the Pee Dee formation (V-PDB, North
189
Carolina, USA).
190
Seven rock samples were analyzed for whole rock geochemistry (Fig. 2; Table 2) at
191
ACME Lab in Vancouver. The samples were crushed to 80% passing 10 mesh (2 mm) and
192
pulverized to 85% passing 200 mesh (75 μm). The powders were mixed with LiBO2/Li2B4O7 flux 193
in the laboratory, fused, and dissolved in ACS-grade nitric acid, and analyzed by ICP for major
11
elements and ICP-MS for minor elements. Total carbon and sulfur were measured using the Leco
195
method (LECO Corporation, 2007).
196
197
4. RESULTS
198
Table A1 (in the Appendix) reports the main physico-chemical parameters of the 150
199
sampled wells measured in the field, together with the major ion concentrations, and those of Ba,
200
F, Fe, Mn, and Sr. Table 1 shows the tritiogenic 3He concentrations (3Hetri in cm3STP/gH2O) and 201
tritium (3H in TU), used for calculating 3H/3He ages in the selected wells. The measured 14C
202
activities (A14C in pMC) and the 13C of soil CO
2 are also reported as uncorrected 14C ages (A0 = 203
100 pMC) and corrected 14C ages, using the Fontes and Granier equilibrium model (henceforth
204
the F&G equil; Fontes, 1992). Uncertainties on the 14C uncorrected ages are estimated to be
205
±0.5% of the reported value, and are related to the analytical uncertainties of the measured A14C
206
(Table 2). Uncertainties of ±20% of the reported value for the corrected 14C ages depend
207
essentially on the assumed δ13C of the soil CO2 for the F&G equil (see section 4.2 for details). 208
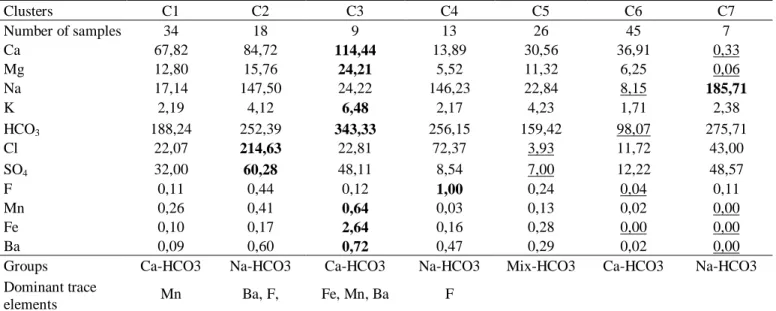
Table 2 reports major oxides and trace elements of the rock cuttings. Table 3 reports the
209
results of a Hierachical Cluster Analysis (HCA) applied to all 150 samples, performed using the
210
commercial software package JUMP®. This HCA highlights the statistical robustness of the
211
relationship between water chemistry types (determined based on the major ions) and the relative
212
enrichments of trace ions in groundwater.
213
12 4.1 Groundwater chemistry
215
92.5% of all water samples from the current study are of Ca,Mg-HCO3 and Na-HCO3 type 216
(Fig. 3). The Ca,Mg-HCO3 type represents modern freshwater, where the dissolution of 217
Quaternary calcareous tills and Ordovician calcareous shales of the fractured aquifer is the
218
dominant process (Cloutier et al., 2010; Meyzonnat et al., 2015). This water circulates mainly in
219
the unconfined aquifers of the Appalachian piedmont (Fig. 2). The Na-HCO3 group represents 220
more evolved groundwater, the chemistry of which is mainly controlled by Ca2+–Na+ ion
221
exchange, whereby Ca2+water exchanges with Na+mineral (e.g., Cloutier et al., 2010). This water type 222
occurs downgradient in the study area, both in semi-confined and confined environments. A few
223
water samples close to the St. Lawrence River are of Na-Cl, Na-SO4, and Ca-Cl water types (Fig. 224
3). The Na-Cl water type represents groundwater with salinity derived from mixing with pore
225
seawater trapped in the Champlain Sea clays or in the fractured rock aquifers (Meyzonnat et al.,
226
2015). Two samples, NSF-R7 and NSF165 (Table A1), located upgradient in the study area, have
227
abnormally high NaCl concentrations, of 3500 and 260 mg/L respectively. Such high Na/Cl
228
ratios are likely the result of local pollution from road deicing salt.
229
Plots of Mg/Ca ratios versus pH can provide information on carbonate dissolution
230
processes (Cloutier et al., 2010). A Mg/Ca ratio of between 0.5 and 1 is representative of young,
231
Ca,Mg-HCO3 type groundwater in equilibrium with calcite and dolomite. In the study area, this 232
diagram shows a positive trend between Mg/Ca and pH, suggesting incongruent-dissolution of
233
Mg-calcite or dolomite along the regional flow path (Fig. 4a), and is concordant with the
234
geochemical downgradient groundwater evolution. A plot of (Ca+Mg)/(Na+K) ratios versus total
13
cations (Fig. 4b) suggests cationic exchange between Ca and Na (Appelo and Postma, 2005;
236
Cloutier et al., 2006). Calcium derived from Ca-HCO3 type water replaces the sodium from clay 237
or iron minerals. This process enriches the water in Na+ compared to Ca2+, confirming the ion
238
exchange. A similar process depletes Ca2+ from downgradient groundwater. A saline water
end-239
member is identified by the shift of the Na-Cl and Na-SO4 water groups. This shift is thought to 240
indicate mixing between fresh and saline water (Fig. 4b).
241
Ten wells show Ba concentrations above the drinking water threshold value of 1 mg/L
242
(Table A1), and twelve wells show Ba concentrations of between 0.5 and 1 mg/L. F exceedances
243
are rare in the study area, with only two wells exceeding the drinking water quality standard of
244
1.5 mg/L (Health Canada, 2014), and eight wells with concentrations of between 1 and 1.5 mg/L
245
(Table A1). Fe concentrations are as high as 18 mg/L in 32 wells, compared with the Canadian
246
esthetic quality standard of 0.3 mg/L (Health Canada, 2014), and Mn concentrations are as high
247
as 5.9 mg/L, compared with the Canadian esthetic quality standard of 0.05 mg/L (Health Canada,
248
2014; Table A1).
249
Rock analyses from seven locations (Fig. 2) show that Ba concentrations range from 124
250
to 1055 ppm, F concentrations from 386 to 955 ppm, and Fe2O3 concentrations from 1.27 to 251
8.55%. MnO concentrations vary between 0.03 and 0.18% in both the St. Lawrence Lowlands
252
and the Appalachian Mountains (Table 2). Other analyses performed as part of previous studies
253
in the area show even higher maximum values: greater than 1500 ppm Ba and F, greater than
254
20% Fe2O3, and greater than 0.25% MnO (SIGEOM, 2014). 255
14 4.2. 3H/3He and 14C groundwater residence times 257
The calculation of 3H/3He ages requires the separation of helium derived from the decay
258
of post-bomb tritium (3Hetri) from all other helium components potentially present in 259
groundwater. These additional components may include 1) atmospheric helium in solubility
260
equilibrium with water (Heeq), 2) excess air helium (Heea), which results from air bubbles 261
entering the water table, and 3) terrigenic helium (Heterr), produced by U and Th decay in the 262
crust and/or derived from a mantle component. The Weise-plot diagram (Fig. 5) shows helium
263
isotopic ratios, for which both numerator and denominator have been corrected for air
264
contamination by substracting the 3He and the 4He amounts derived from excess air (ea) ) (3Hetot -265
3He
ea)/(4Hetot-4Heea). The corrected excess air 3He/4He ration (here normalized to the 3He/4He 266
ratio in the atmosphere Ra = 1.386 x 10⁻⁶, is plotted against the inverse of the normalized helium
267
concentration corrected for excess-air (4Heeq/(4Hetot-4Heea)) (Weise and Moser, 1987). Mixing 268
between the different end-members is represented by a linear equation, Y= mX+b (Weise and
269
Moser, 1987), as per eqn. 1:
270
b terr ea tot eq m eq tri terr eq ea tot ea tot R X He He He He He R Y He He He He 4 4 4 4 3 4 4 3 3 R (1) 271where Hetot is the total measured helium, Req is the 3He/4He ratio of the atmospheric helium in 272
solubility equilibrium with water (0.984 Ra; Benson and Krause, 1980), and Rterr corresponds to 273
the time-integrated ratio of 3He and 4He radiogenic production of the crust and/or mantle He
274
addition. Straight lines traced along groups of samples represent mixing of post-bomb
15
groundwater accumulating 3Hetri and pre-bomb radiogenic 4He enriched groundwater (Fig. 5). 276
The slope, “m”, of eqn. (1) is associated with the amount of tritium that completely decayed into
277 3He
tri and the Y-intercept, Rterr (the “b” term in eqn. 1). Groundwater helium can be explained by 278
the decay of 4 to 67 TU of tritium mixed with terrigenic helium characterized by Rterr ranging 279
from 0.05 to 0.70Ra. This Rterr value is higher than that expected for local production from Li 280
(3He), U and Th (4He) present in local formations (0.012Ra; Pinti et al., 2011; Méjean et al.,
281
2015) and suggests a mantle helium contribution on the order of 0.5 to 8.6%. This mantle helium
282
is derived from the leaching of plutonic intrusions of the Cretaceous Monteregian Hills (Pinti et
283
al., 2011). 3Hetri can be estimated following the equation of Schlosser et al., 1989: 284 ) ( ) ( ) ( ) ( 20 20 20 4 4 4 3 terr ea eq tot ea terr eq eq terr tot tot trit Ne Ne R R Ne He R R He R R He He (2) 285
where R is the measured 3He/4He ratio in groundwater; Ratm and (4He/20Ne)ea are generally 286
assumed to be atmospheric (Ratm = 1.382 x 10⁻⁶; Sano and Fischer, 2013; [4He/20Ne]exc = 0.3185; 287
Ozima and Podosek, 1983). Measured tritium in the current study ranges from the detection limit
288
value of 0.8 TU (NSF224 and NSF-R1) to 12.7 TU (NSF219) (Table 1).
289
Calculated 3H/3He ages vary between 4.8±0.4 years in well NSF215, upgradient, and
290
60.0±3.2 years in well NSF-R4, downgradient, in the fractured bedrock aquifer (Table 1; Fig. 2).
291
3H/3He ages cannot be calculated for sample NSF-R1, located downgradient. The tritium content 292
for this well is below the detection limit of 0.8 TU, indicating that water recharged prior to the
293
bomb peak (background 3H of 5-6 TU; Clark and Fritz, 1997) and that any detectable tritium has
294
completely decayed since then. This sample also contains very high amounts of radiogenic 4He,
16
5.29 x 10⁻⁶ cm3STP/gH2O, two orders of magnitude higher than the atmospheric amount of helium 296
in solubility equilibrium with water (Air saturated Value or ASW; i.e. 4.6 x 10⁻⁸ cm3STP/gH2O at 297
10˚C; Smith and Kennedy, 1983). This high amount of radiogenic 4He indicates the presence of
298
paleo- water, possibly tens of thousands of years old, as also indicated by uncorrected 14C ages
299
(see below). Calculated 3H/3He ages for samples NSF137, 149, 150, 221 and 224 (Table 1) are
300
older than 60 years, and are therefore at the limit of the dating method. This is due to the fact that
301
their measured 3He/4He ratios are very radiogenic, i.e. close to the Rterr end-member(Fig. 5). The 302
calculation of 3Hetri can be difficult to assess because it is overshadowed by the 3Heterr and this 303
can easily lead to an under- or overestimation of the 3Hetri and so of the ages. 304
Measured 14C activities (A14C) plotted against the δ13C of TDIC generally show an
305
inverse trend (R2 = 0.74), suggesting the evolution of groundwater carbon content with age (Fig.
306
6a). Post-bomb tritium-rich groundwater dissolves biogenic soil CO2 (A14C = 120 pMC; 13C ~ -307
23‰), evolving with time and accumulating dead carbon from carbonate dissolution (A14C = 0
308
pMC; 13C = 0‰; sample NSF-R1). Uncorrected 14C ages range from 230 ± 56 years for well 309
NSF219, located in the main recharge area of the Appalachians piedmont, to 17,050 ± 3410 years
310
for well NSF-R1, located downgradient in a semi-confined zone (Table 1; Fig. 2). 14C activities
311
were corrected for carbonate dissolution (A014C) using the F&G equil model (Fontes, 1992). This 312
is the only 14C age model adapted to carbonate-dominated aquifers which takes into account both
313
the dissolution of carbonates and the Ca-Na exchange processes (Fontes, 1992; Plummer and
314
Glynn, 2013). Corrected 14C ages range from 280 ± 2 yrs for well NSF219 to 10,210 ± 80 years
315
for well NSF221 which is located in the plain at the base of the Appalachian piedmont, in a
semi-316
confined aquifer (Fig. 2). The F&G equil model fails to provide a corrected 14C age for well 317
17
NSF-R1, probably because of its high levels of dead carbon (A14C = 6.5 pMC and δ13C = 1.9 ‰).
318
Other well-known 14C correction models of Pearson (1992), Mook (1972), IAEA (Salem et al.,
319
1980), Evans et al. (1979), and Eichinger (1983) are not able to calculate a 14C age for NSF-R1
320
groundwater. Only 14C activities corrected with the model of Tamers (1967) allow the calculation
321
of a corrected 14C age, of 17,050±3410 years (Table 1).
322
The apparent contradiction between calculated 3H/3He and 14C ages (Table 1) is often
323
observed in aquifers (i.e., Andrews, 1985; Patriarche et al, 2004; Castro and Goblet, 2005) and is
324
thought to result from the mixing of water masses having different ages and origins. This is
325
apparent from the significant relationship (R2 = 0.80) between measured 14C and 3H activities
326
(Fig. 6b). Samples from the current study area (NSF) have been compared to those from the
327
neighboring Becancour watershed (BEC; data from Vautour et al., 2015) to show that such
328
mixing is a common occurrence and dominant process in the St. Lawrence Lowlands aquifers.
329
The first end-member represents recently recharged freshwater containing some post-bomb 14C
330
(A14C = 97.3 pMC) and tritium (3H = 12.7 TU). The second end-member is an older
331
groundwater, recharged prior to 1952, and thus containing pre-bomb tritium (< 0.8 TU; Clark and
332
Fritz, 1997) as well as A14C ≤ 6.5 pMC, the latter derived by the addition of dead carbon from the
333
carbonate pool. Most modern water (well NSF219) is of Ca-HCO3 type at a depth of 6.1 m, while 334
the oldest water (well NSF-R1) is of Na-Cl type under entirely confined conditions at a depth of
335
84.4 m. This mixing could have taken place in the wells or in the aquifer itself. The first
336
hypothesis is unlikely, because the totality of the sampled wells from the fractured aquifer are
337
equipped with casing that prevents water from the unconsolidated granular aquifer to flow into
18
the fractured one. Thus the observed mixing between freshwater and fossil water is expected to
339
have occurred in the fractured aquifer itself.
340
341
5. DISCUSSION
342
5.1 Trace elements and groundwater quality 343
HCA applied to the major and trace ions of the 150 sampled wells (Table 3) allows the
344
relationship between the chemical evolution of groundwater in the watershed and their trace
345
element concentrations, such as those of Ba, F, Fe, and Mn, to be highlighted. The HCA indicates
346
that the more evolved waters are those enriched in Ba, F, Fe, and Mn. These are 1) Ca-HCO3 347
groundwater, mainly located downgradient, far from the main recharge zone of the Appalachian
348
Mountains, and in a semi-confined environment; 2) evolved Na-HCO3 waters which underwent 349
Ca-Na ionic exchange (Table 3).
350
Calculated 14C ages support the occurrence of prolonged water-rock interactions, which
351
could have led to the release of trace elements such as Ba, F, Fe, and Mn into groundwater. This
352
water evolved chemically with time, as shown by the Mg/Ca ratio, which inversely correlates 353
with 3H activities (Fig. 7a) and positively correlates with corrected 14C ages (Fig. 7b). It is also 354
apparent that water types tend to follow this pattern by evolving downgradient from Ca-HCO3 to 355
Na-HCO3 (Fig. 7b). 356
Ba concentrations tend to increase from upgradient to downgradient along the general
357
flow path (Fig. 8). Ba increases significantly when water flows through the Sillery group, the
19
Bourret Fm and the Olistotrome of Drummondville, which correspond to the same type of rocks
359
as those which host barium economic deposits (see Fig. 8 and section 5.2). A second increase in
360
Ba occurs in the Lorraine and Ste-Rosalie Groups. Concentrations finally decrease in the
361
Queenston Group.
362
Fluorine has been reported as problematic in other basins of the St. Lawrence Lowlands,
363
particularly in the Eastern Monteregie (Beaudry, 2013). Plotting Ca versus F concentrations (Fig.
364
9a) yields a saturation curve which highlights the precipitation of calcium-fluorine by
365
groundwater circulation as a result of the release of F into groundwater. However, results also
366
show a clear relationship between pH and F in groundwater (Fig. 9b), which can signify an
367
exchange between F- and OH-, a process called desorption (Savenko, 2001). Desorption of F
368
tends to occur above a pH of 7 (Hounslow, 1995), increasing with pH and OH- availability.
369
Fe and Mn sources in groundwater are known to be related to pH and redox conditions
370
(Homoncik et al., 2010). Figure 10a shows that Fe2+ and Mn2+ can be mobilized in groundwater
371
over a large range of pH and Eh values. Generally, Fe is more soluble under the Fe2+ form in
372
weakly oxidizing water and reducing water than Mn. Mn will be more soluble under the Mn2+
373
form in more strongly oxidizing water. Some samples have very low Fe and Mn concentrations
374
despite the fact that conditions are favorable for their release into groundwater, implying that
375
these elements are not fully available in the matrix. Reducing water conditions seem to better
376
explain Fe availability in water than does pH (Fig. 10a). For Mn, the relationship with Eh and pH
377
is less clear than for Fe, but reducing water is still the main factor controlling the concentration of
20
dissolved Mn in groundwater. In near-neutral pH conditions, interactions between Fe and Mn can
379
occur (Collins and Buol, 1970).
380
The scatterplot of Fe versus Mn (Fig. 10b) shows that high Fe concentrations are found
381
only with high Mn concentrations, while high Mn concentrations can occur in the presence of a
382
wide range of Fe concentrations, probably because of its greater availability in the host rock. The
383
high affinity of Mn to ferric oxides could lead to its removal by occlusion and sorption to
384
precipitated Fe (Morgan and Stumm, 1965; Collins and Buol, 1970). Conversely, when Fe oxides
385
are reduced by the flow of reducing groundwater, Fe2+ and Mn2+ are released. Moreover, Fe is
386
more likely to adsorb or form complexes with organic matter than is Mn (Hem, 1972). The
387
occurrence of Mn in the upgradient portions of the study area can be explained by its occurrence
388
coinciding with a larger range of Eh values than Fe, and because it is less reactive with organic
389
matter and thus does not form complexes with it.
390
5.2 Origin and evolution of trace elements in rocks and their release into groundwater 391
Ba is mostly found in host rock in the form of the barite mineral (BaSO4). This mineral 392
formed chemically when Ba2+, originating from rising hydrothermal fluids across the Grenville
393
shield (Carignan et al., 1997) to the surface, encountered sulfate-rich water, such as seawater. The
394
precipitation of barite mainly depends on the availability of sulfate (from seawater) and barium
395
(mainly from crystalline rocks), these two elements not being transported together. (Machel,
396
2001; Aquilina et al., 2011b, 1997). Barite is then trapped in carbonate rocks during diagenesis
397
(Paradis and Lavoie, 1996). The direct relationship between Ba and corrected 14C ages (Fig. 7c)
398
also suggests that a long water-rock interaction time, as well as the quasi-absence of recharge
21
downgradient, is critical in the release of this element into groundwater, and leads to an increase
400
in Ba concentrations along the flow path.
401
Similarly, F- has a hydrothermal origin and can precipitate under the form of fluorite
402
(CaF2) in carbonate rocks during diagenesis, when it is in contact with calcium-rich water, such 403
as seawater. F- can also be adsorbed in clays by exchange with OH- under acidic conditions
404
(Savenko, 2001), as in the volcanic activity of the Paleozoic. Reactivation of the St. Lawrence rift
405
system occurred during the Devonian and Mesozoic (Carignan et al., 1997; Tremblay et al., 2013;
406
Bouvier et al., 2012) bringing additional hydrothermal fluids and leading to F and F-Ba veins
407
hosted in Cambro-Ordovician rocks (Carignan, 1989; Carignan et al., 1997). Dissolution of these
408
veins might be a secondary source of dissolved F and Ba in modern groundwater, but it is
409
unlikely to be the main source because of their low presence and distribution in the area (more to
410
be considered as recorders of past events).
411
The main process leading to Fe- and Mn- sulfide precipitation in rocks is the sulfide
412
biogenic or thermochemical reduction (Machel, 2001). Lorraine shales contain up to 1.5% Total
413
Organic Carbon (Lavoie et al., 2013). The availability of reactive sulfate and organic matter is the
414
main factor underlying the transport/concentration of either Fe or Mn sulfides (eqn. 3, 4) in
415
anoxic/high temperature conditions (eqn. 5), or oxides (Fe2O3 and MnO) in cooler/oxidant 416 conditions. 417 𝐹𝑒2++ 𝐻 2𝑆 → 𝐹𝑒𝑆 + 2𝐻+ (3) 418 𝐹𝑒𝑆 + 𝐻2𝑆 → 𝐹𝑒𝑆2+ 𝐻2 (4) 419
22
2𝐶𝐻2𝑂 + 𝑆𝑂42− → 2𝐻𝐶𝑂
3− + 𝐻2𝑆 (5) 420
The presence of pyrite (FeS2) has been observed in Appalachian metasediments (Sassano and 421
Schrijver, 1989; and in the NSF-R7 drilled well of this study) and in the Utica and Lorraine
422
shales (Bérubé et al., 1986), confirming the formation of Fe sulfides in the region during the
423
Paleozoic. Mn nodules from the Ordovician were found in the Appalachians, close to the study
424
area, in the St. Daniel Fm. (Trottier et al., 1991). Major weathering episodes driven by massive
425
groundwater recharge during the Devonian last stage of Appalachian orogeny (Lavoie, 2008) led
426
to the oxidation of Fe and Mn sulfides (FeS2 and MnS) present in rocks, the release of Fe2+ and 427
Mn2+ into the aqueous media, and precipitation in the form of Fe and Mn oxides (Fe2O3 and 428
MnO; Appelo and Postma, 2005). The later confinement provided by the Champlain Sea clay
429
deposits led to the progressive reduction of groundwater which triggered the reduction of Fe and
430
Mn oxides and sulfurs in the rock, and the release of Fe2+ and Mn2+ into groundwater.
431
The potential sources of Ba, F, Fe, and Mn are thus the Ordovician rocks of the St.
432
Lawrence Platform and the Appalachian Mountains. Enrichment of these elements could be
433
related to Paleozoic episodes of Mississippi Valley Type (MVT) ore deposition (Ingebritsen and
434
Sanford, 1998; Machel, 2001), as observed in the Beekmantown Group dolostones in New York
435
State and in Ontario (Benison and Lowenstein, 1997). Macro-evidence of MVT-related deposits
436
is a barite ore exploited near the town of Upton, 20 km west of the study area in the
437
Drummondville Olistostrome of mid-Ordovician age (Paradis and Lavoie, 1996). Migration of
438
Na-Ca-Cl and Na-Cl-Br brines (Bethke and Marshak, 1990; Sverjenski and Garven, 1992) is
439
believed to be the main mechanism of MVT ore concentration. Primary fluid inclusions in quartz,
23
calcite, and saddle dolomite of the Beekmantown dolostones indicate that the mineralizing fluids
441
were Na-Ca-Cl brines (Benison and Lowenstein, 1997, Aquilina et al., 2011a,b). Pinti et al.
442
(2011) studied the origin of Na-Ca-Cl brines (up to 350 g/L TDS) in the Beekmantown and
443
Chazy Groups at Becancour. They concluded that these brines could be of Devonian age, one of
444
the most prolific periods of MVT ore deposition in North America (Garven et al., 1993).
445
5.3 Groundwater residence times and their relationship with excess trace ion concentrations 446
Corrected 14C ages range from 17,050±3410 yrs for NSF-R1 to 283±57 yrs for NSF219
447
(Table 1). The older 14C age corresponds to a period when the Laurentide Ice Sheet covered the
448
study area. However, as a result of the geothermal gradient, as well as the heat generated by
449
friction, meltwater was present at the base of the continental glaciers (e.g., Gilkeson et al., 1981).
450
There is compelling evidence that the magnitude of subglacial recharge into confined aquifer
451
systems covered by the Laurentide Ice Sheet was up to 10 times greater than at present (e.g.,
452
McIntosh and Walter, 2005; Person et al., 2007). The other corrected 14C ages obtained in the
453
NSF watershed range between 12,000 and modern (Table 1), similar to the 14C ages found in the
454
neighboring watersheds of Becancour (corrected 14C from 9,200 to modern; Vautour et al., 2015)
455
and Eastern Monteregie (uncorrected 14C ages from 13,800 to modern; Beaudry, 2013). This
456
period roughly corresponds to the ice retreat of the Laurentide Ice Sheet, followed by a
glacio-457
isostatic marine transgression, known as the Champlain Sea, which invaded the study area
458
12,800-12,300 yrs ago (Parent et al., 1985). Between 10,600 and 6,700 yrs before present, the
459
main phase of isostatic rebound lowered the St. Lawrence River base level from +60 m asl to ca.
460
16 m asl (Lamarche et al., 2007). At 6.7 kyrs, the hydrographic network of the St. Lawrence
24
Valley reached a configuration close to that observed at present. It is expected that during this
462
accelerated isostatic rebound period, new emerging recharge zones and increased potentiometric
463
heads favored a large invasion of meltwater into the shallower Quaternary aquifers (e.g., Person
464
et al., 2007) and the confined aquifers of the St. Lawrence Lowlands.
465
In the Michigan basin, large amounts of meltwater resulted in the dissolution of Devonian
466
evaporites, which increased the groundwater salinity (e.g., McIntosh et al., 2011). In a broad
467
region of the Cambrian-Ordovician aquifer system of northeastern Illinois, dissolution of
468
secondary barite, driven by meltwater infiltration, led to high dissolved barium concentrations in
469
groundwater (Gilkeson et al., 1981). In the St. Lawrence Lowlands, a similar process could have
470
taken place. During subglacial recharge under the Laurentide Ice Sheet at around 20,000 yrs
471
(Person et al., 2007), a large amount of meltwater could have favored the dissolution of
472
secondary barite, which was subsequently diluted by the last episode of meltwater formation
473
during the Laurentide Ice Sheet retreat (12,000 yrs), and the reorganization of the hydrographic
474
network of the St. Lawrence Lowlands (6700 yrs and younger) (Fig. 7c).
475
Similar results have been recently showed in the Armorican basement in terms of ages and
476
links between elements dissolved in old groundwater and glacial transport which supports the
477
groundwater evolution model presented in this study (Aquilina et al., 2015).
478
479
6. CONCLUSIONS
25
The objective of this study was to establish links between groundwater quality,
481
groundwater residence times, and regional geology on the scale of the St. Lawrence Platform and
482
the Appalachian Mountains aquifers in southern Quebec (Canada). To attain this objective, the
483
study combined groundwater chemistry and groundwater residence times with an economic
484
geology model and historical geology.
485
Results have shown that major ion concentrations highlight regional groundwater flow
486
directions and the evolution of groundwater from a young water end-member, characterized by
487
the Ca-HCO3 water type in the piedmont of the Appalachians recharge area, to an old water end-488
member, characterized by the Na-HCO3 type downgradient in the study area. Two distinct water 489
masses were identified, with 3H/3He ages pointing to water less than 60 years, and 14C ages of
490
several thousand years, likely infiltrated in the Cambro-Ordovician aquifers by subglacial
491
recharge or immediately following the last deglaciation. This long interaction time between rock
492
and groundwater is likely an important factor in the release of anomalous concentrations of Ba, F,
493
Fe, and Mn into groundwater. Their concentrations in the rock can be explained by their
494
deposition as mineral phases (barite, sulfates, etc.) in the sedimentary rocks of the
Cambro-495
Ordovician St. Lawrence Platform and Appalachians. Their recent release in post-glacial
496
groundwater might be favored by the redox state, geology, pH, interaction with organic matter,
497
and availability of reactive dissolved compounds, such as SO42-. This work shows that the release 498
of hydrothermal fluids along regional faults in the sedimentary basin, combined with marine
499
water, has likely triggered the deposition of sulfides in reducing environments and the deposition
500
of oxides in oxidizing environments.
26
This study brings a new and original understanding of the groundwater system within the
502
context of its geological history. It not only characterizes the natural groundwater quality of the
503
study area, but also contributes to better understanding groundwater quality problems in the
504
St. Lawrence Lowlands. A similar approach to understanding natural groundwater quality
505
problems could be used in similar geological settings, such as in the Paleozoic sedimentary
506
basins of Michigan or Mississippi, for example, but may also be applied in different geological
507
contexts, such as volcanic or plutonic settings.
508
509
ACKNOWLEDGMENTS
510
The authors would like to thank the Quebec Ministry of Environment (Ministère du
511
Développement durable, de l’Environnement et de la Lutte contre les changements climatiques),
512
the Quebec Research Fund (“Fonds de recherche du Québec - Nature et Technologies”), as well
513
as the “Municipalités régionales de comtés-MRC”, the “Conseil régional des élus-CRE”, the
514
municipalities, and the well owners who contributed funding to this research and access to
515
sampling locations. We wish to thank Chris Hall of the University of Michigan (USA) for
516
analyzing helium isotopes, and Pauline Méjean for helping with the analyses during her stay at
517
AORI, University of Tokyo (Japan). Michelle Laithier (UQAM) is thanked for having redrawn
518
the figures of this manuscript.
519
27
REFERENCES
521
Aeschbach-Hertig, W., Gleeson, T., 2012. Regional strategies for the accelerating global problem
522
of groundwater depletion. Nat. Geosci. 5, 853-861.
523
Andrews, J.N., 1985. The isotopic composition of radiogenic helium and its use to study
524
groundwater movement in confined aquifers. Chem. Geol. 49, 339-351.Appelo C.A.J., Postma,
525
D. (2005). Geochemistry, groundwater and pollution, 2nd edn. CRC Press, Boca Raton, Florida,
526
USA.
527
Aquilina L., Vergnaud-Ayraud V. Armandine Les Landes A. Pauwels H. Davy P.
Pételet-528
Giraud E., T., Roques C., Chatton E., Bour O., Ben Maamar S., Dufresne A., Khaska M., Le Gal
529
La Salle C., Barbecot F. 2015. Impact of climate changes during the last 5 million years on
530
groundwater in basement aquifers. Scientific Reports 5, 14132.
531
Aquilina, L., De Dreuzy, J.R., 2011a. Relationship of present saline fluid with paleomigration of
532
basinal brines at the basement/sediment interface (Southeast basin – France). Appl. Geochem. 26,
533
1933-1945.
534
Aquilina L., Boulvais P., Mossmann J.R., 2011b. Fluid migration at the basement/sediment
535
interface along the marginof the South-East Basin (France) : implications for Pb-Zn ore
536
formation. Miner. Deposita 46-8, 959-979.
537
Aquilina L., Pauwels H. and Fouillac C., 1997. Water-rock interaction processes in the Triassic
538
sandstone and the granitic basement of the Rhine graben : geochemical investigation of a
539
geothermal reservoir, Geochim. et Cosmochim. Acta 61-20, p. 4281-4295.
28
Barbecot, F., Marlin, C., Gibert, E., Dever. L., 2000. Hydrochemical and isotopic characterisation
541
of the Bathonian and Bajocian coastal aquifer of the Caen area (northern France). Appl.
542
Geochem. 15, 791-805.
543
Beaudry, C., 2013. Hydrogéochimie de l'aquifère rocheux régional en Montérégie est, Québec.
544
MS Thesis. Institut national de la recherche scientifique (INRS), Quebec, Canada.
545
Benison, K.C., Lowenstein, T.K., 1997. Carbonate-hosted mineralization of the Lower
546
Ordovician Ogdensburg Formation: Evidence for a Paleozoic thermal anomaly in the St.
547
Lawrence lowlands of New York and Ontario. In: Montenez, I., Shelton, K., Gregg, J., (Eds.),
548
Basin-wide fluid flow and associated diagenetic patterns: Integrated petrologic, geochemical, and
549
hydrologic considerations. SEPM Spec. Publ. 57, 207-218.
550
Benson, B.B., Krause, D., 1980. Isotopic fractionation of helium during solution: A probe for the
551
liquid state. J. Sol. Chem. 9, 895-909.
552
Bérubé, M.-A., Locat, J., Gélinas, P., Chagnon, J.-Y., Lefrançois, P., 1986. Black shale heaving
553
at Sainte-Foy, Quebec, Canada. Can. J. Earth Sci. 23, 1774-1781.
554
Bethke, C.M., Marshak, S., 1990. Brine migrations across North America — The plate tectonics
555
of groundwater. Annu. Rev. Earth Planet. Sci. 18, 287-315.
556
Bolduc, A.M., Ross, M., 2001. Surficial geology, Lachute-Oka, Québec. Geol. Surv. Can. Open
557
File 3520.
29
Bouvier, L., Pinti, D.L., Tremblay, A., Minarik, W., Roden-Tice, M., 2012. Late Jurassic
559
reactivation of the St. Lawrence rift system, Québec, Canada: evidence from apatite (U-Th)/He
560
dating. Proc. 3rd INQUA-IGCP-567 Inter. Workshop Active Tectonics, Paleoseismology &
561
Archaeoseismology, 25-28.
562
Carignan, J., 1989. Caractérisations isotopiques (C, O, Sr, Pb) et genèse de filons épithermaux
563
associés au rift du Saint-Laurent. MS thesis, Université du Québec à Montréal, Quebec, Canada.
564
Carignan, J., Gariépy, C., Hillaire-Marcel, C., 1997. Hydrothermal fluids during Mesozoic
565
reactivation of the St. Lawrence rift system: C, O, Sr and Pb isotopic characterization. Chem.
566
Geol. 137, 1-21.
567
Carrillo-Rivera, J.J., Cardona, A., Edmunds, W.M., 2002. Use of abstraction regime and
568
knowledge of hydrogeological conditions to control high-fluoride concentration in abstracted
569
groundwater: San Luis Potosì basin, Mexico. J. Hydrol. 261, 24–47.
570
Castro, M.C., Goblet, P., 2005. Calculation of Groundwater ages – a Comparative Analysis.
571
Ground Water 43, 368-380.
572
Castro M.C., Ma L., Hall, C.M., 2009. A primordial, solar He-Ne signature in rcrustal fluids of a
573
stable continental region. Earth Planet. Sci. Lett. 279, 174-184.
574
Clark, I.D., Fritz, P., 1997. Environmental Isotopes in Hydrogeology. CRC Press, Boca Raton,
575
Florida, USA.
30
Cloutier, V., Lefebvre, R., Savard, M.M., Bourque, É., Therrien, R., 2006. Hydrogeochemistry
577
and groundwater origin of the Basses-Laurentides sedimentary rock aquifer system, St. Lawrence
578
Lowlands, Quebec, Canada. Hydrogeol. J. 14, 573-590.
579
Cloutier, V., Lefebvre, R., Savard, M.M., Therrien, R., 2010. Desalination of a sedimentary rock
580
aquifer system invaded by Pleistocene Champlain Sea water and processes controlling
581
groundwater geochemistry. Environ. Earth Sci. 59, 977-994.
582
Collins, J.F., Buol, SW., 1970. Effects of fluctuations in the Eh–pH environment on iron and/or
583
manganese equilibria. Soil Sci. 110, 111-118.
584
Eichinger, L., 1983. A contribution to the interpretation of 14C groundwater ages considering the
585
example of a partially confined sandstone aquifer: Radiocarbon 25, 347–356.
586
Environment Canada. 2014. Canadian climate normals 1961-2010
587
(http://climat.meteo.gc.ca/climate_normals/results_1981_2010_f.html?stnID=5426&autofwd=1).
588
Evans, G.V., Otlet, R.L., Downing, A., Monkhouse, R.A., Rae, G., 1979. Some problems in the
589
interpretation of isotope measurements in United Kingdom aquifers. In: Isotope Hydrology II.
590
International Atomic Energy Agency, Vienna, 679-708.
591
Fontes C.H., 1992. Chemical and isotopic constraints on 14C dating of groundwater. In: Taylor,
592
R.E., Long, A., Kra R.S. (Eds.), Radiocarbon dating After Four Decades: An Interdisciplinary
593
Perspective, Springer, New York, 242–26.
31
Garven, G., Ge, S., Person, M.A., Sverjensky, D.A., 1993, Genesis of stratabound ore deposits in
595
the midcontinent basins of North America. 1. The role of regional groundwater flow. Am. J. Sci.
596
293, 497-568.
597
Gilkeson, R.H., Perry, E. Jr., Cartwright, K., 1981. Isotopic and geologic studies to identify the
598
sources of sulfate in groundwater containing high barium concentrations. University of Illinois
599
Water Resour. Center Report 81-0165, 39 p.
600
Globensky, Y., 1987. Géologie des Basses-Terres du Saint-Laurent, Quebec. Ministère des
601
Richesses Naturelles du Quebec 63 (v. MM 85-02).
602
Globensky, Y., 1993. Lexique stratigraphique canadien. Volume V-B: région des Appalaches,
603
des Basses-Terres du Saint-Laurent et des Iles de la Madeleine. Ministère de l’Énergie et des
604
Ressources et Direction Générale de l’Exploration géologique et minérale, DV 91e23.
605
GRIES, 2011. Protocole de prélèvement d’échantillons d’eau souterraine pour le PACES. Juin
606
2010, 9 p.
607
Health Canada, 2014. Guidelines for Canadian drinking water quality: summary table. Federal–
608
Provincial–Territorial Committee on Drinking Water.
http://www.hc-sc.gc.ca/ewh-semt/water-609
eau/drink-potab/guide/index-eng.php
610
Heemskerk, A.R., Johnson, J., 1998. Tritium analysis: technical procedure 1.0. University of
611
Waterloo, Waterloo, Ontario, Canada.
32
Hem, J.D., 1972. Chemical factors that influence the availability of iron and manganese in
613
aqueous systems. Geol. Soc. Am. Bull. 83, 443-50.
614
Homoncik, S.C., MacDonald, A.M., Heal, K.V., Dochartaigh, B.E.O., Ngwenya, B.T., 2010.
615
Manganese concentrations in Scottish groundwater. Sci. Total Environ. 408, 2467-2473.
616
Hounslow, AW., 1995. Water quality data: Analysis and interpretation. CRC Press, Boca Raton,
617
Florida, USA.
618
Ingebritsen, S.E., Sanford, W.E., 1998 Groundwater in geologic processes. Cambridge University
619
Press. Cambridge, United Kingdom.
620
Kloppmann, W., Girard, J.P., Négrel, P., 2002. Exotic stable isotope compositions of saline
621
waters and brines from crystalline basement. Chem. Geol. 184, 49–70.
622
Lacasse, K., 2013. Caractérisation géochimique et isotopique des aquifères du sud-ouest de la
623
Mauricie. MS thesis, Université du Québec à Trois-Rivières, Quebec, Canada.
624
Lamarche, L., Bondue, V., Lemelin, J.-M., Lamothe, M., Roy, M., 2007. Deciphering the
625
Holocene evolution of the St. Lawrence River drainage system using luminescence and
626
radiocarbon dating. Quarter. Geochr. 2, 155-161. doi:10.1016/j.quageo.2006.04.002
627
Lamothe, M., St-Jacques G., 2014. Géologie du Quaternaire des bassins versant des rivières
628
Nicolet et Saint-François, Québec. Ministère Energies et Ressources Naturelles Report, 34 p.
629
Lamothe, M., 1989. A new framework for the Pleistocene stratigraphy of the central St.
630
Lawrence Lowland, southern Quebec. Géogr. Phys. Quarter. 43, 119–129.
33
Larocque, M., Gagné S., Tremblay L., Meyzonnat G., 2015. Rapport d’étape Phase III. Projet de
632
connaissance des eaux souterraines de la zone Nicolet et de la partie basse de la zone
Saint-633
François. Report presented to the MDDELCC, 261 p.
634
Lavoie, D., 2008. Appalachian Foreland Basin in Canada, In: Hsü, K.J., Miall, A.D. (Eds.),
635
Sedimentary Basins of the World, series ed. Sedimentary Basins of the World — USA and
636
Canada, vol. 5. Elsevier, Amsterdam, pp. 65-103.
637
Lavoie, D., Rivard, C., Lefebvre, R., Sejourne, S., Theriault, R., Duchesne, M.J., Ahad, J.M.E.,
638
Wang, B., Benoit, N., Lamontagne, C., 2013. The Utica Shale and gas play in southern Quebec:
639
geological and hydrogeological syntheses and methodological approaches to groundwater risk
640
evaluation. Inter. J. Coal Geol. 126, 77-91.
641
LECO Corporation, 2007. Carbon and Sulfur Determination – LECO Induction Furnace
642
Instruments. 48 pp.
643
Li, J., Wang, Y., Xie, X., Su, C., 2012. Hierarchical cluster analysis of arsenic and fluoride
644
enrichments in groundwater from the Datong basin, Northern China. J. Geochem. Explor.
645
doi:10.1016/j.gexplo.2012. 05.002.
646
Ma, L., Castro, M.C., Hall, C.M., Lohmann, W.M., 2005. Cross-formational flow and salinity
647
sources inferred from a combined study of helium concentrations, isotopic ratios and major
648
elements in the Marshall aquifer, southern Michigan. Geochem. Geophys. Geosyst., 6, Q10004,
649
doi:10.1029/2005GC001010.
34
Maclear, L. G. A., Adlem, M., Libala, M. B., 2003. Trend analysis of fluoride concentrations in
651
surface water and groundwater: 2000–2003. Coelga Devel. Co, Report 258047/6.
652
Machel, H.G., 2001. Bacterial and thermochemical sulfate reduction in diagenetic settings—old
653
and new insights. Sediment. Geol. 140, 143-175.
654
Mahlknecht, J., Steinich, B., Leon, I. N., 2004. Groundwater chemistry and mass transfers in the
655
independence aquifer, central Mexico, by using multivariate statistics and mass balance models.
656
Environ. Geol. 45, 781–795.
657
Marimon, M.P.C., Roisenberg, A., Suhogusoff A.V., Viero A.P., 2012. Hydrogeochemistry and
658
statistical analysis applied to understand fluoride provenance in the Guarani Aquifer System,
659
Southern Brazil. Environ. Geochem. Health. 35, 391-403.
660
Matsuda, J., Matsumoto, T., Sumino, H., Nagao, K., Yamamoto, J., Miura, Y., Kaneoka, I.,
661
Takahata, N., Sano, Y., 2002. The 3He/4He ratio of the new internal He Standard of Japan
662
(HESJ). Geochem. J. 36, 191-195.
663
McIntosh, J.C., Walter, L.M., 2005. Volumetrically significant recharge of Pleistocene glacial
664
meltwaters into epicratonic basins: Constraints imposed by solute mass balances. Chem. Geol.
665
222, 292-309.
666
McIntosh, J.C., Garven, G., Hanor, J.S., 2011. Impacts of Pleistocene glaciation on large-scale
667
groundwater flow and salinity in the Michigan Basin. Geofluids 11, 18-33.
35
MDDELCC, 2012. Stratégie de protection et de conservation des sources destinées à
669
l’alimentation en eau potable. Available at
670
http://www.mddelcc.gouv.qc.ca/eau/potable/strategie/strategie.pdf
671
Méjean, P., Pinti, D.L., Larocque, M., Sano, Y., 2015. Noble gas, carbon and nitrogen in a St.
672
Lawrence Lowlands bedrock aquifer (eastern Canada). Abstract 34178 presented at AGU Joint
673
Assembly, Montréal, QC, 3-7 May.
674
Meyzonnat, G., Larocque M., Barbecot, F., Gagné, S., Pinti, D.L., 2015. The potential of major
675
ion chemistry to assess groundwater vulnerability of a regional aquifer in southern Quebec
676
(Canada). Environm. Earth Sci., in press.
677
Mook, WG., 1972. On the reconstruction of the initial 14C content of groundwater from the
678
chemical and isotopic composition. In: Rafter, T.A., Grant Taylor, T. (Eds.), Proceedings of the
679
8th International 14C Conference. Wellington, Royal Society of New Zealand: 342-352.
680
Morgan, J.J., Stumm, W., 1965. The role of multivalent metal oxides in limnological
681
transformations, as exemplified by iron and manganese. In: Jaag O. (Ed.). Proc. Second Intern.
682
Conf. August 1964, Tokyo. Advances in Water Pollution Research, Pergamon Press. pp. 103-31.
683
Nickson, R.T., McArthur, J.M., Burgess, W.G., Ahmed, K.M., Ravenscroft, P. and Rahman, M.,
684
1998. Arsenic poisoning of Bangladesh groundwater. Nature 395, 338.
685
Ozima, M., Podosek, F.A., 1983. Noble Gas Geochemistry. Cambridge University Press,
686
Cambridge, United Kingdom.