UNIVERSITE DE
SHERBROOKE
Faculte de genieDepartement de genie civil
EMISSIONS D'AMMONIAC EN PROVENANCE
DES INFRASTRUCTURES AGRICOLES
Memoire de maitrise en environnement (volet recherche) Composition du juiy:
Daniel I. Masse (directeur) Roland Leduc (co-directeur) Suzelle Barrington
Richard Gagne (coordonnateur)
Library and Archives Canada Published Heritage Branch Bibliotheque et Archives Canada Direction du Patrimoine de I'edition 395 Wellington Street Ottawa ON K1A0N4 Canada 395, rue Wellington Ottawa ON K1A 0N4 Canada
Your file Votre reference ISBN: 978-0-494-91023-8 Our file Notre reference ISBN: 978-0-494-91023-8
NOTICE:
The author has granted a
non-exclusive license allowing Library and Archives Canada to reproduce, publish, archive, preserve, conserve, communicate to the public by
telecommunication or on the Internet, loan, distrbute and sell theses
worldwide, for commercial or non-commercial purposes, in microform, paper, electronic and/or any other formats.
AVIS:
L'auteur a accorde une licence non exclusive permettant a la Bibliotheque et Archives Canada de reproduire, publier, archiver, sauvegarder, conserver, transmettre au public par telecommunication ou par I'lnternet, preter, distribuer et vendre des theses partout dans le monde, a des fins commerciales ou autres, sur support microforme, papier, electronique et/ou autres formats.
The author retains copyright ownership and moral rights in this thesis. Neither the thesis nor substantial extracts from it may be printed or otherwise reproduced without the author's permission.
L'auteur conserve la propriete du droit d'auteur et des droits moraux qui protege cette these. Ni la these ni des extraits substantiels de celle-ci ne doivent etre imprimes ou autrement
reproduits sans son autorisation.
In compliance with the Canadian Privacy Act some supporting forms may have been removed from this thesis.
While these forms may be included in the document page count, their removal does not represent any loss of content from the thesis.
Conformement a la loi canadienne sur la protection de la vie privee, quelques
formulaires secondaires ont ete enleves de cette these.
Bien que ces formulaires aient inclus dans la pagination, il n'y aura aucun contenu manquant.
ABSTRACT
Gaseous ammonia emissions from livestock production are a well known source of anthropogenic ammonia emissions and have been the subject of numerous studies in Western Europe and in the United States of America. They are deemed responsible for the acidification of ecosystems. Furthermore, ammonia emissions from intensive live-stock operations located in the vicinity of major cities induce favourable conditions for smog formation. Ammonia volatilization from manure also reduces its effectiveness as a fertilizer by reducing its nitrogen content, an important nutrient for plant growth. Certain technologies and structures exist to cover manure storage tanks in order to limit these ammonia losses to the atmosphere. Veiy few studies have been done in Canada where climate and manure management practices differ widely from those in Western Europe and in the United States of America. In this project, a measure-ment campaign was financed by Agriculture and Agrifood Canada on four commercial livestock production infrastructure to begin the development of national ammonia in-ventory.
Commercial dairy and swine manure storages covered by floating geomembranes were monitored for periods exceeding six months in the Eastern Townships of Que-bec. The swine manure storage emitted negligible amounts of ammonia, from 5.9 10~3 to 0.14 fig m~2 s"1 over the summer time. The dairy manure storage emitted more substantial amounts of ammonia when the manure surface was frozen in winter, from 1.9 to 16 ng- mr2- s_1 , then when unfrozen, 93 to 166 /ig- m~2 s_1. A structural dif-ference in the covering technology at the dairy manure storage rendered it less airtight than the swine manure storage. Therefore, the efficiency of a cover to limit ammonia emissions from manure is function of its air tightness. Ammonia emission rates from two tie-stall commercial dairy buildings were also monitored in the Eastern Townships of Quebec. Ammonia emission measurements done at building A during winter 2007 ranged from 3.77 to 6.80 g day-1 animal"1 while those performed at building B dur-ing summer 2007 were higher and ranged from 11.33 to 18.20 g • day-1 • animal-1. These values fall within the wide range of those published for Western Europe and the United States of America. However, unlike studies completed in Europe using simi-lar procedures, the methods used to measure gaseous ammonia concentrations and building ventilation flow rates in this study were validated in controlled environments.
KEY WORDS
Ammonia, Agriculture, Gaseous Emission, Daiiy housing, Manure storage, Geomem-brane, Ventilation
RESUME
Les productions d'elevage constituent la principale source d'emissions anthropiques d'ammoniac gazeux. Ces emissions sont responsables de l'acidification de plusieurs ecosystemes terrestres et aquatiques. De plus, les emissions d'ammoniac de produc-tions d'elevage situees pres des villes peuvent induire des condiproduc-tions favorables a la formation de smog. La volatilisation de rammoniac du lisier peut reduire la valeur fertilisante du lisier en diminuant sa teneur en azote, un nutriment essentiel pour la croissance des plantes. Certaines technologies de recouvrement des fosses existent afin de reduire ces pertes en azote. Les emissions ont fait l'objet de plusieurs etudes en Europe de l'Ouest et aux Etats-Unis d'Amerique. Par contre, tres peu d'etudes ont ete faites au Canada alors que nos pratiques de gestion des lisiers et notre climat different largement de ces derniers. Une campagne de mesure sur quatre infrastruc-tures d'elevage canadiennes a ete finance par Agriculture et Agro-Alimentaire Canada dans le but de commencer a batir un inventaire national canadien pour rammoniac.
Des fosses commerciales dans la region de l'Estrie recouvertes de geotextile, l'une contenant du lisier de pore et l'autre du lisier de bovin laitier, ont ete suivies pour des periodes superieures a six mois. La fosse de lisier de pore a emis des quantites negligeables d'ammoniac dans l'atmosphere pendant l'ete. Les emissions d'ammoniac du lisier de bovin laitier gele etaient entre 1.9 et 16 jig m~2 s"1 et etaient nettement superieures sur le lisier degele, soit 93 a 166 fig- m-2 s"1. La structure recouvrant la fosse de lisier de bovin laitier etait moins etanche que celle recouvrant la fosse de lisier de pore. Done l'efficacite d'une technologie de recouvrement d'une fosse a reduire les emissions d'ammoniac est fonction de son etancheite. Les emissions d'ammoniac de batiments d'elevages laitiers ont aussi ete suivies lors de cette etude. Le batiment A emettait en hiver 2007 entre 3.77 et 6.80 g jour"1 - animal-1 d'ammoniac alors que le batiment B en emettait plus a l'ete 2007, soit entre 11.33 et 18.20 g jour-1 • animal-1. Ces mesures se comparent a celles retrouvees dans la re-vue scientifique pour l'Europe et les Etats-Unis, qui se caracterisent par une grande variability. Les methodes utilisees lors de cette etude pour mesurer les taux d'emissions d'ammoniac des batiments etaient similaires a celles utilisees en Europe. Or, a l'instar des etudes europeennes, la precision des equipements utilises pour mesurer les taux de ventilation et les concentrations d'ammoniac dans cette etude ont ete evalues en milieu controle.
MOTS CLES
Ammoniaque, Agriculture, Emissions gazeux, Batiments d'elevage, Fosses a lisier, Geomembranes, Ventilation
ACKNOWLEDGMENTS
I wish to acknowledge the initiative and the financial support of GAPS (Information Gaps in Water Quality and Nutrients) from Agriculture and Agrifood Canada as well as le Fond Quebecois de la recherche sur la nature et les technologies (FQRNT) for awarding me a scholarship.
I would also like to mention the technical support of Robert Porter from ADI Limited (Fredericton, Canada) and Brennan Sisk from Geomembrane Technologies inc. (Fred-ericton, Canada). Furthermore, without the collaboration of the owners of the com-mercial farms having graciously supplied their infrastructures, Jean-Noel Groleau, Roberto Rodriguez and Marcel Roy, this project would not have been possible.
Lastly but not least, I would like to thanks the technical personnel at Agricul-ture Canada & Universite de Sherbrooke, Frederic Tremblay and Serge Berube, as well as my co-supervisors, Daniel Masse (Agriculture & Agrifood Canada) and Roland Leduc (Universite de Sherbrooke) for their cooperation and partnership throughout the project.
CONTENTS
1 Introduction 1
1.1 Nature and scope of the problem 1
1.2 Objectives 3
1.3 Documentation source 4
Chapter bibliography 4
2 Literature review 7
2.1 Physico-chemistry of ammonia volatilization 7
2.2 Methods 9
2.2.1 Ammonia concentration measurements in air 9
2.2.2 Ammonia reactivity 11
2.2.3 Ammonia emissions from buildings 12
2.2.4 Ammonia emissions from manure storages 13
2.3 Reported ammonia emission factors 14
2.3.1 Dairy livestock buildings 14
2.3.2 Manure storages 16
Chapter bibliography 18
3 Forematter on submitted articles 23
4 Ammonia emission rates from covered concrete manure tanks in Eastern
Canada 24
4.1 Abstract 24
4.2 Key words 24
4.3 Introduction 24
4.4 Literature review 25
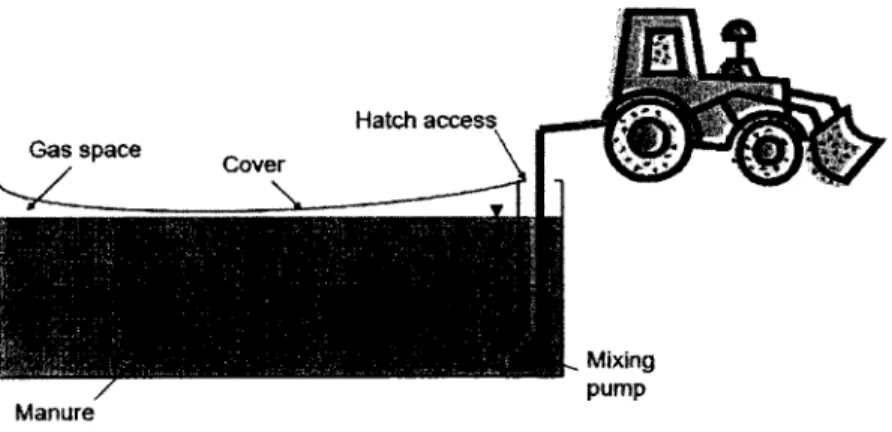
4.5 Materials and methods 26
4.5.1 Manure management description 26
4.5.2 Manure storage cover design 26
4.5.3 Manure gas production monitoring 28
4.5.4 Gas flow and ammonia concentration determination 29
4.6.1 Swine manure storage 31
4.6.2 Dairy manure storage 33
4.7 Conclusion 36
4.8 Acknowledgments 37
Article bibliography 37
5 Ammonia emission rates from dairy livestock buildings in Eastern Canada 39
5.1 Abstract 39
5.2 Key words 39
5.3 Introduction 39
5.4 Materials and methods 41
5.4.1 Building and dairy herd descriptions 41
5.4.2 Building ventilation measurements 42
5.4.3 Air sampling, ammonia and methane measurement systems .... 45
5.4.4 Precision evaluation of acid traps 46
5.4.5 Precision evaluation of ventilation measurements 47
5.5 Results and discussion 47
5.5.1 Precision of ventilation measurements 47
5.5.2 Precision evaluation of acid traps 48
5.5.3 Ammonia emission rates 49
5.6 Conclusion 53
5.7 Acknowledgments 54
Article bibliography 54
Conclusion 57
LIST OF FIGURES
1.1 World atmospheric ammonia emissions [Aneja et al., 2001] 2
2.1 Chemical structure of ammonia 11
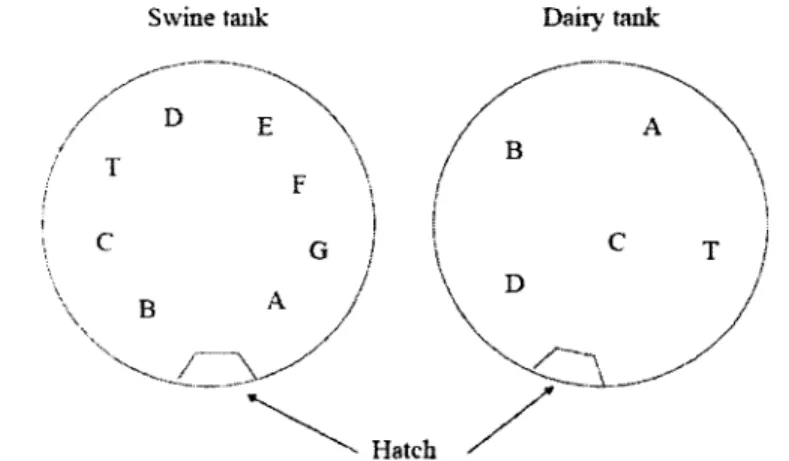
4.1 Photograph of the manure storage tank at the dairy farm 27 4 .2 Profile view of manure access hatch on covered manure storages 27 4.3 Location of manure sampling ports, thermocouple (port T) and hatch
ac-cess from a topview of the manure tanks 28
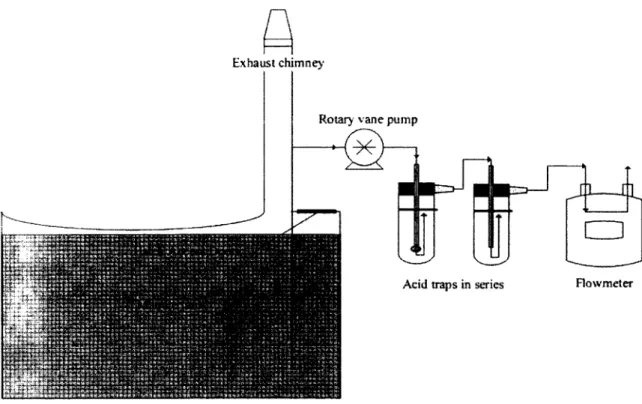
4.4 Process diagram of acid traps systems used at the swine facility 30 4.5 Manure temperature, manure height and ammonia emission rates at the
swine facility 33
4.6 Manure temperature, manure height and ammonia emission rates at the
dairy facility 34
4.7 Total ammonia as nitrogen concentrations of manure surface at the dairy
facility in mg L"1 35
5.1 Location of inlet and outlet air samples at building A 43 5.2 Location of inlet and outlet air samples at building B 43
5.3 Ammonia emissions from building A during winter 49
LIST OF TABLES
2.1 LIVESTOCK PRODUCTION MANAGEMENT PRACTICES AFFECTING TO
AMMONIA EMISSIONS 7
2.2 METHOD DESCRIPTIONS USED FOR DAIRY LIVESTOCK BUILDING
STUD-IES 15
2.3 AMMONIA EMISSION FACTORS FOR DAIRY LIVESTOCK BUILDINGS . . 16 2.4 METHOD DESCRIPTIONS USED FOR MANURE STORAGE STUDIES ... 17
2.5 EMISSION FACTORS FOR MANURE STORAGE 18
2.6 AMMONIA EMISSION RATES FROM CONCRETE STORAGE TANKS [Gay
et al., 2003] 19
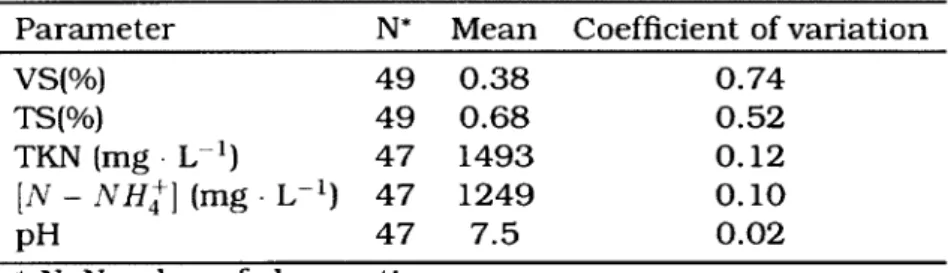
4.1 MEASURED PHYSICO-CHEMICAL PARAMETERS OF MANURE SURFACE
AT THE SWINE FACILITY 31
4.2 AMMONIA (NH3) EMISSION RATES FROM COVERED CONCRETE DAIRY
AND SWINE MANURE 32
4.3 VERTICAL PROFILE OF MANURE TEMPERATURE AT THE SWINE
FA-CILITY IN DEGREES CELSIUS 32
4.4 VERTICAL PROFILE OF MANURE TEMPERATURE AT THE DAIRY
FA-CILITY IN DEGREES CELSIUS 34
4.5 MEASURED PHYSICO-CHEMICAL PARAMETERS OF MANURE SURFACE
AT THE DAIRY FACILITY 36
5.1 NUTRITIONAL BREAKDOWN OF DAIRY FEEDS 42
5.2 AMMONIA TRAPPING MEASUREMENTS IN LABORATORY VALIDATION
TRIALS 48
5.3 NUMBER OF ANIMALS HOUSED IN BUILDING A 50
5.4 AMMONIA EMISSION FACTORS FOR BUILDING A DURING WINTER 2007
(FEBRUARY AND MARCH) 51
5.5 GASEOUS AMMONIA CONCENTRATION AND CORRESPONDING
VENTI-LATION MEASUREMENTS AT BUILDING B 52
CHAPTER 1
INTRODUCTION
1.1 Nature and scope of the problemAmmonia emissions in the atmosphere are known to have many adverse effects on the environment. Indeed, ammonia can react with nitrates and sulfates to produce ammonium nitrate and ammonium sulphates, molecules responsible for the formation of particulate matter less than 2.5 /jm in diameter (PM2.5) and in turn smog [Cadle,
1972], Furthermore, these molecules can travel great distances in the atmosphere prior to deposition in aquatic and terrestrial ecosystems, causing their acidification and loss of biodiversity [Bobbink et al., 1998; Erisman et al., 2000; Grennfelt et al., 1986]. Ammonia is also known to cause chronic lung diseases in humans frequently exposed to concentrations exceeding 25 ppm [Reglement sur la qualite du milieu de travail S-2.1 R.15, 2008].
Several activities allow ammonia inputs into the environment. Rhizobia living in symbiotic relationships with legume plants can fix atmospheric nitrogen into ammo-nia, a readily usable form for the plant. Ammonia can also be mass-produced by the Haber-Bosch combustion process in industrial applications JSutton et al., 2008]. In-deed, ammonia is used as a refrigerant due to its high latent heat of vaporization and it is also the main component in inorganic fertilizer, which warrants the mass pro-duction of ammonia [Sutton et al., 2008]. Ammonia is also a secondary pollutant of catalytic converter systems in gasoline engines [Heeb et al., 2008], However, the pro-cess that contributes the most to ammonia inputs in ecosystems is ammonification [Aneja et al., 2001]. Certain bacteria and fungi can decompose organic nitrogen into ammonium ions. This reaction is catalysed by ureases enzymes which are commonly found in soils and feces [Rotz, 2004]. This phenomena can also occur in concentrated feces and urine mixtures where urine provides readily hydrolisable urea and feces provide urease enzymes. This is why animal manure is the greatest contributor of gaseous ammonia emissions. This is observed in figure 1.1 which shows the relative contribution of several ammonia emission sources.
Livestock production is deemed to be the greatest contributor of anthropogenic am-monia emissions in Europe and Canada [ECETOC, 1994; Kurvits et al., 1998]. The european community has studied extensively ammonia emissions as a result of high acidification levels of their terrestrial and aquatic ecosystems located in zones with a high density of livestock productions. Several policies are already in place to
con-Fossil fuels, 3% Biomass combustion. 7% Soils. 21% Livestock manure, 45% Municipal waste: 6% Ocean surfaces, 18%
Figure 1.1: World atmospheric ammonia emissions [Aneja et al., 2001]
trol ammonia emissions in Europe [Erisman et al., 2008]. Certain legislations even provides for national emission ceilings to limit ammonia emissions, the greatest re-ductions being reported for the Netherlands, Denmark and the UK [Amann et al., 2000]. The goals fixed by the Gothenburg convention on long-range transboundary air pollution and the National Emission Ceilings Directive is expected to cost Eu-ropean countries two billion USD each year in administration fees and research & development [Hutchings et al., 2001].
Denmark is one of the rare countries able to establish ammonia emission factors typical of their agricultural practices because of the great number of studies performed in the country. Great variability in ammonia emission rates for either similar livestock production, manure handling practices or housing types was demonstrated through the exhaustive number of studies performed in Denmark [Hutchings et al., 2001]. This shows the necessity of elaborating emission factors specific to a given country by direct emission measurements.
Extensive information on ammonia emission levels for different livestock produc-tions are necessary for establishing accurate ammonia emission inventories and in
turn policy development. Ammonia volatilization from manure also reduces its fer-tiliser value. This nitrogen loss increases farming operation costs by the additional purchase of inorganic fertilizer.
In the United States, studies on ammonia have increased due to concern over loss of biodiversity and the health and well-being of farmers and their neighbours due to chronic and acute ammonia inhalation from livestock productions [Gay et al., 2003]. The animal industry in the USA is currently funding a 2-year large-scale measurement
program to characterize ammonia emissions from swine, dairy and poultry operations in several areas in the USA. The american Environmental Protection Agency (EPA) is providing guidance for this program, the National Air Emissions Monitoring Study (Aneja et al., 2007], An emission factor for ammonia is representative for a specific time period (season, month, etc.) and attempts to relate the quantity of ammonia emitted with an activity associated with its release: manure storage, treatment, han-dling or spreading. Emission factors typical of livestock productions are commonly expressed in the following units: kg NH3- animal-1 • year-1, kg NH3- AU-1 month-1, kg NHa- m-3 of manure per day, kg NH3 per ton of manure per month, fig NH3 • m-2 • s-1, kg NH3 m 2 of floor or manure surface per day. Ammonia emission factors currently used in Canada have not been derived from Canadian studies [Kurvits et al., 1998].
1.2 Objectives
The object of this master project is to establish ammonia emission factors from live-stock buildings and manure storages in Canada. This will increase the accuracy of the Canadian ammonia inventory. Also, new technologies are available on the mar-ket to limit nitrogen losses from manure storages such as geomembrane covers. The commercial manure storages studied were covered by geomembranes and located in Compton and St-Frangois-Xavier-de-Brompton; both towns located in the Eastern Townships county in the Province of Quebec. The storage in Compton contained dairy manure while the other in St-Frangois-Xavier-de-Brompton contained swine manure. Two tie-stall commercial daiiy barns in the same county were also retained for this study. Building A was located in Cookshire while building B was in Compton. The following tasks were completed:
• Modify existing measurement systems installed on livestock infrastructures for ammonia measurements:
• Evaluate performance and precision of equipment used for ammonia concentra-tion and building ventilaconcentra-tion rate measurements:
• Measure ammonia emission rates from two daiiy livestock buildings, one swine manure storage and one daiiy manure storage;
• Measure environmental parameters and manure physico-chemical characteris-tics that can influence ammonia emission rates;
• Compare measured ammonia emission rates to those reported in the literature in relation to measured environmental and manure physico-chemical character-istics.
Two scientific articles describing these tasks have been submitted to peer-reviewed journals. The article entitled Ammonia Emission Rates from Covered Concrete Manure
Tanks in Eastern Canada, accepted for publication in Transactions of the American
Society of Agricultural and Biosystems Engineers (ASABE), is presented in chapter 4. The article entitled Ammonia Emission Rates from Dairy Livestock Buildings in Eastern
Canada, submitted to Biosystems Engineering, is presented in chapter 5.
1.3 Documentation source
The main subject matter of this study is relevant to disciplines related to agricultural and bioressources engineering. Therefore, most of the documentation that was con-sulted consisted of published articles in peer reviewed journals in this field:
• American Society of Agricultural and Biosystems Engineers (ASABE) affiliated journals;
• The Institution of Agricultural Engineers (IAgrE) official publication, Biosystems Engineering, formerly known as the Journal of Agricultural Engineering Re-search;
• Several other journals related to air quality such as Atmospheric Environment, Environmental Pollution;
• Technical European reports [ECETOC, 1994] and normative standards [ANSI/ASHRAE 51-1999, 2000; APHA, 1992],
The Canadian Society of Agricultural and Biosystems Engineers also has an official publication but no commercial scale study such as this one has been completed in Canada. This is why most of the documentation found was relevant to American and European studies. The acquirement of such documentation was possible via the databases of Agriculture & Agrifood Canada.
Chapter bibliography
Amann, M. et Lutz, M. (2000). The revision of the air quality legislation in the Eu-ropean Union related to ground-level ozone, Journal of Hazardous Materials, vol. 78, n° 1-3, p. 41-62.
Aneja, V., Blunden, J., Roelle, P. A., Schlesinger, W. H., Knighton, R., Niyogi, D., Gilliam, W., Jennings, G. et Duke, C. S. (2007). Overview of the workshop on agricultural air quality: state of the science, Atmospheric Environment, vol. 42, n° 14, p. 3195-3208.
Aneja, V., Roelle, P., Murray, G., Southerland, J., Erisman, J., Fowler, D., Asman, W. et Patni, N. (2001). Atmospheric nitrogen compounds II: emissions, transport, transformation, deposition and assessment, Atmospheric Environment, vol. 35, n° 11, p. 1903-1911.
ANSI/ASHRAE 51-1999 (2000). Laboratory Methods and Testing Fans for Aerody-namic Performance Rating, Air Movement and Controal Association International Inc. and American Society of Heating and Air-Conditioning Engineers Inc.
APHA (1992). Standard methods for the examination of water and wastewater, Wash-ington USA, 18e edition, American Public Health Association.
Bobbink, R., Hornung, M. et Roelofs, J. (1998). The effects of air-borne nitrogen pollutants on species diversity in natural and semi-natural European vegetation,
Journal of Ecology, vol. 86, n° 5, p. 717-738.
Cadle, R. (1972). Formation and chemical reactions of atmospheric particles, Journal
of Colloid and Interface Science, vol. 39, n° 1, p. 25-31.
ECETOC (1994). Ammonia emissions to air in Western europe, Technical Report 62, European centre for ecotoxicology and toxicology of chemicals, Bruxelles.
Erisman, J., Bleeker, A., Hensen, A. et Vermeulen, A. (2008). Agricultural air qual-ity in Europe and the future perspectives. Atmospheric Environment, vol. 42, n° 14, p. 3209-3217.
Erisman, J. et De Vries, W. (2000). Nitrogen deposition and effects on European forests, Environmental Reviews, vol. 8, n° 2, p. 65-93.
Gay, S., Schmidt, D., Clanton, C., Janni, K., Jacobson, L. et Weisberg, S. (2003). Odor total reduced sulfur and ammonia emissions from animal housing facilities and manure storage units in Minnesota, Applied Engineering in Agriculture, vol. 19, n° 3, p. 347-360.
Grennfelt, P. et Hultberg, H. (1986). Effects of nitrogen deposition on the acidifica-tion of terrestrial and aquatic ecosystems, Water, Air, & Soil Polluacidifica-tion, vol. 30, n° 3-4, p. 945-963.
Heeb, N. V., Saxer, C. J., Forss, A.-M. et Bruhlmann, S. (2008). Trends of NO, NO2, and NH3 emissions from gasoline-fueled Euro-3- to Euro-4-passenger cars, Atmospheric
Hutchings, N., Sommer, S., Anderson, J. et Asman, W. (2001). A detailed emission inventory for Denmark, Atmospheric Environment, vol. 35, n° 11, p. 1959-1968. Kurvits, T. et Marta, T. (1998). Agricultural NH3 and NOx emissions in Canada,
Envi-ronmental Pollution, vol. 102, n° SI, p. 187-194.
Reglement sur la qualite du milieu de travail S-2.1 R. 15 (2008). Gouvernement du Quebec.
Rotz, C. (2004). Management to reduce nitrogen losses in animal production. Journal
of Animal Science, vol. 82, n° 13, p. 119-137.
Sutton, M., Erisman, J., Dentener, F. et Moller, D. (2008). Ammonia in the envi-ronment: From ancient times to the present, Environmental Pollution, vol. 156, n° 3, p. 583-604.
CHAPTER 2
LITERATURE REVIEW
2.1 Physico-chemistry of ammonia volatilizationAmmonia emissions from manure are prone to high spatial and temporal variabil-ity clue to the large number of factors involved in its volatilization. This affects the development of representative emission factors [Aneja et al., 2007]. The following en-vironmental and manure physicochemical parameters affect ammonia volatilization rates from livestock production infrastructures:
• Air temperature and air speed just over the manure surface [Kroodsma et al., 1993; Ni, 1999];
• Ionic charge, ammonia concentration, pH and temperature of manure [Ni, 1999; Arogo et al., 2003; Hafner et al., 2006].
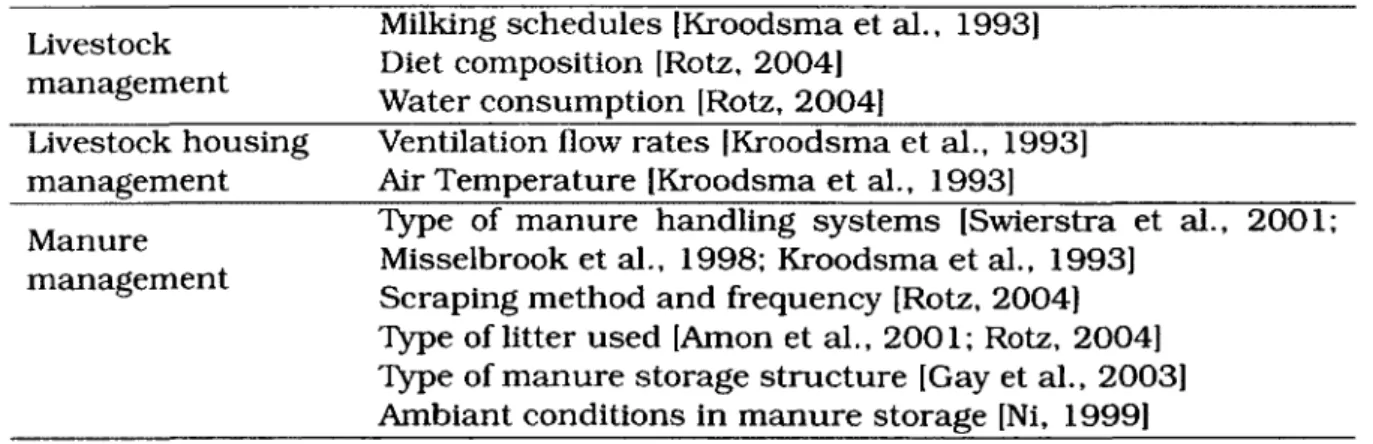
These physico-chemical parameters are influenced by livestock production and ma-nure management practices [Rotz, 2004]. These management parameters are listed in Table 2.1.
Table 2.1: LIVESTOCK PRODUCTION MANAGEMENT PRACTICES AFFECTING TO AMMONIA EMISSIONS
Livestock management
Milking schedules [Kroodsma et al., 1993] Diet composition [Rotz, 2004]
Water consumption [Rotz, 2004] Livestock housing
management Ventilation flow rates [Kroodsma et al., 1993] Air Temperature [Kroodsma et al., 1993] Manure
management
Type of manure handling systems [Swierstra et al., 2001; Misselbrook et al., 1998; Kroodsma et al., 1993]
Scraping method and frequency [Rotz, 2004] Type of litter used [Amon et al., 2001; Rotz, 2004] Type of manure storage structure [Gay et al., 2003] Ambiant conditions in manure storage [Ni, 1999]
Total ammonia (ammonia and ammonium) in manure available for volatilization depends on livestock nutrition. Livestock animals typically use less than 30% of the nitrogen they ingest, which leaves 50 to 80 % to be excreted in urine and 20 to 30% in feces. Variations depend on animal species or its life stage. Urea is the source of 97% of all nitrogen contained in urine [McCrory et al., 2001]. Transformation of urea into ammonium ions is dictated by ureie activity where urease enzymes contained in feces
can readily decompose the urea in urine. Several studies evaluated the reduction in ammonia emission rates from dairy barns by limiting contact between feces and urine such as using grooved floors for manure handling (Braam et al., 1999; Kroodsma et al., 1993; Misselbrook et al., 1998; Swierstra et al., 2001]. Housing animals over sloped grooved floors allows for urine to drain towards a collector while feces remain on the floor separate from the urine. Furthermore, ureic activity increases exponentially with increasing manure temperature. Complete conversion of urea into ammonium can occur in dairy buildings only within a few hours depending on indoor temperature and manure handling conditions. Ureic activity becomes negligeable at temperatures below 10°C [Rotz, 2004],
Ammonia present in feces as proteins can also be hydrolysed into peptides and amino acids and then deaminated into ammonia by proteolitic bacteria. This process of fecal ammonia mineralisation is done over periods of several months, therefore at a much slower rate than urea decomposition. Fecal ammonia mineralisation is considered insigni?cant during short-term manure storage [McCrory et al., 2001] but can become the dominant mode of ammonia volatilization for long-term storage over several months at warm temperatures [Rotz, 2004].
Once organic nitrogen is transformed into ammonium, the conversion of ammonium into gaseous ammonia in solution is a chemical equilibrium process dependent on pH, temperature and total ammonia concentration. Ammonia is a weak base that can react with water to produce its conjugate acid, ammonium, and hydroxide ions. The reverse reaction can also occur as shown in equation 2.1.
NH3 { a q ) + H20{ 1 ) ^ NHl( a g ) + OH-a q ) (2.1)
Higher pH or temperatures make the equation favor gaseous ammonia relative to ammonium [Snoeyink et al., 1980; Loehr, 1984]. The equilibrium constant that controls the reaction is the dissociation constant for ammonium, K^. At 25°C in an aqueous solution of ammonia in water, this constant is 5.6 • 10~10. At a pH above 9.3, [pKd = -logKd), ammonium ions will not be present in solution. The reverse reaction where an ammonium ion releases a proton to ammonia can also occur. The equi-librium constant controlling the latter is the alcalinity constant of ammonia, K^. At 25°C in distilled water, this constant is 1.8 • 10 5. For a pH below 4.7 {pKb = -logKb), gaseous ammonia in solution would be absent [Snoeyink et al., 1980]. Both con-stants are related to each other by the equation Kd x Kb = Kw = 10"14 at 25°C , or pKd + pKb = 14 according to logarithmic algebra. As for ammonia dissociation con-stants in manure, literature reviews shows the state of confusion in its experimental determination [Arogo et al., 2003; Hafner et al., 2006],
Lastly, the transfer of dissolved gaseous ammonia in manure towards ambient air is a chemical diffusion process through a liquid-gaz interface. Ammonia is highly volatile due to its low vapour pressure at ambient temperatures. When ammonia is drawn away from the manure surface by an ammonia-free air stream blowing over it, ammo-nia's partial pressure in air near the manure surface drops. This in turn stimulates subsequent convective ammonia transfer from the surface of the manure to ambient air. Therefore, the rate of ammonia desorption is highly dependent on environmen-tal conditions such as the speed and temperature of the air-stream blowing over the manure surface [Arogo et al., 1996; Ni, 1999]. One of the most popular theories to de-scribe ammonia diffusion through the surface of manure is the two-film theory based on Henry's law [Arogo et al., 1996; Ni, 1999], The ammonia mass transfer rate at the manure-air interface depends on the mass transfer rate through each individual film on each side of the interface, while it is assumed that no resistance is offered through the interface itself. The two-film theory implies that three steps occur dur-ing the ammonia mass transfer from the manure surface to the atmosphere. There is the convective transfer of ammonia from the air film at the manure-air interface towards the ambient atmosphere. This provokes a concentration gradient encourag-ing the diffusion of ammonia through both films, and in turn through the vertical manure profile, and such following Fick's Law of diffusion. These three steps com-plexify the volatilisation model for ammonia from manure [Ni, 1999]. An exhaustive review on mass transfer coefficients done by Ni [1999] demonstrated the confusion surrounding the application of developped equations for ammonia. Even though the great variability of ammonia mass transfer coefficients from manure surfaces, 11.7 •10~3 to 1.3 10~6 m/s, they are positively related to higher wind velocites and warmer temperatures. Furthermore, greater is the liquid-gaz interface, greater is ammonia volatilization from a given infrastructure. In this respect geometry of manure storages can have an effect on ammonia volatilization rates for a given site.
2.2 Methods
2.2.1 Ammonia concentration measurements in air
Several equipments are available to measure ammonia concentrations from a stream of air [Alex et al., 2003; Phillips et al.. 2001]:
• Non-dispersive infrared analyzers; • Chemiluminescence;
• Electrochemical cells; • Acid traps;
• Colorimetric tubes.
From this non-exhaustive list, the first three can be used for continuous measure-ments since a digital or analogue signal can be produced and recorded. The two last methods provide an average ammonia concentration measurement during the whole sampling period. A detailled description of infrared analyzers, acid traps and celec-trochemical cells will be given in the following paragraphs since these equipments are available for this study.
A non-dispersive infrared analyzer comprises of a source emitting radiation between
2.5 and 25 fim in wavelength, an absorption chamber and a radiation detector. Gas concentration measurement for a given gaz is related to its caracteristic amount of ab-sorbed radiation over a caracteristic spectrum. These instruments are best suited to detect a given gaz within a mixture of several non homonuclear gases. With advances in narrow band optical filters, photo-acoustic techniques and automatic compensation for water vapour and carbon dioxyde, non dispersive infrared analyzers now have a de-tection limit of 0.2 ppm for ammonia [Phillips et al., 2001]. This equipment's advantage is its robustness. They can be used over long periods of time without maintenance. However, they are prone to deterioration when in contact with dust and condensation. Therefore air streams to be analysed may require conditionning. Since ammonia is a highly reactive gaz, dust filtering before analysis may cause under-estimations in am-monia content measurements for a given air stream. Similarly, amam-monia can dissolve easily in condensed water vapour in the sampling tubing. Heber et al. [2001] pointed out the importance of maintaining the air sampling tubing approximately 3 °C warmer than the air samples so to avoid condensation within the lines and of changing dust filters regularly to limit dust accumulation within the sampling system.
Ammonia concentration can also be determined in the field by having an air stream sample pass through an acid solution at a measured flow rate over a recorded time period. The acid solution can then be analysed in the laboratory for total ammonia concentrations by several methods: colorimetric tubes, selective diodes or by titration. The advantages of this method is that it is precise, cheap and accounts for adsorbed dust and dissolved water vapour. However, as specified earlier, this method can only yield the average concentration over the sampling period and is labour-intensive. To obtain representative measurements of ammonia concentrations in livestock buildings and manure storages, long sampling periods are required.
Electrochemical cells are one of the most common methods to detect ammonia levels in air. They do not function well in cold temperatures and the detector often needs to be replaced [Alex et al., 2003]. Electrochemical cells consist of two or three electrodes
in an electrolyte solution consisting of electrochemically active reagents. The ammo-nia concentration in air is obtained by measuring the electric potential or current produced by the rate of ammonia passing through a membrane into the electrolyte filled cell. These modules are highly sensitive to sudden rises in ammonia levels and typically measure ammonia level exceeding 5 ppm (Phillips et al., 2001). This high sensitivity to sudden rises makes them useful for detector alarms.
2.2.2 Ammonia reactivity
The high reactivity of ammonia can cause errors when measuring ammonia concen-trations in air streams. The solubility of ammonia gaz in water is highly dependant on temperature. One volume of water at 0 °C can dissolve 1200 volumes of gaseous am-monia while 700 volumes are dissolved at 25°C (Rose, 2004). The chemical structure of ammonia, presented in figure 2.1, has a role in making it highly reactive. Hydro-gen atoms form the base of the pyramid and are linked to the nitroHydro-gen atom by polar covalent bonds. The high electro-negativity of nitrogen compared to hydrogen and its position at the apex of the pyramid creates a dipole moment. This is why ammonia can be highly adsorbant to several polymers, even teflon. Rose [2004] suggested that several studies regarding indoor air ammonia concentration measurements do not evaluate ammonia adsorptivity of gaz sampling systems. After completing several con-trolled laboratory experiments, Rose [2004] found that ammonia adsorbed at a higher rate to low density polyethylene tubing then to teflon, but ammonia adsorption still occured in teflon tubing at rates ranging between 2.2 and 51%.
••
N
107
H
Apart from polymers, gaseous ammonia can potentially adsorb to dust. Reynolds et al. [1998) compared several ammonia concentration measurement methods to evalu-ate those able to distinguish between gaseous ammonia and dust adsorbed ammonia. Filters were installed in-line with acid traps where the air stream to be analysed was conveyed. Filters were rinsed with an acid solution to measure ammonia adsorbed to dust. Comparing ammonia concentrations from both sources, adsorbed ammonia to dust may represent between 15 and 23% of total ammonia in the air sample.
Another study by Takai et al. [2002] suggests also that prefiltration of dust induces significant differences in the ammonia content measured in an air sample:
"The ammonia contents in inhalable dust varied from about 1 to 6 fig NH3 per mg of dust (1,000 to 6,000 ppm), while a content of about 7 pg NH3 per mg of dust (7,000 ppm) was found in respirable dust. These concentrations were from 100 to 1000 times higher than the typical aerial ammonia concentra-tions in livestock buildings. Filtration of dust from the air before gaz analysis or odor measurement is commonly practiced. However, the high ammonia con-tents seen in this study suggest that this process of dust filtration will cause not-negligible measuring error."
Considering dust concentrations measured by Takai et al. [2002] in livestock build-ings ranging between 0.02 and 2.50 mg • m ~3, concentrations of ammonia adsorbed to dust range from 1.3 x 10~3 to 6.4 x 10 3 ppm. This fraction associated with dust is negligeable relative to the gaseous fraction of ammonia contained in the air samples which varies between 3 and 35 ppm. The conflicting results of the studies performed by Takai et al. [2002] and Reynolds et al. [1998] indicate the need for subsequent studies on the matter.
2.2.3 Ammonia emissions from buildings
The mass balance approach is often used to measure emission rates from a building [Kinsman et al., 1995], To do so, ventilation flow rates and ammonia concentrations are measured at the inlets and outlets of the building. Two different approaches are commonly used to measure ventilation rates [Phillips et al., 2001]:
• Injection of tracer gaz;
• Sommation of air flows through all openings in the building.
The first method consists of injecting a tracer gaz in the building at a known flowrate, and measuring its concentration at several locations upstream and downstream of the source. Ventilation rates are then approximated. This approach assumes that air is
perfectly mixed within the building. This is the greatest source of imprecision for this method [Phillips et al., 2001].
The other method of summing airflows at all openings can be done with anemome-ters or differential pressure sensors. Indeed, near atmospheric pressure, air can be considered an incompressible fluid following Bernoulli's equations. Knowing the discharge coefficient of an opening and measuring the pressure diffential across the opening, perpendicular air flow rates can be determined. However, perfectly perpen-dicular air movements are rare in naturally-ventilated buildings [Phillips et al., 2001; Potter et al., 1997]. For the case of mechanically ventilated buildings, performance curves relating air flows to pressure differentials are often available for fans from the manufacturer. However, insertion effects and mechanical wear alter the shape of this curve in the field. A way to get around this is to install anemometers permanently on fans or natural ventilation openings. Numeric integration of the velocity profiles across the opening surface would yield a ventilation rate measurement. An anemome-ter measuring the average air velocity across the opening can also be used [Potanemome-ter et al., 1997; Phillips et al., 2001]. Several types of anemometers are available on the market: thermal, acoustic or mechanical-propeller [Potter et al., 1997], Acoustic and thermal anemometers are very precise in clean environments but are prone to mal-function in dusty environments such as livestock buildings. Mechanical propeller type anemometers are more robust but are more labour-intensive since they may require to be assembled and calibrated for specific applications to yield precise ventilation measurements.
2.2.4 Ammonia emissions from manure storages
The following methods to measure ammonia emission rates from manure storages are commonly used in the literature:
• nitrogen mass balance;
• ammonia flux from surfaces covered by an apparatus.
A pilot-scale study on nitrogen losses from manure storages completed in Canada used the nitrogen balance method [Patni et al., 1991]. Variations in nitrogen concen-trations in the manure itself recorded over time can be used to approximate indirectly ammonia emissions. However, sucessions of nitification and denitrification cycles can induce N2O emissions instead of ammonia emissions and this method can not dif-ferentiate between these two nitrogen losses. Also, this method is labour-intensive because of the great number of manure samples to handle to account for ammonia and nitrogen concentration spatial variations in the manure storage.
Several apparatus have been built to determine ammonia flux from a given surface. By placing the apparatus over a surface, measuring variations in ammonia concentra-tions of the air evacuated and the ventilation flowrate through the apparatus, a mass balance can be completed for that surface. Several variations of such apparatus have been described in the litterature. Different sensors can be used to measure ventilation rates and several air sampling systems can be associated to measure ammonia con-centrations. Both of the former have been described in preceding sections. At small scale, these apparatus can be used to repeat several times the same experiments to evaluate the effect of different treatments. Gay et al. [2003] for instance wanted to generate a database for future research and used this method to measure ammonia emission rates from several manure storages. The apparatus used only covered a surface area of 0.23 m2, causing great variabiliy in ammonia emission rates. Spatial variability in ammonia emission rates over a given manure storage surface area can be caused by several factors such as environmental conditions (sunlight and wind profiles) and fresh manure inlet location where total ammonia concentrations in the manure may be higher. Therefore, to measure ammonia emission rates representative of a given manure storage and climate, apparatus covering the totality of the manure storage must be used [Amon et al., 2001]. Such technologies are now available on the market in order to limit nitrogen losses from manure. For instance, covering a manure storage with an air-tight geomembrane, installing an evacuation duct mounted with an anemometer or flowmeter and allowing for gaz to be sampled regularly can provide a means to evaluate their performance for reducing ammonia volatilization.
2.3 Reported ammonia emission factors
Ammonia emission rates from livestock operations have been reported in the lit-terature for several countries. Even though most of them come from countries with different climates, livestock and manure management practices than those found in Canada, an exhaustive review of these studies are presented in this section.
2.3.1 Daiiy livestock buildings
None of the studies on dairy livestock buildings presented in tables 2.2 and 2.3 attempted to establish the precision of the methods and equipments used even though ammonia emission rates vary greatly between studies. For instance, Groot Koerkamp et al. [1998] published emission factors ranging from 314 mg • h-1 • animal-1 to 1245 mg - h-1 • animal-1 in dairy housing buildings when using an identical quantification methodology for all buildings.
Table 2.2:
STUDIES METHOD DESCRIPTIONS USED FOR DAIRY LIVESTOCK BUILDING Study Building and method description
Kroodsma et al. [1993] Groot Ko-erkamp et al. [1998J Demmers et al. [2001] Amon et al. [2001] Gay et al. [2003]1 Zhu et al. [2000] Rose [2004]1
Closed chamber approach was used continuously from Januray to June on a mechanically ventilated building. Ammonia concentra-tion was measured with a chemiluminescent analyser.
Closed chamber approach was used continuously from Januray to June on a mechanically ventilated building using straw as bed-ding material .inclubed-ding free-stall and tie-stall builbed-dings, therefore excluding slatted floor buildings where manure is stored under-neath floor. Ammonia concentration was measured with a chemi-luminescent analyser.
Trace gas method was used to measure ventilation rates from a nat-urally ventilated building with cubicles. The manure was handled by scraping the floors. Ammonia emission rates were measured con-tinuously for 5 months. The method was validated by releasing a known quantity of gas into the building while empty (recovery rate of 108%). They demonstrated that knowledge on discharge coefficients lacked in order to properly use differential pressure measurements on air inlets and outlets of naturally ventilated buildings in order to determine their ventilation flow rates .Ammonia concentration was measured with a chemiluminescent analyser.
Closed chamber approach was used for numerous 24-hour periods over the course of a year on a tie-stall barn containing 12 cows. A pre-calibrated anemometer was apposed to the only central exhaust fan of the building. Straw was used as bedding material and manure was mugged out twice a day. Micro-meteoorological methods were used.
Data was obtained by collecting air samples in Tedlar® bags while building flow rates were estimated by measuring pressure differ-ence across the fan and correlating them to flowrates obtained from the fans manufacturer's calibration curves. Ammonia concentration was determined with colorimetric tubes or acid traps.
Air samples were collected in Tedlar0 bags for 2 hour periods over a total of 12 hours (7am to 7 pm) in a naturally ventilated building where air flow rates were measured using CO2 balances. Ammonia concentration was measured with colorimetric tubes.
Emission factors were derived from an emission flux chamber ap-posed over one stall for several hours at a time. Ammonia concen-tration was measured with a chemiluminescent analyser.
1 The length of the experiments was not specified in the study
There is also a high temporal variability of ammonia emissions rates, demonstrating the relevance of regular air sampling over long time intervals [Amon et al., 2001; Heber et al., 2001]. In the Kroodsma et al. [1993] study for example, daily ammonia emission
rate profiles from a livestock building fluctuated up to 25% on a given day. In another study not described in tables 2.2 and 2.3, Harper et al. {2004] measured ammonia emission rates from a dairy livestock building during the daytime period and reported divergent emission rates to those done over a 24-hour period in the same building. Daytime period ammonia emission rate was on average 2.57 kg/animal-year while it was 3.36 kg/animal-year for the 24-hour period.
Studies by ]Gay et al., 2003], [Zhu et al., 2000] and [Rose, 2004] presented in tables 2.2 and 2.3 attempted to extrapolate ammonia volatilisation rates from a small surface to complete buildings. The number of animals housed in these buildings were for the most part unknown. Rose [2004] suggested from analysis of his results that a great spatial variability in ammonia emission rates existed within a building making it difficult to extrapolate measurements obtained from a small surface to the whole building. Indeed, because of high variations in temperatures, wind speeds near humid surfaces within the building, the ammonia flux from an area ranging between 0.1 and 1 m2 in size under a chamber can not properly represent the ammonia emission rate for the whole building [Kroodsma et al., 1993; Meisinger et al., 2001].
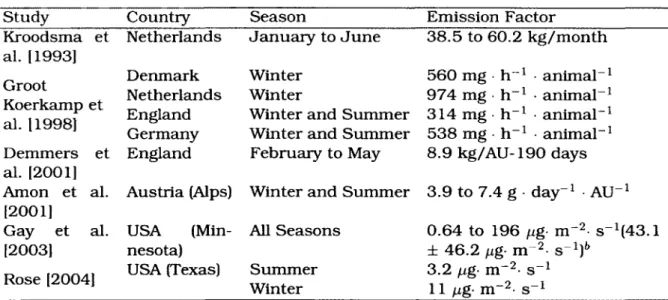
Table 2.3: AMMONIA EMISSION FACTORS FOR DAIRY LIVESTOCK BUILDINGS Study Kroodsma et al. [1993] Groot Koerkamp et al. 11998] Demmers et al. [2001] Amon et al. [2001] Gay et al. [2003] Rose [2004]
Country Season Emission Factor
Netherlands January to June Denmark Netherlands England Germany England USA (Min-nesota) USA (Texas) All Seasons Summer Winter 38.5 to 60.2 kg/month Winter Winter
Winter and Summer Winter and Summer February to May 560 mg 974 mg 314 mg 538 mg h-1 h-1 h"1 h"1 animal"1 animal"1 animal-1 animal-1 Austria (Alps) Winter and Summer
8.9 kg/AU-190 days 3.9 to 7.4 g day"1 AU" • s~ -l -l Ub 0.64 to 196 fig- m • s_1(43.1 ± 46.2 ng- m 3.2 fu,g- m-2- s 11 (Ug- m~2- s Mean± standard deviation
2.3.2 Manure storages
Certain technologies have been developed to reduce ammonia losses from manure storages by limiting the surface exposed to ambient air. Floating covers made out of natural or man-made materials (plastic, straw, oil) have been shown to reduce ammonia losses from 80 to 95 % [Rotz, 2004; Xue et al., 1999]. Permanent lids can
nearly eliminate ammonia storage losses when a appropriate seal is provided [Sommer et al., 1993]. Amon et al. |2006] showed for exterior pilot-scale concrete dairy manure storages in the Austrian Alps that a wooden lid reduced ammonia emission rates by 28% and 45% respectively during winter and summer conditions. Converting reported data from the Amon et al. [2006] study, ammonia emissions from the covered tanks ranged from 10 to 17 /xg- m 2 s1. Approximately 10 metric tons of manure was stored in each storage for periods of 100 to 140 days. Of the available studies on atmospheric ammonia emissions from agriculture in Western Europe, the Austrian Alps climate is the most similar to Canada's climate.
Tables 2.4 and 2.5 describe methods and results obtained in studies completed on dairy and swine manure storages. Geographically, the nearest extensive study to Eastern Canada on direct measurements of ammonia emission rates from manure storage found in the literature was in the state of Minnesota in the United States of America [Gay et al., 2003]. However, the measurements were taken over such different temporal and spatial scales that they are inapplicable for deriving Canadian emission factors. Furthermore, ammonia emission rate measurements in Minnesota showed great variations.
Table 2.4: METHOD DESCRIPTIONS USED FOR MANURE STORAGE STUDIES Study Manure and method description
Gay et al. 12003] Zahn et al. 12001] Patni et al. [1991] Amon et al.
[2006]
Measurements using a portable wind-tunnel covering 0.23 m2 of manure surface contained in concrete tanks. Hie ul-timate goal was to build an ammonia emission database for the state of Minnesota.
Over a dozen manure storages in Iowa were studied, rang-ing from concrete-lined basins to lagoons. Micrometeorology modelling was used for 24-hour periods while air samples were drawn thru acid traps. Surface areas of the manure storages studied were not specified.
Ammonia loss from airtight covered manure tanks was de-termined by following changes in total nitrogen and ammo-nia concentrations of the manure at several locations in the tanks over several weeks.
Ammonia emissions of each treatment (with and without wooden lid) were measured at least twice a week for several hours using an open dynamic chamber. The concrete circular tanks contained 10 m3 of dairy manure each and measured 2.5 m in diameter. Storage periods were 100 days in winter and 140 days in summer. Mean net total emission measure-ment periods were 450 h per treatmeasure-ment.
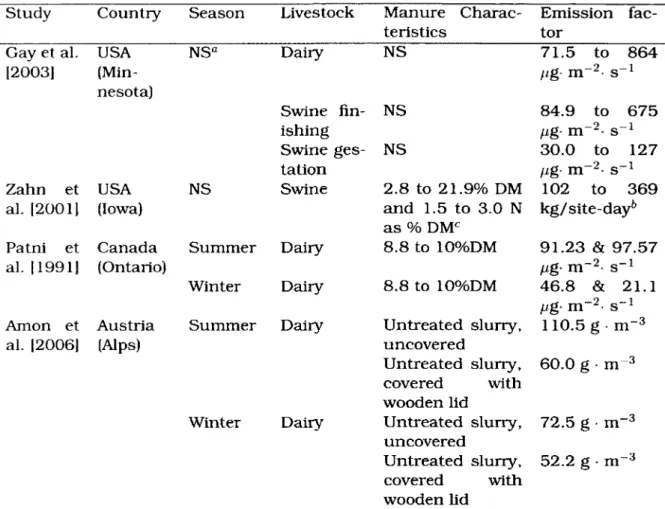
Table 2.5: EMISSION FACTORS FOR MANURE STORAGE
Study Country Season Livestock Manure Charac- Emission
fac-teristics tor
Gay et al. USA NSQ Dairy NS 71.5 to 864
[2003] (Min- fig- m~2 s_1 nesota) Swine fin- NS 84.9 to 675 ishing fig- m~2- s"1 Swine ges- NS 30.0 to 127 tation fig- m~2- s-1
Zahn et USA NS Swine 2.8 to 21.9% DM 102 to 369
al. [2001] (Iowa) and 1.5 to 3.0 N kg/site-day6
as % DMC
Patni et Canada Summer Dairy 8.8 to 10%DM 91.23 & 97.57
al. [1991] (Ontario) fig- m~2- s-1
Winter Dairy 8.8 to 10%DM 46.8 & 21.1
fig- m~~2- s_1 Amon et Austria Summer Dairy Untreated slurry, 110.5 g • m-3
al. [2006] (Alps) uncovered
Untreated slurry, 60.0 g • m~3 covered with
wooden lid
Winter Dairy Untreated slurry, 72.5 g • m~3 uncovered
Untreated slurry, 52.2 g • m-3 covered with
wooden lid a NS stands for not specified
h Emission rate measurements were respectively 102, 142, 233 et 369 kg/site-day for a deep pit, under a slatted floor, a circular concrete tank and 2 lagoons
c %DM stands for percentage of dry matter
Reading off table 2.5, for dairy slurry in concrete storages, ammonia emissions ranged from 21.1 to 864 fig- m~2 s"1 while for swine they ranged from 30.0 to 675 Hg- m 2 s_1. This stresses the importance for Canada to measure ammonia emission rates from local large-scale facilities over long time spans to derive representative emis-sion factors. Ammonia emisemis-sion rates from exterior manure storages have also been shown to differ greatly from one season to another [Amon et al., 2007]. Atmospheric temperatures in Canada can fluctuate from -35 to +35 °C over a year, indicating again the importance of seasonal measurements.
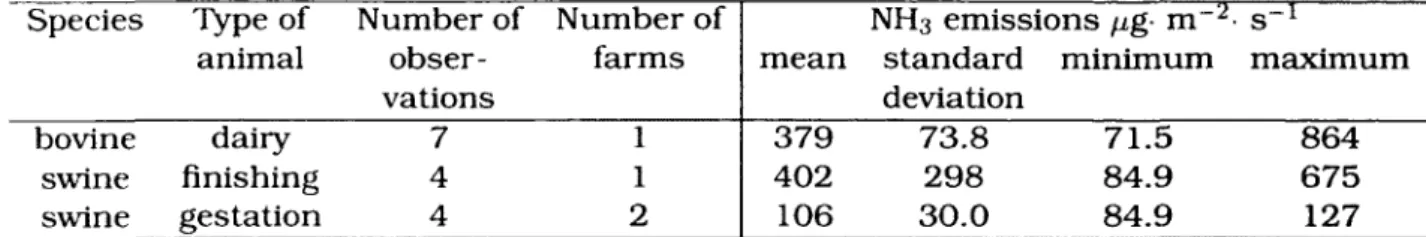
The breakdown of the measurements taken in the Gay et al. [2003] study is pre-sented in table 2.6.
Table 2.6: AMMONIA EMISSION RATES FROM CONCRETE STORAGE TANKS (Gay et al., 2003)
Species Type of Number of Number of NH3 emissions fig- m 2- s-1
animal obser- farms mean standard minimum maximum
vations deviation
bovine dairy 7 1 379 73.8 71.5 864
swine finishing 4 1 402 298 84.9 675
swine gestation 4 2 106 30.0 84.9 127
Chapter bibliography
Alex, S., Miousse, D. et Ponsard, B. (2003). La mesure de l'ammoniac s'affranchit de l'humidite, Vecteur Environnement, vol. 36, n° 5, p. 82-83.
Amon, B., Kryvoruchko, V., Frohlich, M., Amon, T., Pollinger, A., Mosenbacher, I. et Hausleitner, A. (2007). Ammonia and greenhouse gas emissions from a straw flow system for fattening pigs: Housing and manure storage. Livestock Science, vol. 112, n° 3, p. 199-207.
Amon, B., Th, A., Boxberger, J. et Alt, C. (2001). Emissions of NH3, N2O and CH4 from dairy cows housed in a farmyard manure tying stall (housing, manure storage, manure spreading), Nutrient Cycling in Agroecosystems, vol. 60, n° 1-3, p. 103-113. Amon, B., V.Kryvoruchko et Amon, T. (2006). Influence of different methods of covering slurry stores on green-house gas and ammonia emissions, International
Congress Series, vol. 1293p. 315-318.
Aneja, V., Blunden, J., Roelle, P. A., Schlesinger, W. H., Knighton, R., Niyogi, D., Gilliam, W., Jennings, G. et Duke, C. S. (2007). Overview of the workshop on agricultural air quality: state of the science, Atmospheric Environment, vol. 42, n° 14, p. 3195-3208.
Arogo, J., Day, D., Rikowski, G. et Christianson, L. (1996). Evaluation of mass
trans-fer coefficient of ammonia from liquid swine manure, Kansas USA, 1st international
conference on air pollution from agricultural operations, 8 p.
Arogo, J., Westerman, P. et Liang, Z. (2003). Comparing ammonium ion dissociation constant in swine anaerobic lagoon liquid and deionised water, Transactions of the
ASAE, vol. 46, n° 5, p. 1415-1419.
Braam, C. et Swierstra, D. (1999). Volatilization of ammonia from dairy housing floors with different surface characteristics. Journal of Agricultural Engineering
Demmers, T., Phillips, V., Short, L., Burgess, L., Hoxey, R. et Wathes, C. (2001). Val-idation of ventilation rate measurement methods and the ammonia emission from naturally ventilated dairy and beef buildings in the United Kingdom, Journal of
Agri-cultural Engineering Research, vol. 79, n° 1, p. 107-116.
Gay, S., Schmidt, D., Clanton, C., Janni, K., Jacobson, L. et Weisberg, S. (2003). Odor total reduced sulfur and ammonia emissions from animal housing facilities and manure storage units in Minnesota, Applied Engineering in Agriculture, vol. 19, n° 3, p. 347-360.
Groot Koerkamp, P., Metz, J., Uenk, G., Phillips, V., Holden, M., Sneath, R., Short, J., White, R., Hartung, J., Seedorf, J., Schroder, M., Linkert, K., Pederson, S., Takai, H., Johansen, J. et Wathes, C. (1998). Concentrations and emissions of ammo-nia in livestock buildings in Northern Europe, Journal of Agricultural Engineering
Research, vol. 70, n° 1, p. 79-95.
Hafner, S., Bisogni Jr, J. et Jewell, W. (2006). Measurement of un-ionized ammonia in complex mixtures, Environmental Science & Technology, vol. 40, n° 5, p. 1597-1602. Harper, L., Sharpe, R. et Simmons, J. (2004). Ammonia emissions from swine houses in the southeastern united states, Journal of environmental quality, vol. 33, n° 2, p. 449-457.
Heber, A., Ni, J.-Q., Haymore, B., Duggirala, R. et Keener, K. (2001). Air quality and emission measurement methodology at swine finishing buildings, Transactions of
theASAE, vol. 44, n° 6, p. 1765-1778.
Kinsman, R., Sauer, F., Jackson, H. et Wolynetz, M. (1995). Methane and carbon diox-ide emissions from dairy cows in full lactation monitored over a six-month period,
Journal of Dairy Science, vol. 78, n° 12, p. 2760-2766.
Kroodsma, W., Huis In't Veld, J. et Schoeltens, R. (1993). Ammonia emission and its reduction from cubicle houses by flushing, Livestock Production Science, vol. 35, n° 3-4, p. 293-302.
Loehr, R. (1984). Pollution control for agriculture, Orlando, Academic Press, 467 p. McCrory, D. et Hobbs, P. (2001). Additives to reduce ammonia and odor
emis-sions from livestock wastes: A review. Journal of Environmental Quality, vol. 30, n° 2, p. 345-355.
Meisinger, J., Lefcourt, A. et Thompson, R. (2001). Construction and validation of small mobile wind tunnels for studying ammonia volatilization, Applied Engineering
Misselbrook, T., Pain, B. et Headon, D. (1998). Estimates of ammonia emission from dairy cow collecting yards, Journal of Agricultural Engineering Research, vol. 71, n° 2, p. 127-135.
Ni, J. (1999). Mechanistic models of ammonia release from liquid manure: a Review,
Journal of Agricultural Engineering Research, vol. 72, n° 1, p. 1-17.
Patni, N. et Jui, P. (1991). Nitrogen concentration variability in dairy-cattle slurry stored in farm tanks. Transactions of the ASAE, vol. 34, n° 2, p. 609-615.
Phillips, V., Lee, D., Scholtens, R., J.A.Garland et Sneath, R. (2001). A review of methods for measuring emission rates of ammonia from livestock buildings and slurry or manure stores, PArt 2: monitoring flux rates, concentrations and airflow rates, Journal of Agricultural Engineering Research vol. 78, n° 1, p. 1-14.
Potter, M. C. et Wiggert, D. C. (1997). Mechanics of fluids, Upper Saddle River USA, 2e edition, Prentice Hall, 752 p.
Reynolds, S., Chao, D., Thorne, P., subramanian, P., Waldron, P., Selim, M., Whit-ten, P. et Popendorf, W. (1998). Field comparison of methods for evaluation of va-por/particle phase distribution of ammonia in livestock buildings. Journal of
Agri-cultural Safety and Health, vol. 4, n° 2, p. 81-93.
Rose, C. (2004). Development of an ammonia emission protocol and preliminary
emis-sion factor for a central Texas dairy. Master's thesis, A & M Texas University, College
Station Texas.
Rotz, C. (2004). Management to reduce nitrogen losses in animal production, Journal
of Animal Science, vol. 82, n° 13, p. 119-137.
Snoeyink, V. et Jenkins, D. (1980). Water chemistry, New York, John Wiley and Sons, 463 p.
Sommer, S., Christensen, B., Nielsen, N. et Schjrorring, J. (1993). Ammonia volatiliza-tion of cattle and pig slurry, effect of surface cover, Journal of Agricultural
Sci-ence, vol. 121, n° 1, p. 63-71.
Swierstra, D., Braam, C. et Smits, M. (2001). Grooved floor system for cattle hous-ing: ammonia emission reduction and good slip resistance, Applied Engineering in
Agriculture, vol. 17, n° 1, p. 85-90.
Takai, H., Nekomoto, K., Dahl, P., Okamoto, E., S.Morita et Hoshiba, S. (2002). Ammo-nia contents and desorption from dusts collected in livestock buildings, Agricultural
Xue, S., Chen, S. et Hermanson, R. (1999). Wheat straw cover for reducing ammonia and hydrogen sulphide emissions from dairy manure storage. Transactions of the
ASAE, vol. 42, n° 4, p. 1095-1101.
Zahn, J., Hatfield, J., Laird, D., Hart, T., Do, Y. et DiSpirito, A. (2001). Functional clas-sification of swine manure management systems based on effluent and gas emission characteristics, Journal of Environmental Quality, vol. 30, n° 2, p. 635-647.
Zhu, J., Jacobson, L., Schmidt, D. et Nicolai, R. (2000). Daily variations in odor and gas emissions from animal facilities, Applied Engineering in Agriculture, vol. 16, n° 2, p. 153-158.
CHAPTER 3
FOREMATTER ON SUBMITTED ARTICLES
Following the subject matter discussed in the previous sections, two scientific articles will follow suit in the following chapters:
• Ammonia Emission Rates from Covered Concrete Manure Tanks in Eastern Canada,
presented in chapter 4, accepted by Transactions of the American Society of Agri-cultural and Biosystems Engineers (ASABE);
• Ammonia Emission Rates from Dairy Livestock Buildings in Eastern Canada,
pre-sented in chapter 5, submitted to The Institution of Agricultural Engineers (LA-grE) official publication, Biosystems Engineering.
The authors were presented as follows to both journals:
• Claudia V. Bluteau, main author (claudia.bluteau@mail.mcgill.ca);
• Daniel I. Masse, corresponding author and co-author (massed@agr.gc.ca); • Roland Leduc, co-author, (roland.leduc@usherbrooke.ca).
Daniel I. Masse is a researcher with Agriculture and Agri-food Canada, Dairy and Swine Research and Development Center (2000 College Street, P.O. Box 90, Sher-brooke, Canada, JIM 1Z3). Roland Leduc is a professor in the department of Civil Engineering of Universite de Sherbrooke (2500 Universite Boulevard, Sherbrooke, Canada J1K 2R1). Claudia V. Bluteau is a graduate student that was affilated with both the latter.
The main objective in both articles was to measure ammonia emission rates for at least two seasons from commercial large-scale infrastructures. Several other pa-rameters were measured as a basis for comparison to other studies available in the literature. Methodologies used for ammonia emission rate measurements are detailled in each article. The validation of the equipement developped to do so is also explained in the articles.
CHAPTER 4
AMMONIA EMISSION RATES FROM COVERED CONCRETE MANURE TANKS IN EASTERN CANADA
4.1 Abstract
Manure storage is a well known source of anthropogenic ammonia emissions and has been the subject of numerous studies in Western Europe and in the United States of America. However, climate and manure management practices differ widely in Canada. Commercial dairy and swine manure storages covered by floating geomem-branes were monitored for periods exceeding six months in Canada. The swine ma-nure storage emitted negligible amounts of ammonia, from 5.9 10"3 to 0.14 /vg- m~2 s_1 over the summer time, which is less than emission rates found in the literature for swine manure ranging between 45 and 875 /ig- m~2- s_1. The most substantial am-monia emissions at the swine facility occurred during manure mixing operations. A structural difference in the covering technology at the dairy manure storage rendered it less airtight than at the swine manure storage. The dairy manure storage emitted more substantial amounts of ammonia when unfrozen, 93 to 166 /ig- m~2- s_1, then when frozen during winter, 1.9 to 16 /xg- m~~2- s-1. These emission rates are lower in magnitude than values found in the literature for dairy manure which ranged between 10 and 864 /ig• m~2- s_1.
4.2 Key words
Ammonia, Agriculture, Emission rates, Geomembrane, Manure storage
4.3 Introduction
There is an increased concern about losses in biodiversity that can potentially occur due to atmospheric ammonia deposition on sensitive ecosystems [Fraser et al., 2007]. Over-fertilization of ecosystems by ammonia deposition has been shown to cause ter-restrial eutrophication and acidification of waterbodies and soils IHavlikova et al., 2008]. Furthermore, ammonia emissions from intensive livestock operations located in the vicinity of major cities induce favourable conditions for smog formation. Ammo-nia can react with nitrates and sulfates to produce ammonium nitrate and ammonium sulfate, these molecules being responsible for the formation of fine particulate matter and in turn smog ]Cadle, 1972].
Manure handling, storage and spreading on cropland are responsible for 74% of anthropogenic atmospheric ammonia emissions in the world lAneja et al., 2001], Live-stock production is deemed in Europe to be the most important source of ammonia in the atmosphere [ECETOC, 1994]. In Canada, data pertaining to ammonia emission rates from agricultural activities is very limited to date. Using reported data from Eu-rope, Kurvits et al. [1998] estimated that livestock production was responsible for 82% of Canada's national ammonia inventory. However, climate as well as typical livestock management practises differ greatly between Canada and Europe.
4.4 Literature review
Ammonia emissions from manure are prone to high spatial and temporal variability due to the large number of factors involved in its volatilization, which affects the de-velopment of appropriate emission factors [Aneja et al., 2007]. For instance, livestock manure management practices such as the type of litter used [Amon et al., 2001; Rotz, 2004], the type of manure storage structure [Gay et al., 2003], and ambient conditions surrounding the manure storage [Ni, 1999] have been shown to affect several manure characteristics involved in the ammonia volatilization process. The rate of ammo-nia desorption from manure is highly dependent on the ionic strenght, the ammoammo-nia concentration, pH and the temperature of manure [Arogo et al., 2003; Hafner et al., 2006; Ni, 1999]. Environmental conditions such as the velocity and temperature of the air-stream blowing over the manure surface can also affect ammonia volatilization rates [Arogo et al., 1999; Ni, 1999].
Geographically, the nearest extensive study to Eastern Canada on manure storage ammonia emission rates found in the literature was in the state of Minnesota in the United States of America [Gay et al., 2003]. However, the measurements were taken over such different temporal and spatial scales that they are inapplicable for deriving Canadian emission factors. Furthermore, ammonia emission rate measurements in Minnesota showed great variations. For dairy slurry in concrete storages, ammonia emissions ranged from 71.5 to 864 fig- m~2- s"1 while for swine they ranged from 84.9 to 675 fig- m~2- s-1.
Ammonia emission rates from exterior manure storages have also been shown to dif-fer greatly from season to season [Amon et al., 2007], Atmospheric temperatures in the location where this study took place in Canada can fluctuate from -35 to +35 °C over a year, indicating the importance of seasonal measurements.
Certain technologies have been developed to reduce ammonia losses from manure storages by limiting the surface exposed to ambient air. Floating covers made out
![Figure 1.1: World atmospheric ammonia emissions [Aneja et al., 2001]](https://thumb-eu.123doks.com/thumbv2/123doknet/3177909.90695/11.918.199.721.166.555/figure-world-atmospheric-ammonia-emissions-aneja-et-al.webp)
![Figure 2.1 Chemical structure of ammonia [Rose, 2004]](https://thumb-eu.123doks.com/thumbv2/123doknet/3177909.90695/20.918.211.465.725.909/figure-chemical-structure-ammonia-rose.webp)