OATAO is an open access repository that collects the work of Toulouse researchers and makes it freely available over the web where possible
Any correspondence concerning this service should be sent
This is an author’s version published in: http://oatao.univ-toulouse.fr/24133
To cite this version:
Tardieu, Simon and Mesguich, David and Lonjon, Antoine and Lecouturier, Florence and Ferreira, Nelson and Chevallier, Geoffroy and Proietti, Arnaud and Estournès, Claude and Laurent, Christophe
Nanostructured 1% silver-copper composite wires with a high tensile strength and a high electrical conductivity. (2019) Materials Science and Engineering A, 761. 1-8. ISSN 0921-5093
Nanostructured 1% silver-copper composite wires with a high tensile strength and a high electrical conductivity
Simon Tardieu, David Mesguich, Antoine Lonjon, Florence Lecouturier, Nelson Ferreira, Geoffroy Chevallier, Arnaud Proietti, Claude Estournès, Christophe Laurent PII: S0921-5093(19)30834-2
DOI: https://doi.org/10.1016/j.msea.2019.138048
Article Number: 138048 Reference: MSA 138048
To appear in: Materials Science & Engineering A Received Date: 23 January 2019
Revised Date: 14 June 2019 Accepted Date: 18 June 2019
Please cite this article as: S. Tardieu, D. Mesguich, A. Lonjon, F. Lecouturier, N. Ferreira, G. Chevallier, A. Proietti, C. Estournès, C. Laurent, Nanostructured 1% silver-copper composite wires with a high tensile strength and a high electrical conductivity, Materials Science & Engineering A (2019), doi: https:// doi.org/10.1016/j.msea.2019.138048.
This is a PDF file of an unedited manuscript that has been accepted for publication. As a service to our customers we are providing this early version of the manuscript. The manuscript will undergo copyediting, typesetting, and review of the resulting proof before it is published in its final form. Please note that during the production process errors may be discovered which could affect the content, and all legal disclaimers that apply to the journal pertain.
M
ANUS
CR
IP
T
AC
CE
PTE
D
Nanostructured 1% silver- copper composite wires with a high tensile strength and a high electrical conductivity
Simon Tardieua,b, David Mesguicha, Antoine Lonjona, Florence Lecouturierb, Nelson
Ferreirab, Geoffroy Chevalliera,c, Arnaud Proiettid, Claude Estournèsa,c, Christophe Laurenta*
a
CIRIMAT, Université de Toulouse, CNRS, Université Toulouse 3 Paul-Sabatier, 118 route de Narbonne, F-31062 Toulouse cedex 9, France.
b
Laboratoire National des Champs Magnétiques Intenses, EMFL, CNRS-INSA-UGA-UPS, Grenoble & Toulouse, France.
c
Plateforme Nationale CNRS de Frittage Flash, PNF2, Université Toulouse 3 Paul-Sabatier, 118 route de Narbonne, F-31062 Toulouse cedex 9, France.
d
Centre de Microcaractérisation Raimond Castaing, UMS 3623, Université de Toulouse, Espace Clément Ader, 3 rue Caroline Aigle, 31400 Toulouse, France
e‐mail addresses of all authors : [email protected] [email protected] [email protected] [email protected] [email protected] [email protected] [email protected] [email protected] [email protected]
M
ANUS
CR
IP
T
AC
CE
PTE
D
AbstractHigh-strength, high-conductivity silver-copper composite wires were prepared by powder metallurgy, spark plasma sintering and room-temperature wire-drawing. Silver nanowires were mixed with a commercial micrometric copper powder (1, 5 and 10 vol.% silver). The powders were consolidated by spark plasma sintering in cylinders, which served as
precursors for room temperature wire-drawing, producing samples of wires with
progressively decreasing diameters. The Vickers microhardness for the wires is higher than that for the cylinders, reflecting both densification and grain refinement. Investigation of the microstructure reveals that the silver nanowires are located at the grain boundaries of
ultrafine copper grains, elongated over several micrometers. The electrical resistivity and tensile strength were measured at 293 K and 77 K. The tensile strength is more than twice for the composite wires compared to the corresponding pure copper wires. Although higher tensile strengths are obtained using 5 vol.% Ag, the wires containing only 1 vol.% Ag offer the best combination of high strength (1100 ± 100 MPa at 77 K) and low electrical
resistivity (0.50 µΩ.cm). The 1 vol.% Cu composite wires compare favorably with Ag-Cu alloy wires containing about 20 times more silver.
Keywords
copper; silver; wire-drawing; nanostructured composites; mechanical strength; electrical resistivity.
M
ANUS
CR
IP
T
AC
CE
PTE
D
Declarations of interest: noneFunding
This research did not receive any specific grant from funding agencies in the public, commercial, or not-for-profit sectors.
M
ANUS
CR
IP
T
AC
CE
PTE
D
1. IntroductionCopper-based conductive wires are very widely used, but mechanically stronger and still weakly resistive wires could find utility in aerospace and power engineering as well as in materials for the production of high-field pulsed magnets over about 100 Teslas. Classical strengthening methods involve the preparation of nano-grained copper (Cu) specimens [1], alloying with elements such as silver or niobium [2, 3, 4] or combining with a different phase or material [2, 5]. However, the internal defects introduced by these methods, i.e. grain boundaries, stacking faults and dislocations, will increase electron scattering, resulting in a lower electrical conductivity. However, the combination of both high strength and high conductivity, originating from the blockage of dislocation motion by
low-electrical-resistivity coherent twin boundaries within submicron Cu grains, was reported for
electrochemically-deposited Cu films [6], nanotwinned bulk samples [7] and wires prepared using cryo-deformation [8]. A wire is usually prepared by a multi-step wire-drawing (WD) process. This is a severe plastic deformation method resulting in extreme straining, which induces grain refinement down to ultrafine size (about 200-500 nm) and a high density of point defects and dislocations, therefore leading to strengthening but also to a lower electrical conductivity. We have reported [9] a novel route minimizing the degree of grain refinement involved in the preparation of ultrafined-grained macroscopic wires, thus
minimizing defect formation. In this way, the Cu cylinder to be used as the wire precursor is prepared by spark plasma sintering (SPS) and the typical short sintering times allow for only limited grain growth, producing cylinders showing an ultra-fine microstructure, 10 times smaller than for conventional ones [9, 10]. Thus, the Cu wires prepared by
room-temperature WD of the so-obtained micrometer-sized grained cylinder show a very high ultimate tensile strength (UTS), high yield stress and high electrical conductivity. It was
M
ANUS
CR
IP
T
AC
CE
PTE
D
shown [11, 12] that carbon nanotube-copper (CNT-Cu) wires show a significantly higher UTS because of the high tensile strength of the CNTs, but also a lower conductivity, than the Cu wires, which could reflect a degraded electrical conductivity of the
acid-functionalized CNTs as well as electron scattering at the CNT/Cu interface. Therefore, it has been hypothesized that replacing CNTs as the one-dimension (1D) reinforcement element by a better electrical conductor such as silver nanowires (Ag NWs) might be a way to limit the increase in resistivity while still benefiting from the nanostructuration of the matrix and the 1D effect for reinforcement. As important increases in UTS had been obtained with very low proportions (0.5-1 vol.%) of carbon [11, 12], as is usually the case with nano-sized
reinforcement effects [13], it was further hypothesized that using low silver proportions would be sufficient. This would be less detrimental to the electrical conductivity of the sample. Moreover, because the matrix in these samples (Ag-Cu composites) is pure Cu, the resistivity might be lower than for Ag-Cu alloys.
2. Experimental procedure
2.1. Powders
The Ag NWs were prepared by reducing AgNO3 with ethylene glycol (160 °C, 1 h) in the
presence of poly (vinyl pyrrolidone) (PVP, Mw = 55 000 g/mol) [14]. All chemicals were
purchased from Sigma Aldrich. The PVP/AgNO3 initial ratio was equal to 3.51, which
produced Ag NWs 30-60 µm long with a 200-300 nm diameter [15]. The so-obtained Ag NWs were separated from residual Ag particles by repeated centrifugation (2000 rpm, 2 min each time), washed with ethanol and dispersed in ethanol using an ultrasonic bath for a short time. The copper powder (0.5-1.5 µm) was supplied by Alfa-Aesar. The Ag NW-Cu
M
ANUS
CR
IP
T
AC
CE
PTE
D
composite powders (1, 5 and 10 vol.% of Ag, i.e. 1.2, 5.8 and 11.5 wt.% of Ag) were prepared by pouring the appropriate amounts of Cu powder into the Ag NWs suspension in ethanol under sonication followed by evaporation in a rotary evaporator (80 °C). The composite powders were heated in flowing H2 (15 L/h) for 1 h to reduce any copper oxide
present at the surface of the Cu grains and also to obtain cohesive, pre-sintered powders because this was found to be favorable for the subsequent consolidation. The powders are heated at 2.5 °C.min-1 from room temperature to the maximum temperature (160, 230 and 280 °C for 1, 5 and 10 vol.% Ag, respectively), which was increased because a high Ag content in the powder is detrimental to the pre-sintering of the Cu grains.
2.2. Spark plasma sintering and wire-drawing
Typically, Cu and Ag-Cu cylinders with a diameter of 8 mm and a length of 30 mm were sintered by SPS (PNF²-Toulouse, Dr. Sinter 2080, SPS Syntex Inc., Japan) using 8.4 mm inner diameter WC/Co (93.5 wt.% WC and 6,5 wt.% Co) dies to resist the radial stresses exerted on the starting powder compact (approximately 50 mm high). A laminated sheet of graphitic paper (0.2 mm thick) was placed between the punch and the powder as well as between the die and the powder to avoid any interaction between them and thus facilitate the removal of the cylinder at the end of the sintering step. All traces of the graphitic paper were later removed by machining before starting the wire-drawing, because the presence of graphite could then cause breakage for small diameter wires. The SPS run was performed with a residual cell pressure lower than 10 Pa. The temperature cycle was established using the default pulse settings of the machine, 12 On : 2 Off. The temperature was controlled using a thermocouple introduced in a hole (1.8 mm diameter and 5 mm deep) drilled on the outer surface of the die. The sample is heated at 25 °C.min-1 from room temperature to 350
M
ANUS
CR
IP
T
AC
CE
PTE
D
°C and then at 50 °C.min-1 from 350 to the maximum temperature (600°C for pure Cu, 400 °C for 1 vol.% Ag, 500°C for both 5 and 10 vol.% Ag) where a 5-minute dwell is applied. An uniaxial pressure (25 MPa) is applied gradually during the first minute of the dwell and is maintained for 4 min. Cooling (100 °C.min-1) is applied down to room temperature and the pressure is gradually released during cooling. The 1 vol.% Ag sample was sintered at only 400 °C in order to avoid alloying with Cu because the Ag solubility limit in Cu at 400 °C, is below 0.1 wt.% whereas it is equal to about 1.1 wt.% (0.9 vol.%) at 500 °C. The samples are designated 1Ag-Cu/400, 5Ag-Cu/500 and 10Ag-Cu/500 hereafter. The cylinders were wire-drawn at room temperature through conical WC dies, in about 40 passes, to obtain wires with decreasing diameters down to 0.29 mm. Samples of wires were typically 700 mm or 1500 mm long.
2.3. Characterization
The powders and selected wires were observed by field-emission-gun scanning electron microscopy (SEM, JEOL JSM 6700F). Cylinders and wires were investigated by another field-emission-gun scanning electron microscope (SEM, JEOL JSM 7100 TTLS LV, operated at 10 kV) equipped with an electron backscattered diffraction (EBSD) camera (NordlysNano, Oxford Instruments) and energy dispersive X-ray spectrometer (EDS). The samples were prepared using a cross section polisher (JEOL IB-19510CP). The density of the cylinder and the 4 mm diameter wires was evaluated by Archimedes’ method. The electrical resistivity of wire samples (350 mm long) was measured at 293 K and 77 K using the four-probe method with a maximum current of 100 mA to avoid heating the wires. Microhardness was determined from indentation tests on flat surfaces obtained by polishing. Loading (1 N for 10 s at room temperature) was applied with a Vickers indenter (Shimadzu
M
ANUS
CR
IP
T
AC
CE
PTE
D
HMV M3). The distance between two successive indentations was 10 times the diagonal length of the indent and the reported microhardness values are the average of 5 tests or more. Tensile tests (INSTRON 1195 machine) were performed at 293 K and 77 K on 170 mm long wires. Precise stresses were measured by the stress gauge system (1000 N or 250 N, 1.6 x 10⁻⁵ m.s-1).
3. Results
3.1. Powders
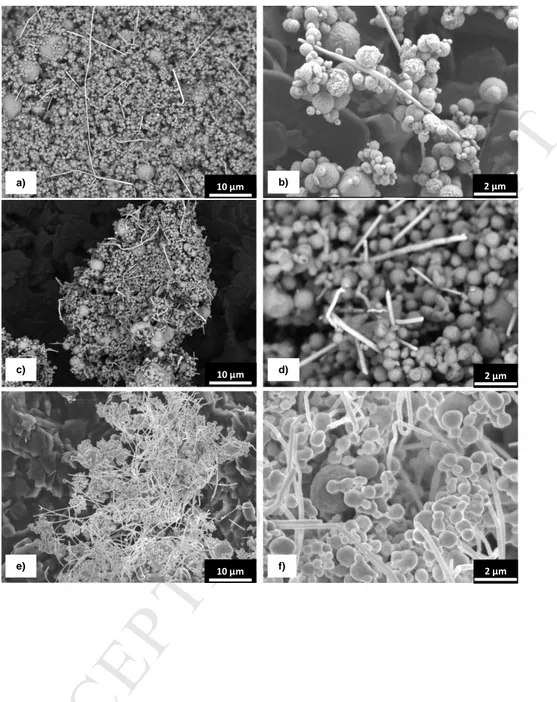
Typical SEM images (Fig. 1a, b) of the Ag-Cu powders show that the Ag NWs do not appear to have been massively damaged during the mixing steps, although some kinks and bends are observed along their length. The NWs are homogenously distributed among the spherical Cu particles for the 1 vol.% (Fig. 1a and 1b) and 5 vol.% Ag-Cu powder (Fig. 1c and 1d). The 10 vol.% Ag-Cu powder (Fig. 1e and 1f) is less homogeneous. Note that some images were recorded in backscattered electron chemical composition mode to enhance contrast.
M
ANUS
CR
IP
T
AC
CE
PTE
D
Fig. 1 SEM images of the Ag-Cu powders containing (a, b) 1 vol.% Ag, (c, d) 5 vol.% Ag
and (e, f) 10 vol.% Ag. Some images were recorded in backscattered electron chemical composition mode. b) c) f) d) e) 10 µm 10 µm 2 µm 2 µm 2 µm a) 10 µm
M
ANUS
CR
IP
T
AC
CE
PTE
D
3.2. Microstructure of cylindersThe relative density of the cylinders is equal to 94 ± 2% for all samples. These values were found convenient for the rest of the study because it was observed that a non-negligible residual porosity does facilitate the deformation during the drawing step and in fact too-dense cylinders cannot be drawn without breaking. Earlier electron microscopy observations of similar Cu cylinders [9, 11, 12] have revealed that the Cu grains have not grown
significantly from the original size and contain some thermal twins and no preferential texture. These observations were confirmed by EBSD analysis of the 5Ag-Cu/500 cylinder. Cu and Ag have the same space group, 225 or (F m -3 m), but different face-centered-cubic (fcc) lattice parameters (aCu=0.361 nm and aAg=0.408 nm). As EBSD analysis is not very
sensitive to lattice parameters, a simultaneous EDS analysis was used in order to
discriminate phases. For grain reconstruction, a threshold misorientation angle of 5° was used. Resulting grains size map (5° misorientation) of the cylinder (Fig. 2a) shows fine grains (colored with shades of gray depending on the grains size, in Fig. 2b). Cu and Ag grains were colored in green and red, respectively (Fig. 2c). The corresponding size distribution, 0.5-2 µm for Cu (black histogram in Fig. 2d) and 0.3-0.7 µm for Ag (red histogram in Fig. 2d) reflects only little growth during SPS.
M
ANUS
CR
IP
T
AC
CE
PTE
D
Fig. 2 (a) EBSD grains size maps of the transverse section for the 5Ag-Cu/500 cylinder; (b)
the corresponding shades of gray depending on the grains size, from black (small grains) to white (coarse grains); (c) EBSD phase maps of the transverse section for the 5Ag-Cu/500 cylinder showing copper grains (green) and silver grains (red); (d) the corresponding grain size distribution for Cu (black) and for Ag (red); (e) EBSD phase maps of the transverse section for the 0.506 mm diameter wire; (f) the corresponding grain size distribution for Cu (black) and for Ag (red).
f) 5 µm c) 5 µm e) d) a) 5 µm b) 0 1 2 3 4 µm
M
ANUS
CR
IP
T
AC
CE
PTE
D
3.3. Microstructure of wiresThe 4 mm diameter wires are 99 ± 1% dense. The density is probably higher for lower-diameter wires but it is impossible to give a significant value because the very low mass of the sample causes a very large uncertainty on the result. It has been established [9, 11, 12] that such wires present a lamellar microstructure, i.e. elongated grains parallel to the WD direction, with Cu grains markedly elongated over several micrometers (up to about 20 µm) and presenting a relatively narrow lamella-width distribution [12]. The phase map of the cross-section of the 0.506 mm diameter 5Ag-Cu/500 wire (Fig. 2e) shows ultrafine Cu and Ag grains (colored in green and red, respectively, in Fig. 2e). The corresponding size distribution, 0.2-0.4 µm for Cu (black histogram in Fig. 2f) and 0.2 µm for Ag (red
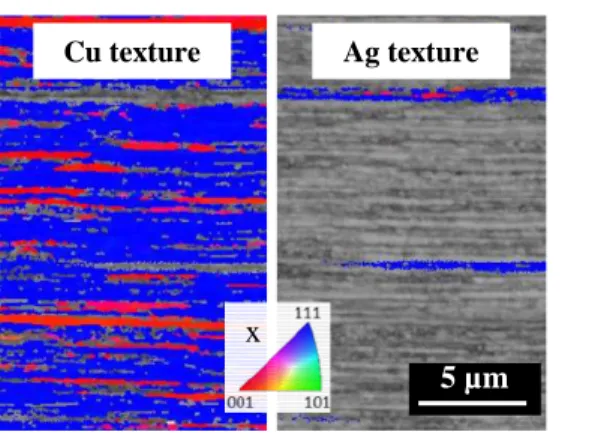
histogram in Fig. 2f) reflects the refinement of the microstructure compared to the cylinder (Fig. 2c). The longitudinal section of the 0.506 mm diameter 5Ag-Cu/500 wire was studied by EBSD (Fig. 3), showing for Cu (left panel of Fig. 3) and Ag (right panel of Fig. 3) the texture with two preferential orientations, <111> and <001>, characteristic of the wire drawing deformation of fcc metals.
M
ANUS
CR
IP
T
AC
CE
PTE
D
Fig. 3 EBSD inverse pole figure maps along the drawing direction for the 0.506 mm
diameter 5Ag-Cu/500 wire (observed in longitudinal section) showing the copper texture (left panel) and the silver texture (right panel).
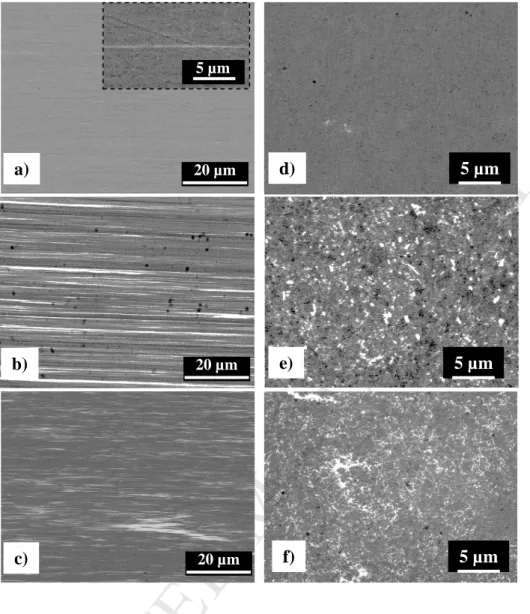
SEM images of the longitudinal sections of the 1 mm wires are shown in Figure 4. For 1Ag-Cu/400 (Fig. 4a and 4d), the sample appears to be homogeneous, with very weak white
contrasts reflecting Ag (inset in Fig. 4a). The Ag NWs, located along the Cu grain boundaries, are clearly observed for 5Ag-Cu/500 (Fig. 4b) and 10Ag-Cu/500 (Fig. 4c). There is some degree of agglomeration of the Ag NWs for the latter sample, which reflects the less homogeneous composite powder, as noted above. These results are confirmed by the observation of SEM images of the transverse sections of these wires (Fig. 4e and 4f).
Ag texture Cu texture
5 µm
M
ANUS
CR
IP
T
AC
CE
PTE
D
Fig. 4 SEM images of longitudinal sections of the 1 mm diameter wires recorded in
back-scattered electron mode: (a) 1Ag-Cu/400 (the inset is a higher magnification image), (b) 5Ag-Cu/500 and (c) 10Ag-5Ag-Cu/500; SEM images of the corresponding transverse sections: (d) 1Ag-Cu/400, (e) 5Ag-Cu/500 and (f) 10Ag-Cu/500.
20 µm b) 20 µm c) 20 µm 5 µm a) d) 5 µm e) 5 µm f) 5 µm
M
ANUS
CR
IP
T
AC
CE
PTE
D
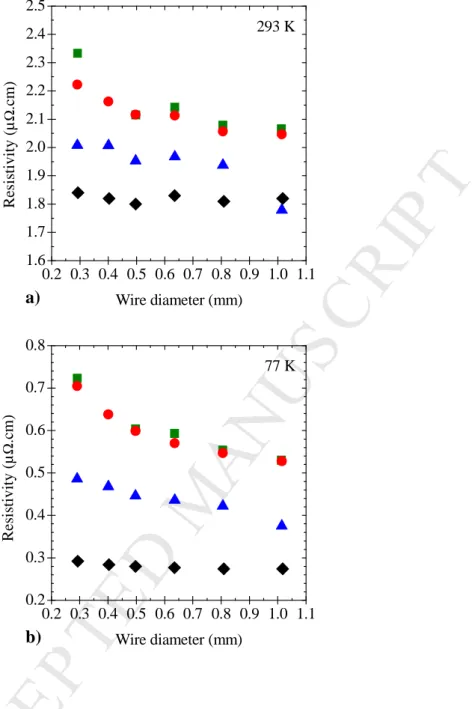
3.4. Electrical resistivityThe electrical resistivity of the samples is in the range 1.93-2.33 µΩ.cm at 293 K (Fig. 5a) and in the range 0.38-0.72 µΩ.cm at 77 K (Fig. 5b). The lower electrical resistivity values at 77 K can be explained by the negligible electron-phonon interactions at low temperature. These low resistivity values are suitable for high-field magnet applications because the coils used for the production of the pulsed magnetic field are operated in liquid N2 (77 K). The
electrical resistivity measured at 77 K increases slightly upon the decrease in wire diameter reflecting grain refinement and therefore the increase in the density of grain boundaries which acts as many scattering centers for conduction electrons. Compared to pure Cu, the effect is more pronounced for the Ag-Cu wires, which could reflect the contribution of the Ag/Cu interfaces to the scattering. The resistivity is increasing in the following order: Cu, 1Ag-Cu/400, then 5Ag-Cu/500 and 10Ag-Cu/500 similar to each other.
M
ANUS
CR
IP
T
AC
CE
PTE
D
Fig. 5 Electrical resistivity versus wire diameter at (a) 293 K and (b) 77 K for the different
wires: Cu ( ), 1Ag-Cu/400 (▲), 5Ag-Cu/500 ( ), 10Ag-Cu/500 ( ).
b) a) 0.2 0.3 0.4 0.5 0.6 0.7 0.8 0.9 1.0 1.1 1.6 1.7 1.8 1.9 2.0 2.1 2.2 2.3 2.4 2.5 R es is ti v it y ( µ Ω .c m ) Wire diameter (mm) 293 K 0.2 0.3 0.4 0.5 0.6 0.7 0.8 0.9 1.0 1.1 0.2 0.3 0.4 0.5 0.6 0.7 0.8 R e si st iv it y ( µ Ω .c m ) Wire diameter (mm) 77 K
M
ANUS
CR
IP
T
AC
CE
PTE
D
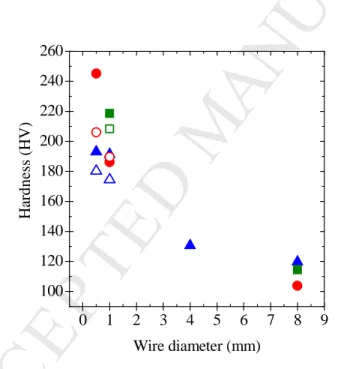
3.5 Mechanical propertiesThe Vickers microhardness (Fig. 6) for the different cylinders (noted as 8 mm wires in Fig. 6) is in the range 104-120 HV. For the 1Ag-Cu/400 wire 4 mm in diameter (only this one was tested), the microhardness is slightly higher and all values are significantly higher (180-245 HV) for the 0.5 mm wires, which could reflect both densification and grain refinement. The difference in microhardness between the longitudinal and transverse sections of the wires, the latter being slightly lower, reflects the anisotropy of the microstructure. The Ag content, however, does not seem to have any significant influence.
Fig. 6 Vickers microhardness versus wire diameter for the 1Ag-Cu/400 ( ), 5Ag-Cu/500 ( ), 10Ag-Cu/500 ( ) transverse section of wires and for 1Ag-Cu/400 ( ), 5Ag-Cu/500 ( ), 10Ag-Cu/500 ( ) longitudinal section of wires. Note that the 8 mm wires are termed the cylinders in the text.
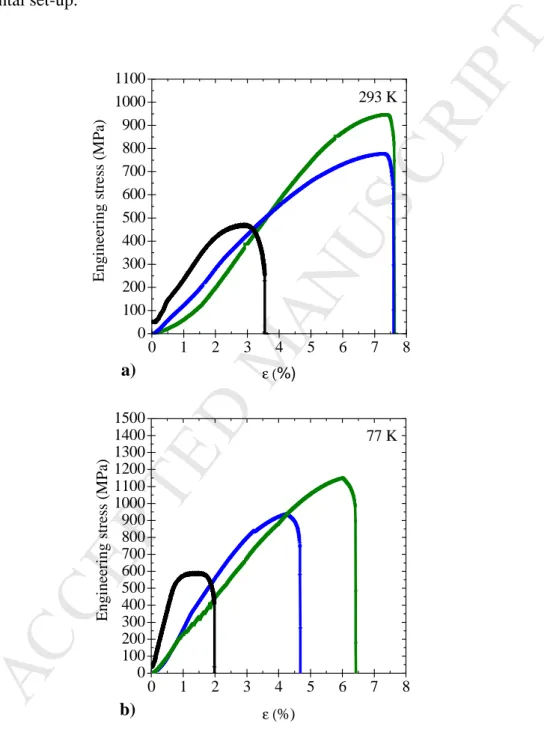
Stress-strain curves for the 0.506 mm diameter wires are shown in figure 7. During the tensile test, it was not possible to follow the strain with an extensometer due to the small diameter of
0 1 2 3 4 5 6 7 8 9 100 120 140 160 180 200 220 240 260 H ar d n es s (H V ) Wire diameter (mm)
M
ANUS
CR
IP
T
AC
CE
PTE
D
most wires and, in some cases, the testing itself being performed at 77 K. Strain was
determined from crosshead displacement without any correction of the machine rigidity and therefore, the wide elastic domain observed on the curves is an artifact originating in the experimental set-up.
Fig. 7 Stress-strain curves at (a) 293 and (b) 77K for the 0.506 mm diameter wires: Cu (─),
1Ag-Cu/400 ( ─), 5Ag-Cu/500 (─). a) b) 0 1 2 3 4 5 6 7 8 0 100 200 300 400 500 600 700 800 900 1000 1100 E n g in ee ri n g s tr e ss ( M P a) ε (%) 293 K 0 1 2 3 4 5 6 7 8 0 100 200 300 400 500 600 700 800 900 1000 1100 1200 1300 1400 1500 E n g in ee ri n g s tr es s (M P a) ε (%) 77 K
M
ANUS
CR
IP
T
AC
CE
PTE
D
Wires submitted to the tensile test show ductile fracture both at 293 K (Fig. 7a) and 77 K (Fig. 7b). The Cu wires show an obvious transition between the elastic domain and the plastic domain, whereas it is not clearly marked for the composite wires.
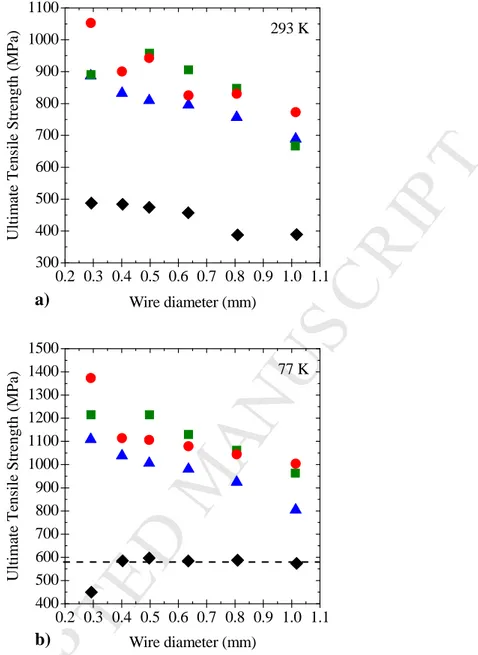
The UTS values at 293 K (Fig. 8a) and 77 K (Fig. 8b) both increase with decreasing wire diameters, which could reflect a progressively finer microstructure. The UTS for the Cu wires reached 450 ± 100 MPa at 293 K and 600 ± 100 MPa at 77 K, the latter higher UTS reflecting the reduced dislocation mobility at 77 K. The 1Ag-Cu wires show UTS values reaching 800 ± 100 MPa at 293 K (Fig. 8a) and 1000 ± 100 MPa at 77 K (Fig. 8b), whatever was the sintering temperature (400 or 500 °C). The 5Ag-Cu/500 and 10Ag-Cu/500 wires also show UTS values similar to each other, reaching 1000 ± 100 MPa at 293 K (Fig. 8a) and 1300 ± 100 MPa at 77 K (Fig. 8b). The values for the 1Ag-Cu wires are thus closer to those for the 5Ag-Cu and 10Ag-Cu wires than those for pure Cu, showing that an important part of the reinforcement is obtained for a fairly low Ag content. Note that the UTS at 77 K, 25-30% higher than those at 293 K, are particularly interesting if the wires are to be used at 77 K for some applications as noted above.
M
ANUS
CR
IP
T
AC
CE
PTE
D
Fig. 8 Ultimate tensile strength at (a) 293 K and (b) 77 K versus wire diameter for the Cu
( ), 1Ag-Cu/400 (▲), 5Ag-Cu/500 ( ), 10Ag-Cu/500 ( ) wires. The dashed line is a guide to the eye.
b) a) 0.2 0.3 0.4 0.5 0.6 0.7 0.8 0.9 1.0 1.1 300 400 500 600 700 800 900 1000 1100 U lt im a te T e n si le S tr en g th ( M P a) Wire diameter (mm) 293 K 0.2 0.3 0.4 0.5 0.6 0.7 0.8 0.9 1.0 1.1 400 500 600 700 800 900 1000 1100 1200 1300 1400 1500 U lt im at e T en si le S tr en g th ( M P a) Wire diameter (mm) 77 K
M
ANUS
CR
IP
T
AC
CE
PTE
D
4. DiscussionThe present Cu wires show a slightly lower resistivity than former ones (0.28 vs 0.32 µΩ.cm at 77 K) prepared by the same route [11, 12], which could reflect a change in Cu powder batch. Interestingly, the 77 K electrical resistivity of the present composite wires (0.38-0.60 µΩ.cm) is significantly lower than that reported for eutectic Ag-Cu alloy wires (0.71-0.81 µΩ.cm) containing about 20 times more silver than the present wires [2, 3, 4]. It was shown [9] that strengthening in the pure Cu wires originates not from the presence of coherent twin boundaries, which were not observed in the samples, but from the propagation of
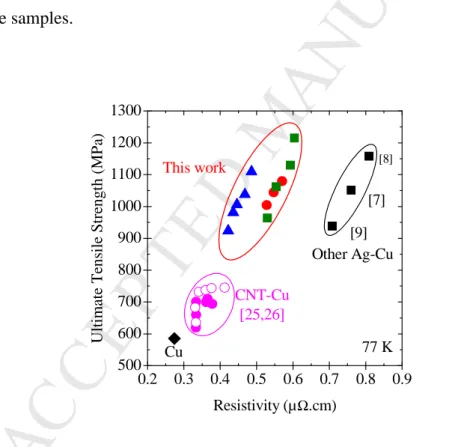
dislocations by an Orowan-type dislocation glide mechanism in grains smaller than 250 nm. The UTS for the present Ag-Cu composite wires are higher than those for the CNT-Cu composite wires prepared by the same route [11, 12]. They are similar to those reported for Ag-Cu alloy wires containing about 20 times more silver : at room temperature, 860 MPa for 24 wt.% Ag [2], 960 MPa for 25 wt.% Ag [3] and 750 MPa for 28 wt% Ag [4] and at 77 K, 1051 MPa for 24 wt.% Ag [2] and 1158 MPa for 25 wt.% Ag [3]. The present UTS are also similar or higher than the value reported for 5 wt.% Ag nanotwinned bulk samples prepared by dynamic plastic deformation at 77 K (870 MPa) [4]. This could be explained by the fact that the present samples benefit both from the presence of Ag NWs as a discrete, nanometric, second phase but also from the ultrafine microstructure of the Cu grains. As shown for other nanocomposite materials [13], nanometer-sized effects tend to rapidly saturate because increasing the content of the nanophase (here Ag NWs) in the sample provokes its agglomeration into larger grains, as shown above (Fig. 4), and the extra reinforcement provided by these (sub)micrometric grains is minor by comparison. Moreover, the UTS (77 K) versus electrical resistivity (77 K) plot (Fig. 9) allows one to observe that the present Ag-Cu composite wires show a better combination of properties than the other wires of Ag-Cu,
M
ANUS
CR
IP
T
AC
CE
PTE
D
Cu composites [11, 12] and 24-28 wt% Ag-Cu alloy [2, 3, 4]. Compared to the CNT-Cu composites, the differences could arise at least partly from the totally different nature of the CNT/Cu and Ag/Cu interfaces, which warrants further studies. Compared to the Ag-Cu alloy, the lower electrical resistivity could reflect the lower Ag content, notably the fact that the matrix is almost pure Cu because we use Cu composite powders, as opposed to Ag-Cu melted ingots, and would remain so because the diffusion at the Ag-Ag-Cu interface is probably negligible during the short SPS dwell (5 min). Interestingly, the composite sample containing only 1 vol.% (the 1Ag-Cu/400 wires) combine a high strength, similar to Ag-rich Ag-Cu alloy samples, with a much lower electrical resistivity than them, similar to CNT-Cu composite samples.
Fig. 9 Ultimate tensile strength at 77 K versus electrical resistivity at 77 K for a selection of
the present Cu ( ) and 1Ag-Cu/400 ( ), 5Ag-Cu/500 ( ), 10Ag-Cu/500 ( ) wires and other wires: CNT-Cu wires [11, 12] and Ag-Cu alloy wires (24-28 wt% Ag) ( ) [2, 3, 4]. Note that for [4] we have extrapolated the UTS value at 77 K by adding 25±5% to the room temperature value. 0.2 0.3 0.4 0.5 0.6 0.7 0.8 0.9 500 600 700 800 900 1000 1100 1200 1300 [9] [7] [8] U lt im at e T en si le S tr en g th ( M P a) Resistivity (µΩ.cm) Cu CNT-Cu [25,26] Other Ag-Cu This work 77 K
M
ANUS
CR
IP
T
AC
CE
PTE
D
5. ConclusionsComposite wires made up of Ag nanowires dispersed into a Cu matrix were prepared by room-temperature wire-drawing of cylinders consolidated by spark plasma sintering. It is shown that the wires containing only 1 vol.% Ag offer the best combination of high strength (1100 ± 100 MPa at 77 K) and low electrical resistivity (0.50 µΩ.cm) over samples
containing 5 and 10 vol.% Ag and even compare favorably with Ag-Cu alloy wires
containing about 20 times more silver. The composite wires show tensile strengths at 293 K and 77 K more than twice those for the corresponding pure Cu wires, due to the presence of the Ag nanowires located at the grain boundaries of ultrafine copper grains elongated over several micrometers, illustrating a nanometric-1D reinforcement effect. Moreover, using a very small proportion of Ag (1%) as a second phase (as opposed to alloyed with Cu), avoids an excessive increase of the electrical resistivity, reflecting only the presence of the Ag/Cu interfaces. Directions for further work include scaling up the method to benefit from the same properties of nanostructuration in higher-diameter, higher length wires.
Acknowledgements
Electron microscopy was performed at "Centre de microcaractérisation Raimond Castaing - UMS 3623" (Toulouse). The authors thank Dr. C. Josse, Dr. A. Weibel and Dr. G. Rikken for discussions.
Data availability: The raw/processed data required to reproduce these findings cannot be
M
ANUS
CR
IP
T
AC
CE
PTE
D
References[1] L. Lu, M.L. Sui, K. Lu, Superplastic extensibility of nanocrystalline copper at room temperature, Science 287 (2000) 1463–1466. https://doi.org/10.1126/science.287.5457.1463. [2] K. Han, J.D. Embury, J.R. Sims, L.J. Campbell, H.J. Schneider-Muntau, V.I. Pantsyrnyi, A. Shikov, A. Nikulin, A. Vorobieva, The fabrication, properties and microstructure of Cu– Ag and Cu–Nb composite conductors. Mater. Sci. Eng. A 267 (1999) 99–114.
https://doi.org/10.1016/S0921-5093(99)00025-8.
[3] K. Han, A. Baca, H. Coe, J. Embury, K. Kihara, B. Lesch, L. Li, J. Schillig, J. Sims, S. Van Sciver, H.J. Schneider-Muntau, Material issues in the 100 T non-destructive magnet. IEEE Trans. Appl. Supercond. 10 (2000) 1277-1280. https://doi.org/10.1109/77.828468. [4] X. Zuo, K. Han, C. Zhao, R. Niu, E. Wang , Microstructure and properties of
nanostructured Cu 28 wt%Ag microcomposite deformed after solidifying under a high magnetic field. Mater. Sc. Eng. A 619 (2014) 319-327.
https://doi.org/10.1016/j.msea.2014.09.070.
[5] V. Vidal, L. Thilly, F. Lecouturier, P.O. Renault, Cu nanowhiskers embedded in Nb nanotubes inside a multiscale Cu matrix: The way to reach extreme mechanical properties in high strength conductors. Scr. Mater. 57(3) (2007) 245-248.
https://doi.org/10.1016/j.scriptamat.2007.04.001.
[6] L. Lu, Y. Shen, X. Chen, L. Qian, K. Lu, Ultrahigh strength and high electrical conductivity in copper. Science 304 (2004) 422-426.
https://doi.org/10.1126/science.1092905.
[7] B.B. Zhang, N.R. Tao, K. Lu, A high strength and high electrical conductivity bulk Cu-Ag alloy strengthened with nanotwins. Scr. Mater. 129 (2017) 39-43.
M
ANUS
CR
IP
T
AC
CE
PTE
D
[8] A. Kauffmann, J. Freudenberger, H. Klauß, V. Klemm, W. Schillinger, V.S. Sarma, L. Schultz, Properties of cryo-drawn copper with severely twinned microstructure. Mater. Sci. Eng. A 588 (2013) 132-141. https://doi.org/10.1016/j.msea.2013.09.022.
[9] C. Arnaud, F. Lecouturier, D. Mesguich, N. Ferreira, G. Chevallier, C. Estournès, A. Weibel, A. Peigney, C. Laurent, High strength–high conductivity nanostructured copper wires prepared by spark plasma sintering and room-temperature severe plastic deformation. Mater. Sci. Eng. A 649 (2016) 209-213. https://doi.org/10.1016/j.msea.2015.09.122.
[10] K. Hanazaki, N. Shigeiri, N. Tsuji, Change in microstructures and mechanical
properties during deep wire drawing of copper. Mater. Sci. Eng. A 527 (2010) 5699–5707. https://doi.org/10.1016/j.msea.2010.05.057.
[11] C. Arnaud, F. Lecouturier, D. Mesguich, N. Ferreira, G. Chevallier, C. Estournès, A. Weibel, C. Laurent, High strength – high conductivity double-walled carbon nanotube - copper composite wires. Carbon 96 (2016) 212-215.
https://doi.org/10.1016/j.carbon.2015.09.061.
[12] D. Mesguich, C. Arnaud, F. Lecouturier, N. Ferreira, G. Chevallier, C. Estournès, A. Weibel, C. Josse, C. Laurent, High strength-high conductivity carbon nanotube-copper wires with bimodal grain size distribution by spark plasma sintering and wire-drawing. Scr. Mater. 137 (2017) 78-82. https://doi.org/10.1016/j.scriptamat.2017.05.008.
[13] Ch. Laurent, A. Rousset, Metal-oxide ceramic matrix nanocomposites, Key Eng. Mater. 108-110 (1995) 405-422. https://doi.org/10.4028/www.scientific.net/KEM.108-110.405 [14] Y. Sun, Y. Yin, B.T. Mayers, T. Herricks, Y. Xia, Uniform silver nanowires synthesis by reducing AgNO3 with ethylene glycol in the presence of seeds and poly(vinyl
pyrrolidone), Chem. Mater. 14 (2002) 4736-4745. https://doi.org/10.1021/cm020587b. [15] A. Lonjon, I. Caffrey, D. Carponcin, E. Dantras, C. Lacabanne, High electrically conductive composites of Polyamide 11 filled with silver nanowires: Nanocomposites
M
ANUS
CR
IP
T
AC
CE
PTE
D
processing, mechanical and electrical analysis. J. Non-Cryst. Solids 376 (2013) 199-204.