Impact of heterogeneous properties of soil and LNAPL on surfactant-enhanced capillary desaturation
Thomas Robert, Richard Martel, René Lefebvre, Jean-Marc Lauzon, Annie Morin
PII: S0169-7722(16)30330-8
DOI: doi:10.1016/j.jconhyd.2017.07.006
Reference: CONHYD 3318
To appear in: Journal of Contaminant Hydrology
Received date: 6 December 2016 Revised date: 7 July 2017 Accepted date: 24 July 2017
Please cite this article as: Thomas Robert, Richard Martel, René Lefebvre, Jean-Marc Lauzon, Annie Morin , Impact of heterogeneous properties of soil and LNAPL on surfactant-enhanced capillary desaturation. The address for the corresponding author was captured as affiliation for all authors. Please check if appropriate. Conhyd(2017), doi: 10.1016/j.jconhyd.2017.07.006
This is a PDF file of an unedited manuscript that has been accepted for publication. As a service to our customers we are providing this early version of the manuscript. The manuscript will undergo copyediting, typesetting, and review of the resulting proof before it is published in its final form. Please note that during the production process errors may be discovered which could affect the content, and all legal disclaimers that apply to the journal pertain.
ACCEPTED MANUSCRIPT
Impact of heterogeneous properties of soil and LNAPL on surfactant-enhanced capillary desaturation
Thomas Robert1*, Richard Martel1, René Lefebvre1, Jean-Marc Lauzon2, Annie Morin2
1Institut national de la recherche scientifique, Centre Eau Terre Environnement (INRS-ETE),
490 Rue de la Couronne, Quebec City, Quebec, Canada, G1K 9A9;
2TechnoRem Inc., 4701 Rue Louis B Mayer, Laval, Quebec, Canada, H7P 6G5;
ACCEPTED MANUSCRIPT
ABSTRACT
This paper investigates low-concentration (<1 wt%) surfactant flushing when used as a follow-up technology for multiphase vacuum extraction on heterogeneous sites. Challenges posed by soil permeability, pore-size distribution, mineralogy, light non-aqueous phase liquid (LNAPL) weathering and groundwater hardness were quantified through batch and soil column tests. Compatibility issues between the mixed mineralogy soils, hard groundwater, mixed LNAPL and usual anionic surfactants were observed. The selected solution was a Winsor type I system promoting an interfacial tension of 0.06 mN/m between the site LNAPL and the amphoteric surfactant CAS in aqueous solution at pH 12. Surfactant loses to adsorption and pore media plugging were observed in the fine soil fraction. The capillary desaturation curves (CDC) obtained with the column tests suggested mixed-wettability behavior. The soil permeability strongly influenced LNAPL recovery, as expressed by the relationship obtained between capillary numbers (NCa) and hydraulic gradients. In this case, the critical NCa, marking the onset
of capillary desaturation, could only be obtained with realistic hydraulic gradients in the coarse soil fraction. At those gradients, potential LNAPL recovery was 30 % at the most. Unlike previously published CDCs, the relationship between NCa (log-scale) and LNAPL recovery was
not linear but dependant on residual LNAPL saturation.
ACCEPTED MANUSCRIPT
1 INTRODUCTION
Multiphase vacuum extraction (MVE) is an efficient in situ remediation technology at light non-aqueous phase liquids (LNAPL) impacted sites 1. In the water-saturated zone, the MVE recovery efficiency reaches a limit when the LNAPL saturation becomes close to the residual oil saturation (SoR), and discontinuous LNAPL droplets are trapped in the soil pores by capillary
forces 2. Dewatering of the source zone coupled with LNAPL volatilization may increase LNAPL recovery, but this process is ineffective in the presence of heavier hydrocarbon products such as diesel 3. In such cases, the injection of aqueous-based chemical reagents in the saturated
part of the source zone are potential MVE follow-up technology 4-5. In particular, low-concentration (<1 % on a weight basis (wt%)) surfactant flushing could offer advantages over high concentration solutions used for micellar solubilization (3 to 8 wt%) 6, such as: cost savings on surfactants and other washing solution chemicals; the elimination of the need for reuse and recycling of surfactants; and simpler above-ground process effluent treatment. The technology could therefore be coupled with an existing MVE system and its process effluent treatment system.
The theory behind surfactant flushing applied to aquifer remediation has been studied at the laboratory scale 7-11 and also at the field scale 6, 12-14. Dwarakanath et al. 7 produced CDCs in the laboratory for two non-aqueous phase liquids (NAPLs) with alluvial aquifer material. These CDCs showed the practical implications of mixed-wet to oil-wet characteristics on NAPL recovery. They highlighted that NAPLs displacement from soils by water is more difficult for mixed-wet or oil-wet soils than for water-wet or weakly water-wet soils. Martel et al. 8 used a large sand column to characterize the main NAPL recovery mechanisms (mobilization and solubilization) of organic contaminants recovery by a complex chemical solution. Pennell et al. 9
ACCEPTED MANUSCRIPT
performed column experiments to investigate the onset and extent of tetrachloroethylene (PCE) mobilization during surfactant flushing. Their results are used later in this paper for comparison purposes. In Sabatini et al. 10, laboratory and field experiments are used to illustrate key technical and economic issues for surfactant flushing. They used a site-specific capillary curve to optimize the solubilization of denser-than-water NAPLs while avoiding mobilization and vertical migration. The laboratory research of Shiau et al. 11 identified surfactant systems capable of solubilizing and promoting microemulsions of chlorinated solvents.
In the field, Childs et al. 12 reported on a surfactant flushing for PCE removal at the Dover (DE) experimental site. The surfactant formulation achieved PCE micellar solubilization while avoiding downward migration. After 10 pore volumes of flushing, the overall PCE removal was 68%. Martel et al. 13 also demonstrated in the field the use of a surfactant solution to recover a dense NAPL in a five-spot injection/extraction pattern, while improving the sweep efficiency through the use of polymers. The relative importance of the recovery mechanisms, mobilization and solubilization was variable in the test cell. Finally, McCray et al. 14 summarizes remediation studies which were conducted Hill (UT) and Dover (DE) experimental sites, included technologies that mobilize, solubilize, and volatilize NAPL.
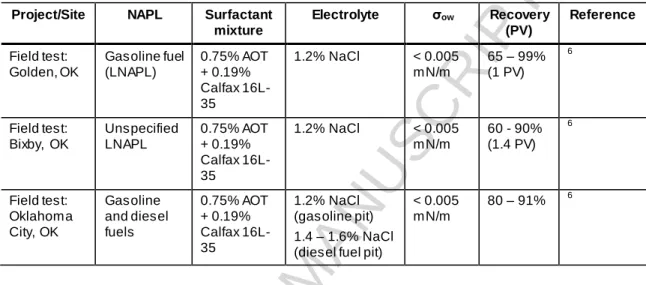
However, field applications of low-concentration surfactant flushing for LNAPL recovery are not widespread (Table ). For the study reported in this paper, based on the size of the LNAPL source zone covering more than 8000 m2, low-concentration surfactant flushing using concentrations below 1%-wt is the only economical alternative of surfactant flushing applicable to such a site. Low-surfactant concentrations do not favor micellar LNAPL dissolution or emulsion in the aqueous phase, and existing MVE effluent treatment systems such as air-liquid and oil-water separators, volatile organic compounds (VOC) catalytic oxidizer and granular
ACCEPTED MANUSCRIPT
activated carbon water treatment units can be used without modification in combination with this type of surfactant flushing. Shiau et al. 6 demonstrated through 3 field tests the potential of this
technology for residual LNAPL mass removal (Table 1).
Table 1. Documented case studies of low-concentration surfactant flushing.
Project/Site NAPL Surfactant mixture
Electrolyte σow Recovery
(PV) Reference Field test: Golden, OK Gasoline fuel (LNAPL) 0.75% AOT + 0.19% Calfax 16L-35 1.2% NaCl < 0.005 mN/m 65 – 99% (1 PV) 6 Field test: Bixby, OK Unspecified LNAPL 0.75% AOT + 0.19% Calfax 16L-35 1.2% NaCl < 0.005 mN/m 60 - 90% (1.4 PV) 6 Field test: Oklahoma City, OK Gasoline and diesel fuels 0.75% AOT + 0.19% Calfax 16L-35 1.2% NaCl (gasoline pit) 1.4 – 1.6% NaCl (diesel fuel pit)
< 0.005 mN/m
80 – 91% 6
Low-concentration surfactant flushing acts to dislodge residual LNAPL droplets and ganglia trapped in a porous medium through a combination of two co-occurring mechanisms: (1) capillary force reduction, which is proportional to the LNAPL-water interfacial tension (σow,
units of N/m) reduction caused by the surfactant, and (2) viscous force increase, which is proportional to the surfactant solution viscosity (µw, units of Pas) and specific flow rate (qw,
units of m/s). The relationship between NCa and the residual wetting or non-wetting phase
saturations in soil is called the capillary desaturation curve (CDC) 15. CDCs are presented on semi-log plots of percent residual saturation (normalized or not) versus capillary number. CDCs are characterized by a plateau at the initial residual saturation and low capillary numbers, a critical capillary number at which residual saturation starts to decrease (NCa*), and a total
ACCEPTED MANUSCRIPT
studied for enhanced oil recovery 16. Among other factors, the impacts of pore size, pore size distribution, rock mineralogy and oil residual saturations on CDC shapes were studied. It was reported that carbonates having a mixed wettability relative to water and crude oil exhibited larger NCa* (6×10⁻⁵) values than water-wet sandstone (2×10⁻⁵). Lake 15 mentions that the shape of the CDC depends on the width of the grain size distribution of the media, with wide distributions yielding a greater difference between NCa* and NCa** values.
Pennell et al. 9 demonstrated the use of the capillary number (NCa) concept to quantify these
forces acting during aquifer remediation. The relationship between NCa and the residual wetting
or non-wetting phase saturations in soil is called the capillary desaturation curve (CDC) 15. The
NCa definition used in this study is from Dwarakanath et al. 7: 𝑁𝐶𝑎 = 𝑞𝑤𝜇𝑤
𝜎𝑜𝑤 (1)
Previous studies on NCa and CDC 10-11, 17 highlighted the site-specific challenges of LNAPL
capillary desaturation enhanced by surfactant flushing. Figure 1 summarizes these challenges when considering surfactant flushing for heterogeneous source-zone remediation. At heterogeneous sites such as the one considered for this research, such challenges are summarized in the left column of Figure 1. The right column of Figure 1 presents anticipated impacts of these challenges on LNAPL recovery by capillary desaturation, which is characterized by CDCs, NCa*
ACCEPTED MANUSCRIPT
Figure 1. Site-specific challenges associated with heterogeneous materials and anticipated
effects on site-specific CDCs.
Another challenge related to the use of in-situ soil flushing is achieving contact between the surfactant solution and the LNAPL within a heterogeneous source zone. The use of shear-thinning polymers to promote horizontal flow uniformity in heterogeneous environments has been tested at various scales 13, 18-21. For this project, the impact of heterogeneous stratigraphy on micellar flow uniformity was evaluated with a field tracer test published in a companion paper 22.
The objective of this research is to assess the performance of a low-concentration surfactant solution in combination with an existing MVE system for the in-situ remediation in realistic
Poorly sorted soil widens the
NCa*- NCa** range
The mobilisation of fines causes
pore plugging
NCa* and NCa** increase in
carbonate rocks
Weathering causes viscosity increase, and NCa* NCa** increase
(LNAPL reduced mobility)
Surfactant loss to adsorption on carbonates Wide pore-size distribution LNAPL weathering Groundwater hardness Mixed mineralogy
Causes for the formation of
viscous macroemulsions
Causes for surfactant salt
precipitation
Low permeability limits the
enhancement of viscous
forces increasing NCa
Soil
permeability
ACCEPTED MANUSCRIPT
heterogeneous environments. In order to meet this objective, the challenges posed by soil permeability, pore-size distribution, mineralogy LNAPL weathering and groundwater hardness were quantified through batch and soil column tests. Laboratory batch experiments allowed to select an optimal surfactant solution considering soil-LNAPL-surfactant observed and measured interactions. Soil column experiments were conducted to construct site-specific capillary desaturation curves (CDCs) for grain size fractions representative of the stratigraphic layers encountered at the heterogeneous experimental site, using the surfactant solution.
The novelty of this experimental work is the quantification of the impacts of soil composition and heterogeneity on surfactant formulations, achievable capillary number (NCa) and CDCs. The
methodology presented in this paper is simple to implement and allows to measure the performance of low-concentration surfactant flooding under site-specific conditions, provided that the experiments are conducted with soil and LNAPL from that experimental site.
2 EXPERIMENTAL METHODS
A composite soil sample obtained from borehole drill cuttings was used for column experiments. Soil sieving was done on the composite sample in order to study the impact of 3 grain-size distributions on LNAPL residual saturations and recovery. Two columns were prepared for each grain size distribution so that each was tested in duplicates.
Grain size analysis was performed in-house with dry sieving down to 0.125 mm. Fractions finer than 0.125 mm were characterized with a Analysette 22 laser particle sizer (Fitsch, Germany) performed on humid samples. The grain size distribution was assessed by calculating the uniformity coefficient (CU) for each sample, which is dependent on the grain sizes
ACCEPTED MANUSCRIPT
Mineralogy analysis was determined on the finer than 0.125 mm fraction of selected representative samples with X-ray diffraction mineralogy analysis using the semi-quantitative Rietveld method at the UQAT laboratories located in Rouyn-Noranda (Qc). Organic carbon content was measured in 3 composite soil samples by Maxxam Laboratories using a gravimetric method.
Methods presented by Martel and Gélinas 24 were used for column packing and water saturation. Fifteen cm-long stainless steel columns with an inner diameter of 3.6 cm were used. Replicate groundwater was used by adding 0.6 mg/L of CaCl2 to pure water, which corresponds
to the water hardness measured on field groundwater samples. Hydraulic conductivity tests using a constant head apparatus were carried out with each water saturated column prior to contamination. Three different hydraulic gradients were applied for each test to correct for equipment-induced head-loss. To ensure that no preferential flow path existed inside each column, conservative tracer tests were done using a potassium bromide (KBr) solution at a concentration of 250 mg/L. Bromide measurements on 15 mL effluent samples were conducted with an ion-selective Orion electrode.
Soil columns were contaminated from the top down using 1 pore volume (PV) of LNAPL obtained at the experimental site and a high flow velocity was induced by a peristaltic pump, using the same methodology as Dwarakanath et al. 17. LNAPL density was measured with a Antoon Paar density meter (precision of 0.001 g/cm3), and the viscosity was measured by a Cannon Fenske Opaque viscometer, model 25 Y661. Excess LNAPL in the column was pushed out of the soil by injecting water at the same velocity as the LNAPL. Residual LNAPL saturations inside each column were determined based on a mass balance on injected and extracted LNAPL. Hydraulic conductivity tests were then carried out using the same constant
ACCEPTED MANUSCRIPT
head apparatus as previously used on the uncontaminated columns in order to measure the impact of the residual LNAPL saturation on the aqueous phase relative permeability.
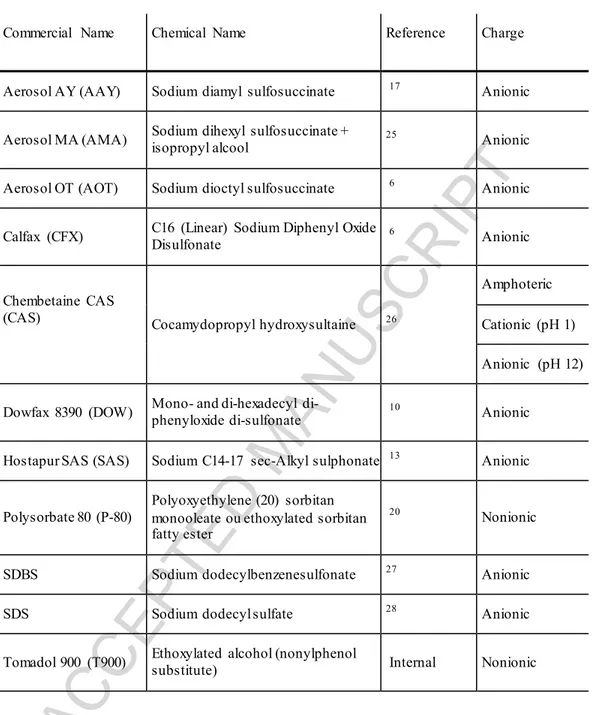
A list of 11 environmentally-friendly surfactant candidates was defined based on a literature survey (Table 2). The following surfactant selection criteria were then sequentially applied to all listed surfactants: (1) commercial availability; (2) LNAPL-surfactant solution compatibility; (3) LNAPL-surfactant solution-soil compatibility; and (4) σow measurements.
ACCEPTED MANUSCRIPT
Table 2. Surfactant candidates
Commercial Name Chemical Name Reference Charge
Aerosol AY (AAY) Sodium diamyl sulfosuccinate 17 Anionic
Aerosol MA (AMA) Sodium dihexyl sulfosuccinate + isopropyl alcool 25 Anionic
Aerosol OT (AOT) Sodium dioctyl sulfosuccinate 6 Anionic
Calfax (CFX) C16 (Linear) Sodium Diphenyl Oxide Disulfonate 6 Anionic
Chembetaine CAS
(CAS) Cocamydopropyl hydroxysultaine 26
Amphoteric Cationic (pH 1) Anionic (pH 12) Dowfax 8390 (DOW) Mono- and di-hexadecyl di-phenyloxide di-sulfonate 10 Anionic
Hostapur SAS (SAS) Sodium C14-17 sec-Alkyl sulphonate 13 Anionic
Polysorbate 80 (P-80)
Polyoxyethylene (20) sorbitan monooleate ou ethoxylated sorbitan fatty ester
20 Nonionic
SDBS Sodium dodecylbenzenesulfonate 27 Anionic
SDS Sodium dodecyl sulfate 28 Anionic
Tomadol 900 (T900) Ethoxylated alcohol (nonylphenol substitute) Internal Nonionic
Commercial availability was checked with local distributors. LNAPL-surfactants compatibility was then checked by mixing 5 mL of washing solution at 1%-wt with 5 mL of LNAPL obtained at the site. Following a 20-min centrifugation, the resulting phase viscosity was visually assessed. LNAPL-surfactant solution-soil compatibility was assessed through a qualitative bottle test using the methodology proposed by Powers et al. 29. All LNAPL-aqueous phase interfacial
ACCEPTED MANUSCRIPT
tension measurements (σow) were carried out using the pendant drop technique with a First Ten
Angstrom dynamic FTA analyzer 30. Adjustments of the amphoteric surfactant solution pH was
performed with laboratory grade NaOH.
Surfactant flushing of soil columns was performed using a constant head injection apparatus. The apparatus allowed the sequential application of three fixed-gradient steps for surfactant flushing. The impacts of surfactant-LNAPL-soil-groundwater interactions on the effective aqueous phase permeability were measured during the first fixed-gradient step. During this first step, the surfactant solution was injected in the column until pH and air-water surface tension (σaw) values at the column outlet reached those of the injected solution, and until free-phase
LNAPL was no longer produced. The flow rate was measured by weighing the effluent at every 20-mL intervals. The pH was measured in each 20-ml effluent sample using pH color strips. The
σaw values were measured using the pendant drop technique with a First Ten Angstrom dynamic FTA analyzer. Experiments using gradients increased in steps were then carried out to determine the CDCs for each soil column following the methodology presented by Sabatini et al. 10. Produced LNAPL at the end of each step was measured gravimetrically. The CDC was constructed using the NCa equation (1).
3 RESULTS
3.1 Soil characterization
Studied soil grain size distributions were labelled as a function of their silt mass fractions: the coarse soil columns (0.5-2.0 mm) contain less than 10% silt. The intermediate soil columns
ACCEPTED MANUSCRIPT
(0.01-2.0 mm) contain 20% of silt material and 1.2% of clay. The fine soil columns (< 2.0 mm) contain 40% silt and 5% clay. In the USDA soil classification system, these coarse, intermediate and fine soil respectively correspond to a fine sand, a loamy fine sand and a sandy loam. Coefficients of uniformity (Cu) were respectively 2, 10 and 60 for fine, intermediate and coarse soils, all indicative of poorly sorted soil. Dry soil density after packing was 1751 kg/m3 (+/- 44 kg/m3), and pore volumes were 48 mL (+/- 5 ml).
Quartz, feldspars and amphibolites were the most common minerals present in the soil (45% to 75% on a mass basis). However, significant proportions of clay (2% to 30% on a mass basis) and carbonate minerals (12% to 25% on a mass basis) were also present. The organic carbon content of the soil was measured at 2.3 +/- 0.1 %-wt, which is not considered high.
3.2 LNAPL characterization
The LNAPL present at the experimental site is the result of pure paraxylene solvent migrating into a soil previously contaminated by heavier diesel fuel. For that reason, the proportions of xylene and diesel are unknown. The density and kinematic viscosity of the LNAPL collected at the site and used for the experiments is 860 kg/m3 and 1.00 ×10⁻⁶ m2/s (1.00 cSt) respectively. As a comparison, the density and kinematic viscosity of the pure paraxylene solvent is 860 kg/m3
and 0.76 ×10⁻⁶ m2/s (0.76 cSt).
3.3 Surfactant screening
Results from the surfactant screening process are as follow. DOW was excluded from the list after the producer indicated the non-availability of this product for aquifer remediation purposes.
ACCEPTED MANUSCRIPT
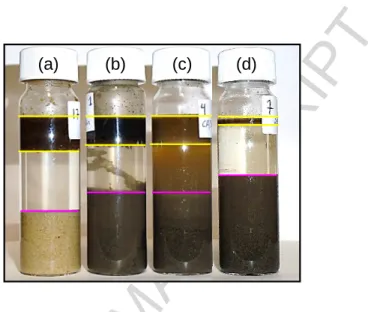
Commonly used branched anionic surfactants (AOT, SDS, SDBS and SAS) produced a viscous organic phase when 1%-mass surfactant solutions were mixed the LNAPL. In addition, qualitative bottle tests showed a strong interaction between soil and other anionic candidates, AMA and AAY, as well as with the CAS (pH 1) solution (Figure 2).
Figure 2. Qualitative bottle tests: (a) silica sand - water- LNAPL system; (b) Site soil - water-
LNAPL system; (c) Site soil – CAS (pH 12) – LNAPL system; (d) Site soil – AMA – LNAPL system
The possibility of creating locally a viscous organic phase or strong interactions between the soil, LNAPL and surfactant was not desirable for this project targeting a heterogeneous environment including low-permeability soil layers prone to plugging. For that reason, further use of anionic surfactants including salinity scans was excluded.
As a corollary to the exclusion of all anionic candidates based on potential adversary effects observed during these screening tests (with the exception of CFX), the option of forming a middle-phase microemulsion achieving ultra-low interfacial tensions with the LNAPL was no longer considered. The screening process was therefore refocused on achieving the greatest
ACCEPTED MANUSCRIPT
possible interfacial tension reduction within a Winsor Type I system. The final surfactant formulation selection was based on the σow measurements. The formulation 1.5%-wt CAS ( pH
12) achieved σow values of 0.06 mN/m, which was satisfactory compared with other published
data, considering that this selected formulation was compatible with the site soil and LNAPL. Preconditioning of the porous media with NaOH is, however, required with this formulation in order to reduce adsorption and enhance the interfacial reduction with the LNAPL. The analysis of previous exploratory soil column experiments (not reported here) indicated that the NaOH mass required to precondition the site soil to a pH of 12 was in a realistic range (between 1.3 and 2.1 g NaOH per kg of soil).
3.4 Soil column experiments
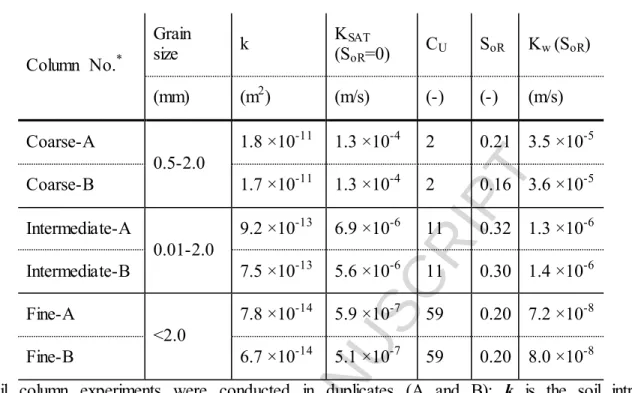
Table 3 presents a summary of the soil column experiments initial conditions. Table 4 and Figure 3 present the step tests results.
ACCEPTED MANUSCRIPT
Table 3. Initial conditions of the soil column experiments
Column No.* Grain size k K(SSAToR=0) CU SoR Kw (SoR) (mm) (m2) (m/s) (-) (-) (m/s) Coarse-A 0.5-2.0 1.8 ×10⁻¹¹ 1.3 ×10⁻⁴ 2 0.21 3.5 ×10⁻⁵ Coarse-B 1.7 ×10⁻¹¹ 1.3 ×10⁻⁴ 2 0.16 3.6 ×10⁻⁵ Intermediate-A 0.01-2.0 9.2 ×10⁻¹³ 6.9 ×10⁻⁶ 11 0.32 1.3 ×10⁻⁶ Intermediate-B 7.5 ×10⁻¹³ 5.6 ×10⁻⁶ 11 0.30 1.4 ×10⁻⁶ Fine-A <2.0 7.8 ×10⁻¹⁴ 5.9 ×10⁻⁷ 59 0.20 7.2 ×10⁻⁸ Fine-B 6.7 ×10⁻¹⁴ 5.1 ×10⁻⁷ 59 0.20 8.0 ×10⁻⁸
*Soil column experiments were conducted in duplicates (A and B); k is the soil intrinsic
permeability, KSAT (SOR=0) is the soil hydraulic conductivity to water at zero LNAPL saturation,
CU is the uniformity coefficient, SoR is the residual LNAPL saturation and Kw (SOR) is the soil
ACCEPTED MANUSCRIPT
Table 4. Capillary desaturation step tests of the soil column experiments
Column No. Step no. dh/dl
** q w NCa SoR LNAPL Recovery(2) (m/m) (m/s) (-) (-) (%) Coarse-A 1 0.71 5.4 × 10⁻⁵ 1.3 × 10⁻³ 14.6 32 2 7.1 4.5 × 10⁻⁴ 1.1 × 10⁻² 9.7 55 3 15 1.4 × 10⁻³ 3.3 × 10⁻² 9.0 58 Coarse-B 1 0.71 3.7 × 10⁻⁵ 8.6 × 10⁻⁴ 14.2 10 2 7.1 2.5 × 10⁻⁴ 5.8 × 10⁻³ 7.2 54 3 15 1.4 × 10⁻³ 3.3 × 10⁻² 6.2 58 Intermediate-A 1 3.6 1.9 × 10⁻⁶ 4.5 × 10⁻⁵ 32.1 0 2 7.1 3.1 × 10⁻⁶ 7.3 × 10⁻⁵ 32.1 0 3 15 7.5 × 10⁻⁶ 1.8 × 10⁻⁴ 32.1 0 4(3) n.m. 5.8 × 10⁻⁵ 1.4 × 10⁻³ 31.9 0 5(3) n.m. 1.8 × 10⁻⁴ 4.2 × 10⁻³ 20.7 36 Intermediate-B 1 3.6 1.8 × 10⁻⁶ 4.2 × 10⁻⁵ 29.8 0 2 7.1 3.2 × 10⁻⁶ 7.4 × 10⁻⁵ 29.8 0 3 15 7.5 × 10⁻⁶ 1.8 × 10⁻⁴ 29.6 0 4(3) n.m. 1.2 × 10⁻⁴ 2.8 × 10⁻³ 18.4 38 Fine-A 1 15 2.8 × 10⁻⁷ 6.6 × 10⁻⁶ 19.9 0 Fine-B 1 15 4.5 × 10⁻⁷ 1.0 × 10⁻⁵ 19.6 0
** Applied over a column length of 0.14 m; (2) Cumulative; (3) Additional pressure steps
ACCEPTED MANUSCRIPT
Figure 3. Effluent flux (qw, m/s) and LNAPL mass produced (% LNAPL recovery on a mass
basis) as a function of PV injected during the soil column fixed-gradient step tests. Steps are marked by the vertical dashed lines and circled numbers. Steps 1 to 3 are constant head tests.
0 20 40 60 80 100 0 5 % LNA P L Re c ov e ry q ( m/s ) Cumulative PV injected 0 20 40 60 80 100 0 5 % L NA P L Recov er y q ( m/s) Cumulative PV injected 0 20 40 60 80 100 0 5 10 15 % L NA P L Recov er y q ( m /s) Cumulative PV injected 0 20 40 60 80 100 0 5 10 15 % L NA P L Recov er y Cumulative PV injected 0 20 40 60 80 100 0 5 10 15 20 25 % L NA P L Recov er y qw (m/s) Cumulative PV injected 0 20 40 60 80 100 0 5 10 15 20 25 % L NA P L Recov er y qw (m/s) Cumulative PV injected 10-2 10-3 10-4 10-5 X: (a) Coarse-A 10-3 10-4 10-5 10-6 X: (b) Coarse-B 10-3 10-4 10-5 10-6 X: (d) Intermediate-B (c) Intermediate-A X: 10-2 10-3 10-4 10-5 X: (f) Fine-B 10-6 10-7 X: (e) Fine-A 10-6 10-7 : qw (m/s) : qw (m/s) : qw (m/s) : qw (m/s) : qw (m/s) : qw (m /s) 1 2 3 1 2 3 1 2 3 4* 1 2 3 5* 1 1 4*
ACCEPTED MANUSCRIPT
Steps 4 and 5 (marked with *) indicate increased pressure steps performed in order to produce LNAPL for the construction of the capillary desaturation curve.
4 INTERPRETATION AND DISCUSSION
4.1 Soil clogging due to surfactant-NAPL-soil interactions
Effects of surfactant-NAPL-soil interactions were evaluated globally by quantifying their impact on the column aqueous discharge flux (qw) under a fixed hydraulic gradient as a function
of cumulative pore volume (PV) injected (Figure 3). For all column experiments, an initial drop by a factor of 1.4 was expected as the more viscous washing solution (µ = 1.4 mPas) displaces the resident water (µ = 1.0 mPa.s).
For the coarse soil column experiments (Coarse-A and Coarse-B), a qw drop was only observed
during the first fixed-gradient step. Both coarse soil column experiments showed an initial qw
increase from 0 to 1.7 PV injected (Coarse-A) and from 0 to 1.4 VP injected (Coarse-B). This initial increase corresponds to the production of LNAPL at the effluent and corresponding aqueous phase relative permeability increase. This increase, however, is not sufficient to overcome a subsequent qw drop in both experiments, from 1.7 to 6.6 PV injected (Coarse-A) and
from 1.4 to 2.6 VP injected (Coarse-B). The amplitude of these drops corresponds respectively to factors of 1.4 and 2.3, which is exactly in the range of the qw drop anticipated due to the viscosity
of the solution (µ = 1.4 mPas) or slightly above it. Subsequent steps did not show any qw
decrease due to NAPL-soil-groundwater interactions. Results suggest surfactant-NAPL-soil-groundwater interactions such as viscous phase production or soil particle migration were not significant for the coarse soil.
ACCEPTED MANUSCRIPT
Both intermediate soil column experiments (Intermediate-A and Intermediate-B) showed a qw
drop occurring during the first two fixed-gradient steps. During those 2 steps, no LNAPL was produced at the effluent. During the first step, qw dropped by factors of 2.0 (Intermediate-A) and
3.6 (Intermediate-B). During the second step, qw dropped by an additional factor of 1.8
(Intermediate-A) and 1.2 (Intermediate-B). The combined amplitude of these 2 drops, which are higher than the range of the qw drop anticipated due to the viscosity of the solution, are
potentially linked to the presence of the 0.01-0.5 mm grain size fraction or surfactant-NAPL-soil interactions. This phenomenon stabilized, however, after the injection of 6.0 and 6.4 PV for Intermediate-A and Intermediate-B, respectively. The fact that qw is either decreasing during the
first two steps or stable during the latter steps, even after LNAPL was produced (Figure 3 (c) and 3 (d)) suggests that the permeability loss observed is permanent in nature and that permeability was not recovered during flushing. Gabr et al. 31 also observed clogging during column tests in which naphthalene was recovered with an anionic surfactant solution. Although their soil was slightly coarser than the Intermediate soil of this experiment, a similar permeability reduction of one half order of magnitude was observed in a soil containing 95% of silica sand and 5 % of kaolinite. However, in their experiment, the hydraulic conductivity loss showed to be reversible. Although full recovery occurred after a large number of pore volume circulated (>50), it was clearly initiated at 5 PV. This reversible nature of the permeability loss excluded fines migration as the cause of clogging (which would be unrecoverable), and pointed towards phase behavior related clogging. These phase behaviors include the formation of liquid crystal, gels, phase conversions and microemulsions. This further supports the hypothesis that since the permeability reduction we observed does not appear to be reversible, it is linked to a permanent phenomenon such as fines migration and settling.
ACCEPTED MANUSCRIPT
Results from the fine soil experiments (Fine-A and Fine-B) confirm the link between the presence of fine grains and the amplitude of the qw drop. Drops of factors of 5.6 and 5.3 were
measured respectively for Fine-A and Fine-B, resulting in clogging at the end of the first fixed-gradient steps (4.1 and 4.3 VP injected, respectively). These columns did not produce any LNAPL. The presence of clay particles (5%-wt) within this soil fraction is most likely responsible for this behavior.
These results indicate that the fine soil is not suitable for surfactant-enhanced capillary desaturation. For the other two grain size fractions (intermediate and coarse soil, Figure 3 (a) to (d)), they suggest that pore plugging would not be a major issue for these grain-size distributions. These results also show that fixed-gradient step tests are an appropriate methodology to assess the global effect of surfactant-LNAPL-soil-groundwater interactions and that such tests should be used routinely during the selection of surfactant solution formulations.
4.2 Surfactant loss due to adsorption
Surfactant loss due to adsorption as a function of soil grain size fractions is presented in Figure 4. An equilibrium between adsorbed surfactant monomers and their aqueous concentration throughout the soil column is assumed to be reached when σaw measured at the column effluent
corresponds to the σaw of the solution prior to injection. This is based on the strong correlation
between interfacial and surface tensions (Figure 4 (a), measured at neutral pH). Other researchers already used surface tension to quantify surfactant adsorption onto soil for aqueous phase surfactant concentrations less than the critical micelle concentration 32. As the link between surfactant adsorption and the clay content in soil was already demonstrated by Rodiguez-Cruz et al. 33, adsorption was anticipated.
ACCEPTED MANUSCRIPT
Figure 4 (b) shows that such equilibrium was obtained after the injection of 0.9 and 1.0 PV for the coarse soil (i.e. no adsorption occurred), after 2.5 and 2.4 PVs for the intermediate soil, and after 3.3 and 3.5 PVs for the fine soil. These results can be used to calculate the CAS mass adsorbed to soil in equilibrium with the 1.5%-wt aqueous CAS concentration. The ratio of adsorbed surfactant mass over dry soil mass for each column, expressed in g of surfactant per g of dry soil, is 0.0026 and 0.0028 for the coarse soil, 0.0060 and 0.0058 for the intermediate soil and 0.10 and 0.11 for the fine soil. Adsorption being a surface-related phenomenon, this evaluation confirms that surfactant losses to adsorption on soil particles is greatly dependent on grain size distribution.
0 20 40 60 80 0.001 0.01 0.1 1 10 σ (mN/m) %-wt LNAPL-aqueous solution Air-aqueous solution (a) (b) 30 40 50 60 70 0 2 4 σaw (m N /m ) Cumulative PV injected Coarse-A Coarse-B Intermediate-A Intermediate-B Fine-A Fine-B 0 20 40 60 80 0.001 0.01 0.1 1 10 σ (mN/m) %-wt LNAPL-aqueous solution Air-aqueous solution (a) (b) 30 40 50 60 70 0 2 4 σaw (m N /m ) Cumulative PV injected Coarse-A Coarse-B Intermediate-A Intermediate-B Fine-A Fine-B
ACCEPTED MANUSCRIPT
Figure 4. (a) Surface and interfacial tension measurements as a function of surfactant
concentration for the same CAS solution; (b) Surface tension of column effluents as a function of cumulative pore volume (PV) injected used for surfactant (CAS) adsorption calculations.
These results show that soil column tests and surface tension measurements on column effluents are an appropriate methodology to assess surfactant losses due to adsorption on soil particles, and that these should be used routinely for the design of surfactant flushes at any scale to ensure that the targeted σow reduction is effectively reached.
4.3 Capillary desaturation curves
Figure 5 (a) presents the CDCs obtained for each column experiment as well as a combined normalized CDC encompassing all experimental results.
ACCEPTED MANUSCRIPT
Figure 5. (a) Capillary desaturation curves obtained for the 6 soil column experiments.
Experimental points as well as information from duplicate columns were used to draw the dashed curves; (b) Global capillary desaturation curve representative of sites conditions 7, 9, 17.
The wettability of the tested system is assessed by comparing the global site-specific CDC data with published CDCs (Figure 5 (b)). In aquifer remediation studies, NCa* values in the range of
10-5 to 10-4 were reported by Pennell et al. 9 for Ottawa sand columns contaminated with laboratory-grade PCE, representative of strongly water-wet systems. NCa* values in the 10-3-10-1 range were reported by Dwarakanath et al. 7 for aluminosilicate alluvium columns contaminated
by weathered DNAPLs, representative of mixed wettability systems. Their study highlighted the
0 10 20 30 40 SOR NCa Coarse-A Coarse-B Intermediate-A Intermediate-B Fine-A Fine-B 10-6 10-5 10-4 10-3 10-2 10-1 100 (a) NCa SoR /S oR _ in it ia l × × × × ××
Hill OU1 LNAPL, Alluvium, Water (#2) Hill OU1 LNAPL, Alluvium, Water (#3) Hill OU1 LNAPL, Alluvium, Water (Est.) Hill OU2 DNAPL, Alluvium, Water (#1) Hill OU2 DNAPL, Alluvium, Water (#2) Hill OU2 DNAPL, Alluvium, Water (Est.) Pennell, PCE, Ottawa Sand, Surfactant Hill OU2 DNAPL, Alluvium, Surfactant Hill OU2 DNAPL, Alluvium, Surfactant (Est.)
10-8 10-7 10-6 10-5 10-4 10-3 10-2 10-1 100 0.0 0.2 0.4 0.6 0.8 1.0 Coarse-A Coarse-B Intermediate-A Intermediate-B Fine-A Fine-B (b) (% )
ACCEPTED MANUSCRIPT
fact that CDCs are an interesting tool to measure the practical implications for NAPL recovery of the system wettability. They also showed that anionic surfactants lowered the NCa* by 2 to 3
orders of magnitude, indicating a wettability shift toward water-wet. Sabatini et al. 10 also observed water-wet conditions for laboratory grade PCE and clean soil (Dover AFB site) resulting from the use of surfactant solutions. Applying incremental σow reductions from 4 mN/m
to less than 0.005 mN/m, they reported a NCa* value of 5×10⁻⁶.
The CDC data obtained for this project is close to the estimated CDC for Hill OU1 LNAPL and OU2 soil (a mixed-wettability system), and both show a NCa* of 10-3. The OU2 soil consists
of a >90% alumino-silicate alluvium, and the OU1 LNAPL consists of weathered jet fuel obtained from a contaminated fire-training area. The CDC data are positioned to the right of the CDC obtained by Pennell et al. 9 for a water-wet system (Ottawa sand and laboratory grade DNAPL). The CDC data therefore suggest that: (1) The system tested exhibits a mixed-wettability; and (2) the Winsor Type I system optimized for site conditions and based on the use of an amphoteric surfactant at pH 12 did not reverse the wettability towards water-wetness, as observed by Dwarakanath et al. 7 with Hill OU2 alluvium and DNAPL.
The impact of the mixed-wettability and the high NCa* value measured for the site is related to
the range of capillary numbers achievable under realistic hydraulic gradients. In the coarse soil columns where Kw (SoR) = 3.5 × 10⁻⁵ m/s, LNAPL capillary desaturation was first observed at
NCa values of 1.3 × 10⁻³ (Coarse-A) and 8.6 × 10⁻⁴ (Coarse-B), obtained with a hydraulic gradient
corresponding to 0.7 m/m (Figure 5 and Table 4), and resulting in LNAPL recoveries of 32 and 10% respectively. This hydraulic gradient is considered high but realistic within a 5-spot injection/extraction well pattern. However, any further increase of NCa and LNAPL recovery in
ACCEPTED MANUSCRIPT
second point on the Coarse-A and Coarse-B curves, representing >50% LNAPL cumulative recovery, were obtained with a NCa close to 10-2 requiring an unrealistic hydraulic gradient of 7.1
m/m. Based on these findings, capillary desaturation has a low potential for LNAPL recovery (<30%) in the coarse soil.
In the intermediate soil columns where Kw (SoR) = 1.4 × 10⁻⁶ m/s, LNAPL capillary
desaturation was first observed at NCa* values of 4.2 × 10⁻³ (Intermediate-A) and 2.8 × 10⁻³ (Intermediate-B), obtained with a hydraulic gradient of 15 m/m (Figure 5 and Table 4). This gradient is considered unrealistic within a 5-spot injection/extraction well pattern. In the fine soil columns, LNAPL capillary displacement could not be triggered at all due to low Kw (SoR) and
pore plugging. Based on the intermediate and fine soil permeabilities, LNAPL capillary desaturation is not a suitable LNAPL recovery mechanism in these types of soil.
The similarities of the CDC obtained from the coarse and intermediate soil columns (Figure 5 (b)) suggest that parameters such as the larger spreading of the grain size distribution or the initial SoR value did not influence the overall shape of the CDC.
Finally, the CDC obtained for the coarse soil exhibits tailing as SoR is lowered. The relationship
between the NCa (log-scale) and LNAPL recovery is not linear but is also dependant on SoR.
LNAPL trapping in the porous media through mechanisms such as capillary by-passing and snap-off are responsible for this phenomenon. As SoR decreases, the LNAPL mobility is reduced
due to the decrease of the relative permeability to the LNAPL 15. This phenomenon was not reported on other published CDCs.
ACCEPTED MANUSCRIPT
5 CONCLUSION
The injection of low-concentration (<1 wt%) surfactant solutions in the saturated part of a heterogeneous source zone at an experimental site was investigated as a multiphase vacuum extraction follow-up technology. The impacts of soil permeability, wide pore-size distribution, mixed mineralogy, weathered LNAPL and groundwater hardness on surfactant formulations, achievable capillary number (NCa) and resulting site-specific capillary desaturation curves were
quantified in soil columns representative of the main stratigraphic layers encountered on site. Results show that fixed-gradient step tests are an appropriate methodology to assess the global effect of surfactant-LNAPL-soil-groundwater interactions and that such tests should be used routinely during the selection process of surfactant solution formulations. The main findings of this research are the following:
- Compatibility issues between the mixed mineralogy soils, hard groundwater, mixed LNAPL and usual anionic surfactants were observed during the screening process. The optimized solution was a Winsor type I system promoting an interfacial tension of 0.06 mN/m between the site LNAPL and the amphoteric surfactant CAS in aqueous solution at pH 12;
- Surfactant loses to adsorption and pore media plugging due to the mobilization of fine soil particles were the most significant in soil where the < 0.01 mm fraction was present, and were not observed in the coarse soil (0.05-2.0 mm);
- The site-specific capillary curves suggest that the system tested exhibits a
mixed-wettability and that the Winsor Type I system optimized for site conditions and based on the use of an amphoteric surfactant at pH 12 did not reverse the wettability towards water-wetness;
- The soil permeability strongly influences LNAPL recovery potential through the relationship between NCa and hydraulic gradients. In this case, the critical capillary
ACCEPTED MANUSCRIPT
At those gradients, potential LNAPL recovery was 30 % at the most. The critical
capillary number could not be achieved in the intermediate and fine soil fractions under realistic hydraulic gradients.
- Unlike previously published CDCs, the relationship between NCa (log-scale) and LNAPL
recovery was not linear but dependant on SOR.
- The findings suggest that heterogeneous soil properties and weathered LNAPL at the site made the injection of low-concentration (<1 wt%) surfactant solutions not applicable to the studied site.
AUTHOR INFORMATION
Corresponding Author
*Thomas Robert, Institut national de la recherche scientifique, Centre Eau Terre Environnement (INRS-ETE), 490 Rue de la Couronne, Quebec City, Quebec, Canada, G1K 9A9. [email protected]
Author Contributions
This manuscript was written with contributions from all authors. All authors have given their approval to the final version of the manuscript. T. Robert conducted the laboratory experiments, performed the data interpretation and wrote the first draft of the paper. The other authors equally contributed to the experimental protocol and data interpretation, and reviewed the draft.
Funding Sources
Natural Science and Engineering Research Council of Canada (NSERC)/TechnoRem Inc. Collaborative Research and Development Grant (412730-11); NSERC-Discovery grant of Richard Martel (326975-2011).
ACCEPTED MANUSCRIPT
Funding for this research was provided by a NSERC/TechnoRem Inc. Collaborative Research and Development Grant (412730-11), and by the NSERC-Discovery grant of R. Martel (326975-2011). The authors wish to thank Richard Lévesque for analytical support, and Charles-Élie Mercier, a bachelor internship, for his help with the sand column tests.
ACCEPTED MANUSCRIPT
REFERENCES
1. Suthersan, S.; Payne, F. C., In situ remediation engineering. CRC Press: Boca Raton (Fl.), 2004.
2. Mercer, J. W.; Cohen, R. M., A review of immiscible fluids in the subsurface: Properties, models, characterization and remediation. Journal of Contaminant Hydrology 1990, 6 (2), 107-163.
3. Johnson, P. C.; Stanley, C. C.; Kemblowski, M. W.; Byers, D. L.; Colthart, J. D., A Practical Approach to the Design, Operation, and Monitoring of In Situ Soil-Venting Systems.
Ground Water Monitoring & Remediation 1990, 10 (2), 159-178.
4. Kitanidis, P. K.; McCarty, P. L., Delivery and Mixing in the Subsurface: Processes and
Design Principles for In Situ Remediation. Springer Science & Business Media: 2012; Vol. 4.
5. Dugan, P. J.; Siegrist, R. L.; Crimi, M. L., Coupling surfactants/cosolvents with oxidants for enhanced DNAPL removal: A review. Remediation Journal 2010, 20 (3), 27-49.
6. Shiau, B.-J.; Brammer, J. M.; Sabatini, D. A.; Harwell, J. H.; Knox, R. C. In Recent
development of low concentration surfactant flushing for NAPL-impacted site remediation and pollution prevention, Petroleum Hydrocarbons and Organic Chemicals in Ground
Water/Prevention, Assessment, and Remediation Twentieth Annual Conference and Exposition, Costa Mesa, CA, 2003.
7. Dwarakanath, V.; Jackson, R. E.; Pope, G. A., Influence of Wettability on the Recovery of NAPLs from Alluvium. Environmental Science & Technology 2002, 36 (2), 227-231.
8. Martel, R.; Lefebvre, R.; Gélinas, P. J., Aquifer washing by micellar solutions: 2. DNAPL recovery mechanisms for an optimized alcohol–surfactant–solvent solution. Journal of
Contaminant Hydrology 1998, 30 (1–2), 1-31.
9. Pennell, K. D.; Pope, G. A.; Abriola, L. M., Influence of Viscous and Buoyancy Forces on the Mobilization of Residual Tetrachloroethylene during Surfactant Flushing. Environmental
Science & Technology 1996, 30 (4), 1328-1335.
10. Sabatini, D. A.; Knox, R. C.; Harwell, J. H.; Wu, B., Integrated design of surfactant enhanced DNAPL remediation: efficient supersolubilization and gradient systems. Journal of
Contaminant Hydrology 2000, 45 (1–2), 99-121.
11. Shiau, B.-J.; Sabatini, D. A.; Harwell, J. H., Solubilization and Microemulsification of Chlorinated Solvents Using Direct Food Additive (Edible) Surfactants. Ground Water 1994, 32 (4), 561-569.
12. Childs, J.; Acosta, E.; Annable, M. D.; Brooks, M. C.; Enfield, C. G.; Harwell, J. H.; Hasegawa, M.; Knox, R. C.; Rao, P. S. C.; Sabatini, D. A.; Shiau, B.; Szekeres, E.; Wood, A. L., Field demonstration of surfactant-enhanced solubilization of DNAPL at Dover Air Force Base, Delaware. Journal of Contaminant Hydrology 2006, 82 (1–2), 1-22.
13. Martel, R.; Hébert, A.; Lefebvre, R.; Gélinas, P.; Gabriel, U., Displacement and sweep efficiencies in a DNAPL recovery test using micellar and polymer solutions injected in a five-spot pattern. Journal of Contaminant Hydrology 2004, 75 (1–2), 1-29.
ACCEPTED MANUSCRIPT
14. McCray, J. E.; Tick, G. R.; Jawitz, J. W.; Gierke, J. S.; Brusseau, M. L.; Falta, R. W.; Knox, R. C.; Sabatini, D. A.; Annable, M. D.; Harwell, J. H.; Wood, A. L., Remediation of NAPL Source Zones: Lessons Learned from Field Studies at Hill and Dover AFB. Ground
Water 2011, 49 (5), 727-744.
15. Lake, L. W., Enhanced oil recovery. 1989; p Medium: X; Size: Pages: (550 p).
16. Morrow, N. R., Wettability and its effect on oil recovery. Journal of Petroleum
Technology 1990, 42 (12), 1476-1484.
17. Dwarakanath, V.; Kostarelos, K.; Pope, G. A.; Shotts, D.; Wade, W. H., Anionic surfactant remediation of soil columns contaminated by nonaqueous phase liquids. Journal of
Contaminant Hydrology 1999, 38 (4), 465-488.
18. Jackson, R. E.; Dwarakanath, V.; Meinardus, H. W.; Young, C. M., Mobility control: How injected surfactants and biostimulants may be forced into low-permeability units.
Remediation Journal 2003, 13 (3), 59-66.
19. Martel, K. E.; Martel, R.; Lefebvre, R.; Gélinas, P. J., Laboratory Study of Polymer Solutions Used for Mobility Control During In Situ NAPL Recovery. Ground Water Monitoring
& Remediation 1998, 18 (3), 103-113.
20. Robert, T.; Martel, R.; Conrad, S. H.; Lefebvre, R.; Gabriel, U., Visualization of TCE recovery mechanisms using surfactant–polymer solutions in a two-dimensional heterogeneous sand model. Journal of Contaminant Hydrology 2006, 86 (1–2), 3-31.
21. Silva, J. A. K.; Smith, M. M.; Munakata-Marr, J.; McCray, J. E., The effect of system variables on in situ sweep-efficiency improvements via viscosity modification. Journal of
Contaminant Hydrology 2012, 136–137 (0), 117-130.
22. Robert, T.; Martel, R.; Lefebvre, R.; Lauzon, J.-M.; Morin, A., Field Tracer Test for the Design of LNAPL Source Zone Surfactant Flushing. Groundwater Monitoring & Remediation
2016, 36 (2), 68-82.
23. Payne, F. C.; Quinnan, J. A.; Potter, S. T., Remediation hydraulics. CRC Press: Boca Raton (Fl.), 2008.
24. Martel, R.; Gélinas, P. J., Surfactant Solutions Developed for NAPL Recovery in Contaminated Aquifers. Ground Water 1996, 34 (1), 143-154.
25. Dwarakanath, V.; Pope, G. A., Surfactant Phase Behavior with Field Degreasing Solvent.
Environmental Science & Technology 2000, 34 (22), 4842-4848.
26. Mouton, J.; Mercier, G.; Drogui, P.; Blais, J.-F., Experimental assessment of an innovative process for simultaneous PAHs and Pb removal from polluted soils. Science of The
Total Environment 2009, 407 (20), 5402-5410.
27. Flaming, J. E.; Knox, R. C.; Sabatini, D. A.; Kibbey, T. C., Surfactant Effects on Residual Water and Oil Saturations in Porous Media. Vadose Zone Journal 2003, 2 (2), 168-176. 28. Zhou, M.; Rhue, R. D., Screening Commercial Surfactants Suitable for Remediating DNAPL Source Zones by Solubilization†. Environmental Science & Technology 2000, 34 (10), 1985-1990.
ACCEPTED MANUSCRIPT
29. Powers, S.; Anckner, W.; Seacord, T., Wettability of NAPL-Contaminated Sands.
Journal of Environmental Engineering 1996, 122 (10), 889-896.
30. Woodward, R. P., Contact angle measurements using the drop shape method. First Ten
Angstroms Inc., Portsmouth, VA 1999.
31. Gabr, M. A.; Chen, J.; Thomas, R., Soil clogging during surfactant-enhanced flushing of naphthalene-contaminated sand-kaolinite. Canadian Geotechnical Journal 1998, 35 (6), 976-985.
32. Liu, Z.; Edwards, D. A.; Luthy, R. G., Sorption of non-ionic surfactants onto soil. Water
Research 1992, 26 (10), 1337-1345.
33. Rodríguez-Cruz, M. S.; Sanchez-Martin, M. J.; Sanchez-Camazano, M., A comparative study of adsorption of an anionic and a non-ionic surfactant by soils based on physicochemical and mineralogical properties of soils. Chemosphere 2005, 61 (1), 56-64.