JOURNAL OF GEOPHYSICAL RESEARCH, VOL. 89, NO. A3, PAGES 1725-1738, MARCH 1, 1984
The Global Distribution of Thermospheric Odd Nitrogen for Solstice
Conditions During Solar Cycle Minimum
J.-C. G!•RARD
Institut d'Astrophysique Universitd de Liege
R. G. ROBLE
National Center for Atmospheric Research
D. W. RvscI• AND A. I. STEWART
Laboratory for Atmospheric and Space Physics, University of Colorado
A two-dimensional model of the minor neutral constituents N(2D), N(4S), and NO from 70 to 360 km is formulated and used to investigate the global distributions of these species for December solstice conditions during solar cycle minimum. For background properties the zonally averaged circulation, temperature, and compositional structure of major neutral constituents in the thermosphere are obtained from the coupled dynamical chemical model calculations of Robie and Kasting (this issue). Transport of the minor neutral constituents by both the meridional and vertical circulation and vertical molecular and eddy diffusion are considered in the model. The calculated distributions of the minor neutral constituents for solar ionization only and for solar plus auroral ionization are considered. The
results show that the summer-to-winter pole meridional circulation transports both NO and N(4S)
across the solar terminator into the polar night region where there is a downward vertical transport toward the mesosphere. The calculated latitudinal distribution of NO in the lower thermosphere for the solar-ionization-only case does not agree with the latitudinal NO distribution usually measured by the Atmosphere Explorer satellites. To obtain agreement between the calculated and observed structure, it is necessary to include ionization and dissociation sources due to auroral particle precipitation. The temperature and compositional structure and the circulation changes caused by high-latitude heating
and the particle-induced production of N(2D) and N(4S) all combine to bring the calculated NO structure into better agreement with observations. The choice of the eddy diffusion coefficient critically controls the downward flow of thermospheric nitric oxide into the mesosphere. The model shows that the odd nitrogen densities at high winter latitudes are entirely controlled by particle precipitation and transport processes.
INTRODUCTION
Nitric oxide was first observed in the earth's upper atmosphere by measuring resonantly scattered sunlight in the • bands [Barth, 1974]. This technique has provided a wealth of observational data relating to the altitude distribu- tion of NO [Meira, 1970; Tisone, 1973; Tohmatsu and lwagami, 1976; Baker et al., 1977; Trinks et al., 1978; Thomas, 1978; Beran and Bangert, 1979] and the character- istics of its global distribution [Rusch, 1973; Rusch and Barth, 1975; Stewart and Cravens, 1978; Cravens and Stew-
art, 1978; Cravens et a•., 1979; Cravens, 1981]. Massie
[ 1980] derived the nitric oxide vertical distribution at twilight by measuring the absorption of the ultraviolet solar radiation at the wavelength of the (1, 0)/5 band. Measurements of NO
density profiles in the upper stratosphere and lower meso-
sphere by chemiluminescent techniques are less frequent [Mason and Horvath, 1976; Horvath and Mason, 1978]. Ion composition measurements of the D and E region have also been used to infer the ambient NO density [Swider, 1978;
Golshan and Sechrist, 1975].
The vertical distribution of nitric oxide in the mid-latitude region between 50 and 200 km is characterized by a density
Copyright 1984 by the American Geophysical Union. Paper number 3A1751.
0148-0227/84/003 A- 1751 $05.00
of 1-3 x 10⁸
molecules
cm -3 at 50 km; a decrease
in density,
with a scale height close to the mixing scale height, to a minimum of a few times 106 to a few times 107 cm -3 at 80-85
km; a relative maximum
of a few times 107
to a few times 108
cm
-3 at 95-115 km; and an upper thermosphere
scale
height
characteristic of a constituent in diffusive equilibrium. As
indicated, the measured profiles exhibit large spatial, sea- sonal, and diurnal variations.
Global characteristics of nitric oxide distributions in the lower thermosphere and upper mesosphere indicate large latitudinal and seasonal variations and geomagnetic effects. Larger amounts of NO are seen in the polar regions than at
mid-latitudes [Rusch and Barth, 1975; Cravens and Stewart, 1981]; the amount of NO at high latitudes responds to
geomagnetic activity [Gdrard and Barth, 1977; Stewart and
Cravens, 1978], and there is evidence of NO transport from
high to low latitudes at times of enhanced geomagnetic
activity [Cravens and Stewart, 1978]. Furthermore, the magnitude of the latitude gradient depends upon the Ap
index; the greater the Ap value, the larger the gradient.
Geisler and Dickinson [1968] have shown that vertical veloc- ities of the magnitude associated with either planetary waves
or with a mean meridional circulation can transport a sub-
stantial amount of nitric oxide from the thermosphere into the 70-85 km region.
Theoretical investigations of the chemistry of NO in the lower thermosphere [Norton and Barth, 1970; Strobel et al., 1970; Rusch, 1973] identified the reaction of metastable 1725
1726 G!•RARD ET AL.: THERMOSPHERIC ODD NITROGEN
atomic nitrogen and molecular oxygen as the major source of NO,
N(2D) + 02 • NO + 0
and the reaction of ground-state atomic nitrogen with NO as the major chemical loss:
N(4S) + NO--> N2 + O
(2)
Thus the amount of NO present depends on the relative
concentrations
of N(2D) with respect to N(4S) and the
reaction rate coetficients for reactions (1) and (2). The extended theoretical picture is more complicated as N and
NO are subject to transport processes
and the chemical
system involved in the production and loss of atomic nitro- gen is complex. The intricacies of this system have beenexplored by Oran et al. [1975], Rusch et al. [1975], Cravens et al. [1979], Rusch and Sharp [1981], and Frederick and
Orsini [1982], in the mid-latitude ionosphere, and by Hyman
et al. [1976], G•rard and Barth [1977], Robie and Rees [1977], G•rard and Rusch [1979], Rees and Robie [1979], and Rusch and G•rard [1980] in the high-latitude disturbed ionosphere. Solomon et al. [1982a, b] examined the latitudi- nal and seasonal variations of the NO distribution by using a two-dimensional chemical-transport model from the ground to 110 km. More recently, Garcia and Solomon [1983] used a two-dimensional time-dependent model to study the zonally averaged structure of the middle atmosphere (16-116 km), allowing interactions among dynamics, radiation and photo- chemistry.
Models that include the known chemistry and solve the
one-dimensional continuity equations have been successful
in reproducing the general features of the measured nitric
oxide vertical density profiles in the thermosphere and mesosphere. However, these models cannot account for the variation of the NO profile with latitude as derived from satellite data. In a critical comparison of a one-dimensional model to observations from the Atmosphere Explorer satel-
lite, Cravens et al. [1979] concluded that only under ex- tremely quiet geomagnetic conditions (Ap -< 6) were the
results of a one-dimensional model comparable to the mea-
sured nitric oxide latitude gradients in the low and mid-
latitude E region. They speculated that horizontal transport was important and that a high-latitude source of NO must
exist and be related to the geomagnetic activity. The fact that
particle ionization of the earth's atmosphere could result in
enhanced NO densities was demonstrated experimentally by
measurements of enhanced NO+/O2 + ratios [Donahue et al.,
1970; Narcisi and $wider, 1976] and large NO densities [Rusch and Barth, 1975; Sharp, 1978; Witt et al., 1981] in the auroral zone. Theoretical results [Hyman et al., 1976; G•- rard and Barth, 1977; Robie and Rees, 1977; Rees and Robie, 1979; G•rard and Rusch, 1979] indicated that large localized enhancements of NO over ambient densities were
possible under or after particle bombardment. Consequent- ly, there is a wealth of observations indicating the influence
of particle ionization and, possibly, meridional winds on the global nitric oxide distribution.
The characteristics of the zonal mean thermospheric cir- culation have been studied by Dickinson et al. [1975, 1981] for equinox and by Dickinson et al. [1977, 1981] for solstice conditions. The seasonal variations and the solar cycle effects were described by Roble et al. [1977]. These studies
have shown that during the solstice period a summer-to-
winter mean meridional wind exists, but the circulation
reverses in the winter F region if significant Joule heating is
present at high latitudes. The conclusions of these models have been largely confirmed by the measurements of meridi- onal winds deduced from observations of the 630.0-nm
airglow Doppler shift [Hernandez and Robie, 1976a, b] and by incoherent scatter radar measurements [Emery, 1978a, b;
Babcock and Evans, 1979; OliVer, 1980]. The coupling
between zonal mean dynamics and composition in the lowerthermosphere was studied by Kasting and Robie [1981] and
Robie and Kasting [this issue], and their results are used as background properties for our calculations, as described in a
later section.
The importance of enhanced NO thermospheric densities as a sink for stratospheric ozone was suggested by Crutzen
[1979]. Solomon [1981] and Solomon et al. [1982a] used a two-dimensional photochemical-transport model from the
ground to 110 km to study the transport of thermospheric
NO toward lower altitudes and Garcia and Solomon [1983]
used a coupled, zonally averaged chemical-radiational-dy- namic model to study the transport process of NO in more
detail. The results of these studies have shown that the NO
produced in the thermosphere and by auroral processes can be transported downward to the stratosphere, particularly at high latitudes during polar winter. This process provides a coupling between the upper and lower atmosphere that may play a significant role in the photochemistry of odd nitrogen and odd oxygen in the stratosphere. A recent paper by Frederick et al. [1983] also points out that thermospheric NO has an influence on the mesospheric and stratospheric NO
solar photodissociation rates in the •0, 0) and •1, 0) bands,
and this radiative interaction may be an important coupling mechanism between the thermosphere and middle atmo-
sphere.
Equatorward transport of NO by winds and diffusion from the polar to the mid-latitude winter regions is believed to be partly responsible for the D region winter anomaly [e.g., $echrist, 1967; Solomon et al., 1982b]. Enhancements of the D region electron densities occasionally observed during
winter have been attributed to the presence of large amounts of nitric oxide in the mesosphere. Although there is observa-
tional evidence in favor of strong horizontal and vertical
winds in the auroral thermosphere during magnetically dis- turbed periods, it is not clear whether the speed and the direction of the meridional component are adequate to carry NO to mid-latitude regions. To investigate these problems, we developed a model to quantitatively describe the global effect of horizontal and vertical transport on odd nitrogen densities in the earth's thermosphere and mesosphere. In an
initial treatment, Robie and Gary [1979] showed that the
effect of horizontal transport due to winds on aurorally produced nitric oxide could be locally important. G•rard et al. [1980] gave a description of an early version of the code described here and showed preliminary calculations of the
two-dimensional
distributions
of NO, N(4S), and N(2D) for
the case of equinox and no thermospheric winds. Rusch et al. [1981] presented initial results that gave the minor neutral
constituent distributions, including transport by winds, dur- ing the solstice period, as specified by the chemical-dynami- cal model of Kasting and Robie [ 1981 ].
In this paper a two-dimensional model of odd nitrogen in the thermosphere and upper mesosphere is described. The
G!•RARD ET AL' THERMOSPHERIC ODD NITROGEN 1727
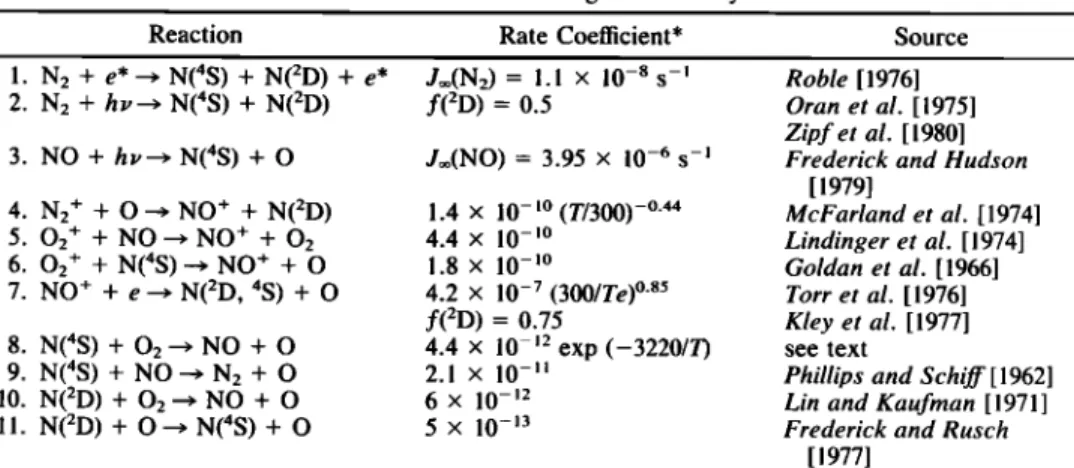
TABLE 1. Odd Nitrogen Chemistry
Reaction Rate Coefficient* Source
1. N2 + e* ---> N(4S) + N(2D) + e* 2. N2 + hv--> N(4S) + N(2D) 3. NO + hv--> N(4S) + O 4. N2 + + O---> NO + + N(2D) 5. 02 + q- NO---> NO + + 02 6. 02 + + N(4S)---> NO + + O 7. NO + + e---> N(2D, 4S) + O 8. N(4S) q- 02 '-'> NO + O 9. N(4S) q- NO---> N2 q- O 10. N(2D) + O2'-> NO + O 11. N(2D) + O---> N(4S) + O Jo•(N2) - 1.1 x 10 -8 s-• f(2D) = 0.5 Jo•(NO) = 3.95 x 10 -6 s -1 1.4 x 10 -•ø (T/300) -ø'44 4.4 x 10 -•ø 1.8 x 10-•ø 4.2 x 10 -7 (300/Te) ø'85 f(2D) = 0.75 4.4 x 10 -12 exp (-3220/T) 2.1 x 10 -ll 6 x 10 -12 5 X 10 -13 Robie [ 1976] Oran et al. [1975] Zipf et al. [ 1980]
Frederick and Hudson [1979] McFarland et al. [1974] Lindinger et al. [1974] Goldan et al. [1966] Torr et al. [1976] Kley et al. [1977] see text
Phillips and Schiff [ 1962] Lin and Kaufman [ 1971 ]
Frederick and Rusch [1977]
*Rates are in units of cm -3 S -1 unless otherwise noted, f(2D) indicates branching ratio for the reaction, J•(NO) is the photodissociation rate of NO at zero optical dep/h by sunlight.
global distributions
of nitric oxide and atomic nitrogen are
calculated for the solstice period for quiet and moderate magnetic activity during the solar minimum period. Theeffect of thermospheric
transport
by winds is investigated
as
well as the importance of particle-induced ionization in the auroral zones. The background neutral atmosphere tempera- ture and wind field are taken from the Kasting and Roble [1981] model modified to include the high-latitude heat sources consistent with the auroral electron impact ioniza- tion [Roble and Kasting, this issue]. The results are com- pared with rocket and satellite measurements, and the sensitivity of the model to eddy diffusion and neutral winds is investigated. Implications of the present calculations on needs for future experimental and modeling work are dis-cussed. Finally, downward fluxes of NO into the meso-
sphere are given, and their importance for stratospheric
ozone are discussed in view of the recent calculations bySolomon et al. [1982a, b].
THE MODEL
In polar coordinates the two-dimensional continuity equa-
tion for a minor constituent
ni moving
through
a background
gas may be written in the form:
Oni
O(•i 10(r2w)
1 O(v sin0)
• = Pi -- mini
Ot Or r 2 Or r sin0 00
(3)
where r and 0 are the geocentric altitude and the colatitude, respectively; Pi is the chemical production rate of ni; Li is its loss frequency; v and w are the meridional and vertical winds, respectively; and ½i is the vertical flux due to molecular and eddy diffusion. The equation for the vertical
flux is
hi Oni
ni
O•rT
)
•b i = -O i -- + + -- Hi Or T(•_•_•
O
n
i n
i o•rr
)
- K + + -- (4) Or Twhere Di and K are the molecular and eddy diffusion
coefficients,
respectively;/•
is the background
atmospheric
scale height; Hi is the diffusive equilibrium scale height of ni; and T is the neutral temperature.
By combining (3) and (4), a second-order partial differen-
tial equation
is obtained
for the density of N(4S) and NO.
The two coupled partial differential equations are solvedsimultaneously
by a code developed by Roble and Gary
[1979]. The finite difference scheme for (3) is a splitting
method developed by John Gary (private communication,1982).
A two-dimensional grid extends from pole to pole in 5 ø intervals of latitude and from 70 to 356 km in variable
altitude
steps.
The step sizes at each level are approximately
one third of the local atmospheric
scale height. The grid is
the same as that used by Kasting and Roble [1981] so thatthe output
variables
of O, 02, and N2 winds and temperature
from their model can be used to describe
the background
properties needed for our two-dimensional minor neutral constituent model.
The adopted chemical reactions, ionization and dissocia-
tion reactions, and their rates are taken from Cravens et al.
[1979] with few exceptions. Various reactions in the model and their rates are given in Table 1. A revised rate for reaction (8) in Table 1 is adopted to agree with the NASA
[1979] recommendation.
A 50% yield of N(4S) and N(2D)
from N2 photodissociation
is adopted.
A 60% yield of N(2D)
production by electron impact dissociation of N2 is used,which is intermediate
between
the value of 50% deduced
by
Zipf et al. [1980] and 70% used by Cravens et al. [1979].In addition to photoionization processes the model also
considers
the effects caused by particle precipitation
in the
auroral zone. The spatial distribution of the total ionizationrate by energetic
electrons
in the aurora is parameterized
by
a vertical Chapman profile and a Gaussian horizontal distri-bution:
q(z,O)=qoexp[1-F(z)-e-•'(Z)]exp[-(
witha0
(5)
Z -- Z0 F(z) - Hwhere
q0
is the maximum
ionization
ra•e
at altitude
z0, H the
1728 GI•RARD ET AL.' THERMOSPHERIC ODD NITROGEN
width of the auroral zones. This distribution is the same as that used by Robie and Kasting [this issue] for determining the thermospheric response of composition and dynamics to auroral particle precipitation. The relationship between the
ionization
rate and the particle heating
term Qp is
Qp(z,
0) = 1.602 x 10⁻¹²/XE
e q(z, O) ergs
cm-3s
-1 (6)
where/XE the mean energy loss to create an electron-ion pair and e is the neutral gas heating efficiency to auroral particle
precipitation. We adopt a value of 35 eV for/XE in air and 0.6
for e in the E region [Singh and Gdrard, 1982]. The individ- ual ionization rates are derived from q(z, 0), as described by
GOrard and Rusch [1979]. The value of q0 in (5) is obtained
by normalizing
the integral of Q•, over the planet to a
specified global energy input, as discussed by Robie andKasting [this issue].
The important odd nitrogen reactions are detailed in Table
1. All ion densities
[O + 02 + N + N2 + NO + and O+(2D)]
and the N(2D) density
are solved
under
the assumption
of
photochemical
equilibrium.
The NO and N(4S) densities
are
subject to horizontal and vertical transport. The photochem-ical production and loss rates are evaluated at each time step, using the newly calculated odd nitrogen densities.
The two-dimensional model assumes diurnally averaged conditions, and the average values of photoreaction rates are
calculated from
i=
. c
where C is the fraction of day with solar zenith angle -< 90 ø,
and b is the local average
solar
zenith
angle
during
sunlight
hours.
The values
of b correspond
to a diurnally
averaged
effective column density
• = 0.670 + 70_,
+ T}N
2
with
•i = niHi Ch (Hi/R, O)
where Ch is the Chapman function, and the bar indicates a diurnal average. The solar flux for minimum levels of solar activity is used [Hinteregger, 1981], and the ionization rates are calculated according to Stewart [1970].
The temperature, composition, and circulation for solstice conditions during solar minimum that are used as back- ground properties for our model calculation are obtained from the calculations of Robie and Kasting [this issue], and they will not be discussed here. Our calculations are made for the same three cases discussed by Roble and Kasting that include (a) solar heating alone, (b) solar plus high-latitude heating for quiet geomagnetic activity, and (c) solar plus high-latitude heating for moderate levels of geomagnetic
activity. Using these background solutions, we calculate the
steady state distributions of the minor neutral constituents
N(2D), N(4S), and NO and compare
these
distributions
with
various observations. At the present time of model develop- ment there is no interaction between our minor neutral constituent model and the chemical-dynamic model of Roble and Kasting. Also, in our model we calculate the transport of
the minor neutral constituents
NO and N(4S) by vertical
molecular and eddy diffusion and by the mean meridional circulation. We neglect a possible net zonal mean transport caused by day-night asymmetries that can be defined as correlations of the diurnal meridional wind with departures
of NO and N(4S) densities
from their zonal mean values,
respectively. Also, because of the nature of the zonally averaged model, we do not include the effects of offset geomagnetic poles.
' Perhaps the greatest uncertainty in our model calculation lies in the specification of the altitude and latitude distribu- tion of the turbulent eddy diffusion coefficient. The eddy diffusion coefficient effectively transports thermospheric NO downward into the mesosphere. The vertical profile of the eddy diffusion coefficient has been derived at various lati- tudes by a number of investigators. These profiles have been used in various one-dimensional models to study the vertical
distributions of chemical species in the mesosphere and
lower thermosphere. A review of recent results was given by Allen et al. [1981]. The only two-dimensional parameteriza- tion of the eddy diffusion coefficients for the mesosphere and lower theremosphere are those given by Ebel [1980], which
are based on an analysis of wind variance and temperature
data. The eddy coefficients have been parameterized for equinox and solstice conditions, and they have been used by Solomon [1981] and Solomon et al. [1982a] to study the transport of NO from the thermosphere to the lower atmo- sphere. These eddy diffusion coefficients are listed in Table 2 in Solomon et al. [1982a], and the solstice values of the vertical eddy diffusion coefficient that we use in our model calculations are contoured in Figure la. The maximum values of the eddy diffusion coefficient occur in the mid- latitude winter hemisphere, and minimum values occur in the high-latitude summer hemisphere. We use these values in our calculation to be consistent with the study of Solomon et al. [1982a]. We, however, also consider an additional set of eddy diffusion coefficients (Figure l b)--the values used by Robie and Kasting [this issue]. All of our calculations are made with these two sets of eddy coefficient distributions, and the differences are discussed in the last section. The
boundary
conditions
are zero flux for NO and N(4S) through
the upper boundary and through the lower boundary for
N(4S). The NO flux at 70 km is taken from the study by
Solomon et al. [1982a], but the results are not essentially different from a zero flux conditions, except in the immedi- ate vicinity of the lower boundary.
RESULTS
The results for all of the cases to be discussed are for solstice conditions during solar cycle minimum. The back- ground properties for the minor neutral constituent calcula-
tion are the three cases presented by Robie and Kasting [this issue; hereinafter referred to as R-K]: (a) solar EUV heating
and ionization alone, Figures 2 and 3 of R-K; (b) solar EUV
and auroral heating ionization for quiet geomagnetic activity,
Figures 4 and 5 of R-K; and (c) solar EUV and auroral
heating and ionization for moderate geomagnetic activity, Figures 6 and 7 of R-K. The circulation, temperature, and
composition solutions for each of these cases are used as
background properties for the calculation of the minor
neutral constituent number densities with the two-dimen-
sional model described in the previous section. The numeri-
cal integration
is run for 2.6 x 10⁶
or 30 days where a quasi-
steady state is reached, except for case (c), which is discussed later.
a. Solar EUV Ionization Only
For the first calculation the neutral winds are arbitrarily
G!•RARD ET AL.' THERMOSPHERIC ODD NITROGEN 1729
(a)
K :b) •
K
I •7 I ß
5.6
'' •1
I •
5.6
-
. I00
6.0
6.0
_
'-" 5.4 5.4---• 9o
__
70
I
FT
'"""
6'2
-90 -60 -30 0 30 60 90 -90 -60 -30 0 :50 60 90WINTER LATITUDE (Degrees) SUMMER WINTER LATITUDE (Degrees) SUMMER
Fig. 1. Contours of log•o of eddy diffusion coefficients (cm -2 s -1) used in the model calculations for solstice conditions' (a) values from Ebel [1980], (b) values used by Robie and Kasting [this issue].
one-dimensional solutions, as each latitude is independent of
all others. The calculated
distribution
of N(2D) for the case
of solar ionization only is shown in Figure 2. As discussed in
the previous
section,
N(2D) is assumed
to be in photochemi-
cal equilibrium.
The maximum
N(2D) density
of 4.8 x 10⁵
cm
-3 occurs
over the summer
pole at an altitude
of 220 km.
The latitudinal
variation
of N(2D) is relatively small
until the
terminator is approached in the vicinity of 70 ø latitude in the
winter hemisphere.
The N(2D) densities
drop to small
values
in the polar night region where only a small ionization component caused by scattered EUV from the earth's geocorona is assumed.
The calculated
distributions
of NO and N(4S) for the no-
wind case are shown in Figures 3a and 3b, respectively. The
maximum
NO density
(4 x 10
7 cm -3) occurs
at 110
km at 10
ø
latitude in the summer hemisphere. Above about 130 km, thelatitudinal variation of NO densities is small from the sum- mer pole to about 30 ø latitude in the winter hemisphere. The
NO densities are primarily determined by the background
temperature and composition, the ionization rates, and verti-
cal diffusion. There is a more rapid decrease from -30 ø
latitude toward the winter pole, with an abrupt decrease at the solar terminator near -70 ø latitude. Below about 90 km the NO densities maximize in the winter hemisphere because of the larger solar zenith angles and smaller photodissocia- tion rates. In the sunlit lower thermosphere a region of minimum NO densities of about 2 x 105 cm -3 occurs near 80 km in the summer polar region as a result of the strong predissociation of NO in the •i bands. This rapid destruction of NO effectively prevents any accumulation in the summer lower mesosphere, as discussed by Solomon et al. [1982a].
The abrupt decrease in NO density poleward of 70 ø latitude in the winter hemisphere is due to the cutoff of solar ionizing
radiation in the polar night region and the neglect of both horizontal transport and aurora particle ionization for this
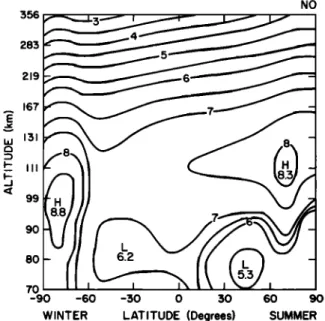
case. (a) N (aD) (b) 356 I I 219 167 E N 131 i--Ill 0••. 99 ' -
70
I
I
I •---'"r
••
I*
-90 -60 -:50 0 :50 60 90 -90 WINTER LATITUDE (Degrees)N (•O) I I o
'
---T---T;
'-__2-_
-
--
-60 -$0 0 :50 60 90SUMMER WINTER LATITUDE (Degrees) SUMMER Fig. 2. Contours of log•o of zonally averaged N(2D) number density (cm-3): (a) solar ultraviolet production only,
1730 Gl•RARD ET AL.' THERMOSPHERIC ODD NITROGEN 356 283 219 167 E LU 131 99 9O 8O (o) NO (b) N(4S) 70 -90 -60 -$0 0 30 60 90 -90 -60 -$0 0 $0 60 90
WINTER LATITUDE (Degrees) SUMMER WINTER LATITUDE (Degrees) SUMMER Fig. 3. Contours oflog•o of zonally averaged densities of odd nitrogen (cm -3) for solar ultraviolet production only and
no wind: (a) nitric oxide, (b) atomic nitrogen.
The calculated
distribution
of N(4S) for this case of no
winds is shown in Figure 3b. Maximum N(4S) densities
occur near 170 km in the summer polar region, and the
latitudinal variation is relatively small above 110 km. In the lower thermosphere below 100 km a maximum is seen at the
summer pole as a result of photolysis of NO, and the
gradient is opposite that of NO because of the changing photolysis rate with latitude. Again there is an abrupt
decrease
in the N(4S) density
poleward
of the terminator
at
70 ø latitude in the winter hemisphere.
The calculated
NO and N(4S) densities
when winds are
included in the calculation are shown in Figures 4a and 4b, respectively. The primary effect of winds is to transport bothNO and N(4S) across
the terminator
into the polar region
with subsequent downward diffusion toward the lower ther- mosphere. Above about 120 km, the winds smooth the compositional discontinuity at the terminator, and there is
now a steady latitudinal decrease from the summer pole to the winter pole. In the sunlit region of the atmosphere there
is very little noticeable effect of winds on the calculated NO
densities, as seen in comparing Figures 3a and 4a.
The calculated
N(4S) density
for the case
when winds
are
included
is shown
in Figure 4b. Above about 120 km, N(4S)
is transported by the meridional winds across the terminator into the polar night region. As with the NO densities there is a smooth latitudinal variation from the summer-to-winter
pole. Below 120
km, the N(4S)
density
decreases
rapidly
as a
result of the large NO densities that enhance the nitrogen loss rate through the "cannibalistic" reaction (9) in Table 1.
With respect to the no-wind case the NO maximum
density decreases by about 10% in the summer hemisphere
and increases by about 50% at 60 ø latitude in the winter
hemisphere because of the effect of meridional transport from the summer-to-winter polar region. At higher latitudes
near the winter pole the NO vertical distribution exhibits no thermospheric peak because the NO flows downward with- out any chemical source or sink. NO densities below 100 km
are at least one order of magnitude higher than the values in
356 283 219 167 Ld 131 I.- III (o) NO (b) N(4S) 99 9O 8O 7O -90 -60 -30 0 30 60 90 -90 -60
WINTER LATITUDE (Degrees) SUMMER WINTER
-30 0 30
LATITUDE (Degrees)
60 90 SUMMER
Fig. 4. Same as Figure 3, except that the zonally averaged wind field consistent with the composition and temperature fields is included in the transport equation.
Gi•RARD ET AL.' THERMOSPHERIC ODD NITROGEN 1731 0 167
131 3
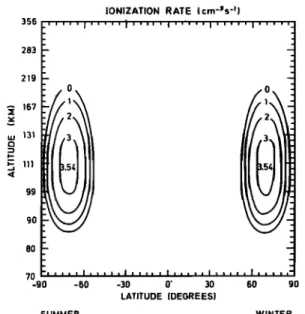
111 9o IONIZATION RATE (cm-Ss -•) 356 .... I ... i, .... i '"' '' i ... i .... 283 219 0 1 2 3 70 IlliJl''''l''''' I'''''1'•'''1'''' -g0 -60 -30 0' 30 60 90 LATITUDE (DEGREES} SUMMER WINTERFig. 5. Meridional distribution of the ionization rate (1og•o q) adopted in the model for quiet conditions.
the sunlit regions. This is, again, a consequence of the absence of photodissociation of NO by solar UV radiation. b. Solar EUV and Quiet Auroral Ionization
Robie and Kasting introduced a high-latitude ionization and heat source due to auroral processes in their model to
determine its effect on the zonally averaged circulation,
temperature, and compositional structure of the thermo- sphere for solstice conditions during solar cycle minimum. The total energy input for quiet geomagnetic activity was
assumed
to be 5 x 101øW.
The energy input was equally
divided between Joule and particle heating. The Joule heat-
ing was assumed to be 2.5 times larger in the summer hemisphere, consistent with the studies for solstice condi- tions by Dickinson et al. [1977] and Robie et al. [1977]. This increase in heating in the summer hemisphere was attributedto the larger electrical conductivity. The ionization and
heating caused by particle precipitation was equally divided
between the summer and winter hemispheres. The param- eterization of the auroral particle heating rate was discussed by R-K. The combined total ionization resulting from solar
EUV and auroral particles is shown in Figure 5 and is
derived from the particle heating distribution of R-K by
using expression (6). The maximum auroral ionization rate is 3.5 x 10 3 ions cm-3s -1 at 110 km at the center of the auroral
zone, corresponding to a particle energy flux of 0.53 ergs
cm
-2 s -• and an N2 + 391.4-nm
column
emission
rate of about
600 to 700 R, which are rather moderate values roughly equivalent to IBC I aurora. This amount of energy can be
compared
with the average
energy
flux of about 2 ergs cm -2
s -• in the nightside
oval derived
by Torr et al. [1976]
from a
global study of the electron precipitation with the Atmo-
sphere
Explorer (AE-C) satellite. The AE-C measurements
also show that during the daytime the particle energy fluxdecreases by more than an order of magnitude. Futhermore,
they include all levels of magnetic activity between Decem- ber 1973 and May 1975, whereas our value is intended to
represent fairly quiet conditions only. Consequently, our
adopted energy input is consistent with the measured global electron precipitation. The full width at half height of the
Gaussian distribution in the auroral zone is assumed to be 8.3ø; this value somewhat exceeds the typical width of the oval during quiet conditions, but it is intended to reflect the changing geographic latitude of the oval in the course of the
day as well as the offset between the geographic and
geomagnetic poles. The auroral particle ionization (Figure 5)
adds significantly to the high-latitude values in magnetically
conjugate hemispheres. The percentage ionization increase
caused by auroral particle precipitation is greater in the
winter hemisphere.
The calculated
distribution
of N(2D) for the case when
auroral ionization is included is shown in Figure 2b. The
effect
of increased
production
of N(2D) in the auroral
zone is
clearly seen in magnetic conjugate hemispheres, but, as with the ionization source, the relative increase over the solar-
produced
N(2D) distribution
is greatest
in the winter hemi-
sphere. The N(2D) is assumed
to be in photochemical
equilibrium and is therefore affected only by changes in
temperature and composition and not by the winds.
(o) 356 NO (b) N (4S) 283 219 167 iii 99 90 80 70 -90 -60 <50 O :50 60 90 -90 -60 -$O O $O 60 90
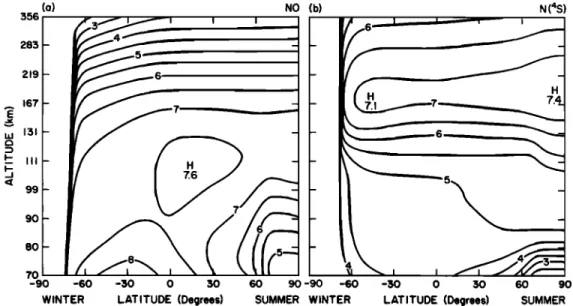
WINTER LATITUDE (Degrees) SUMMER WINTER LATITUDE (Degrees) SUMMER Fig. 6. Contours of log•o of zonally averaged densities of odd nitrogen (cm -3) for solar and particle-induced ionization
for quiet conditions' (a) nitric oxide, (b) atomic nitrogen.
1732 GI•RARD ET AL.' THERMOSPHERIC ODD NITROGEN (a) 356 • • • 219 ,-. 167' E uJ 131 i- III •0 80 70 -90 -60 -30 0 WINTER NO (b) 30 60 90 -90 -60
LATITUDE (Degrees) SUMMER WINTER
N(4S)
i i i
-30 0 30 60 90
LATITUDE (Degrees) SUMMER
Fig. 7. Same as Figure 6, except for moderately disturbed conditions.
The calculated distributions
for NO and N(4S) for the
aurora case and with winds included are shown in Figures 6a
and 6b, respectively.
After 30 days of model integration
time
the NO densities have reached steady state, with the excep-
tion of minor changes at high latitudes below 90 km. The
effect of the aurora is to increase both the NO and N(4S)
densities at high latitudes. In the summer hemisphere the NO density peaks near 110 km and 70 ø latitude with a valueof 2.4 x 10⁸
cm -3, and in the winter hemisphere
the peak is
10
9 cm -3 at 90 km and 80 ø latitude. A comparison
of Figures
4a and 6a shows that auroral particle precipitation effective- ly increases the NO densities at all altitudes in the high- latitude thermosphere. It can also be seen that the summer- to-winter meridional winds transport NO equatorward in the summer hemisphere. The NO densities decrease uniformly in latitude from the summer pole to about 40 ø latitude in the winter hemisphere. The NO densities build up poleward of -40 ø latitude as a result of auroral particle precipitation. The effect of winds and vertical eddy diffusion in the polar night region of the winter hemisphere is to transport NO down- ward toward the mesosphere. This is consistent with theresults of Solomon et al. [1982a] and Garcia and Solomon
[1983], which showed that NO is transported from the thermosphere to the mesosphere and stratosphere in the polar night region. The NO vertical density profile in the
polar night region is quite broad, similar to the high-latitude
winter profile of NO determined by $wider [1978] from ion composition measurements. In the summer lower thermo- sphere the NO densities are similar for the two cases, except in the auroral zone, where there is particle production. This indicates that horizontal transport at this level is relativelysmall and that the NO densities are controlled by photodis- sociation.
The N(4S) distribution shown in Figure 6b reveals a
complex latitudinal structure. Above about 150 km, in thesummer
polar region,
the N(4S) density
decreases
relative
to
case a shown in Figure 4b. The lower density is due to photochemistry resulting from temperature and composi-tional changes
in the background
gas, since N(4S) is in
photochemical equilibrium in this region. The maximum
N(4S) density
of 1.7 x 10
7 cm -3 occurs
at 40
ø latitude
in the
winter hemisphere
at about 180 km. The N(4S) density
of
about 10
7 cm -3 near 200 km in the summer hemisphere
is
consistent with the values derived by Engebretson et al.[1977a].
Compared
to case
a, there are also greater
N(4S)
densities in the polar night region of the lower thermosphere as a result of particle precipitation. In the upper thermo- sphere, however, the meridional wind reverses and blows from the winter-to-summer pole in a region that extends from the pole to 60 ø latitude in the winter hemispheres. This
transports
N(4S) equatorward
out of th'e polar region, and
the N(4S) density develops
a sharp latitudinal
density
gradi-
ent in the region where the oppositely directed meridionalcirculations
(Figure
4a of R-K) meet. The N(4S) latitudinal
distribution and densities in the upper thermosphere are
consistent with the zonally averaged values of atomic nitro- gen derived from the empirical model of Engebretson et al.
[1977b]. The vertical velocities, meridional winds, tempera-
ture and compositional changes, and particle precipitation all
combine
to produce
a complex
N(4S) structure
in the winter
polar region, as seen in comparing Figures 4b and 6b.
c. Solar EUV and Moderate Auroral Ionization
R-K also calculated the circulation, temperature, and
compositional
structure for assumed moderate levels of
geomagnetic
activity. They multiplied
the geomagnetic
quiet
time Joule and particle heat source
by a factor of 3, and their
results
are presented
in Figures 6 and 7 of R-K. Using these
background
properties and multiplying our auroral ioniza-
tion source
by 3, we run the model for 8 days; the calculated
NO and N(4S) distributions
are shown in Figures 7a and 7b,
respectively. Comparing Figures 6a and 7a, it can be seenthat the enhanced ionization rate increases the high-latitude
NO density. In these calculations
the thermospheric
NO
reaches a maximum of 4 x 108 cm -3 near 110 km at summer
high
latitudes
and 1 x 10
9 cm
-3 in winter high
latitudes.
The
location of the latitudinal minimum in the winter hemisphere
has shifted equatorward by about 10 ø. This shift is caused by the increase of the high-latitude, particle-induced production
of N, by the development
and equatorward
displacement
of
the boundary
of the reverse meridional
wind cell, and by the
change
in the 0/02 ratio caused
by a global redistribution
of
G!•RARD ET AL' THERMOSPHERIC ODD NITROGEN 1733 lO 9 o z l / • I I I I I I I I I I' I I I I I I I
SOLAR
UV
ONLY
(a)
.•":
QUIET CONDITIONS lb) ..' .. ." --- MODERATE CONDITIONS(c) [ :. - - i.'... • ' ..' .: ... _ ..' : : ß
'\
/
10 7 - 90 30 0 -30 -60 -90 LATITUDE (degrees) SUMMER WINTER ß . \_
AE
D'•••
-
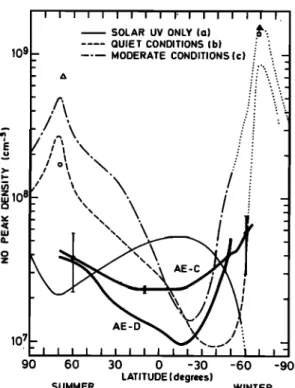
- I I I I I I I I I I I I I I I I I 60Fig. 8. Latitudinal distribution of the nitric oxide thermospheric
peak density measured with the Atmospheric Explorer C and D
satellites. ReSults of model calculations for quiet and moderate activity conditions are plotted for comparison. The dotted lines indicate regions where no NO thermospheric peak exists in the model. High-latitude nitric oxide peak densities deduced from rocket measurements of ion composition are also indicated: open
circle, June 10, 1975; open triangle, August 18, 1974; open rectangle,
February 21, 1976; filled triangle January 15, 1977 [Arnold, 1980].
dynamics
in the thermosphere
in response
to the higher
high-
latitude heating rfite. In general, the effects generated in case b by the addition of high-latitude heating and particle ioniza- tion are amplified in this case. The latitudinal gradient of nitric oxide in the lower thermosphere is also enhanced incomparison
to the low-activity case. In the dark polar region
the NO density increases at every latitude, and the vertical distribution remains nearly altitude-independent below 120 km, in the vicinity of the terminator.Comparison
of Figures 6b and 7b shows that the N(4S)
peak is still about
2 x 10
7 cm
-3, but it has shifted
equator-
ward with respect to case b. As for NO, the changes in the
distribution
of N(4S) are caused
mainly
by the enhancement
of the particle-induced
N(4S)
production
at high
latitudes
and
by the compositional changes generated by changes of the
circulation
pattern in response
to the level of energy deposit-
ed at high latitudes. The small increase of N(4S) at lowlatitudes in response to greater high-latitude heating is
consistent with the observation of Engebretson et al. [1980] and Engebretson and Mauersberger [1983].COMPARISON WITH OBSERVATIONS
The latitudinal
distribution
of the lower thermospheric
NO
densities has been investigated in detail with the UVNO experiment on the Atmospheric Explorer C and D satellites. Therefore, the AE results reported by Cravens and Stewart[1978]
and Stewart and Cravens
[1978]
provide
the best data
for comparison
with the model calculations.
Figure 8 shows
the comparison between the latitudinal gradient of the NO maximum density measured by AE and that calculated here.We have adopted
the curve, labeled group B by Cravens and
Stewart, that was obtained by averaging measurements
obtained by AE-C between days 212 and 249 and for which the mean Ap index was 23. These orbits are the nearest tosolstice conditions. The bars indicate the standard deviation
of the measured NO density. We have also plotted the
distribution
of NO in the thermosphere
as measured
by the
AE-D satellite •(T. E. Cravens, M. Lecompte, and A. I.
Stewart, private communication, 1982). The AE-D data were collected near solstice between December 1975 and Febru- ary 1976. During this period of solar minimum activity, the average magnetic activity was fairly low. The AE-D orbit was polar and nearly sun-synchronous, and the measure- ments were gathered during morning hours. The latitudinal gradient in the AE-D observations is more pronounced thanwith AE-C and extends to higher latitudes. The NO peak
density exhibits a minimum near 20 ø in the winter hemi-
sphere and shows a steeper gradient toward the winter than the summer pole. With both satellites the latitudinal cover-
age is limited to the sunlit atmosphere
as a consequence
of
the resonance scattering technique used to measure nitric oxide. The NO peak densities calculated for cases a, b, and c are plotted for comparison. The latitudinal gradient calculat-ed in model a (solar driven winds, temperature,
and compo-
sition-Figure 4) shows a maximum near the equator and
minima near 60 ø in both hemispheres.
An equatorial maxi-
mum was also produced in the model calculations by Cra- vens et al. [1979] and Ggrard et al. [1980] for equinox conditions and by Rusch et al. [ 1981] for solstice conditions, although other composition and wind models were used in those studies. This pattern is opposite to the measuredgradient and is not even observed, except under very quiet
magnetic conditions when the NO near 105 km shows a
slight equatorial bulge.
The distributions from cases b (quiet magnetic conditions,
Figure 6) and c (moderate
magnetic
activity, Figure 7) are
also plotted
in Figure 8. Since the NO density
peak is loosely
defined or nonexistent
in Figures 3a, 4a, 6a, and 7a pole-
ward of $0 ø in the winter hemisphere, the density at 105 km is used in this plot for these regions. The distributions for casesb and c are quite different
from case a but not significantly
different from each other. The most conspicuous
difference
is the value of the peak densities in the auroral zones and thesteeper rise at winter mid-latitudes in case c. It is clear that
the models
that include the effects
of particle precipitations
yield a latitudinal distribution
more closely resembling
ob-
servations
than that of the solar-driven
model. The major
discrepancies
are the precise
location
of the low-latitude
dip
as well as the absolute
densities
in the summer
hemisphere.
These differences
should not be considered
as significant
in
this study, which is mostly concerned with the main featuresof the global NO distribution.
It is likely that minor changes
in the eddy diffusion coefficient field and/or undetermined chemical parameters would still improve the agreement between models and observations, but this problem lies outside the scope of this study. Furthermore, the AE obser- vations were not made exactly at solstice nor in the samemagnetic conditions as the models. The model calculations
describe a near steady state, which may not describe accu- rately the average of a succession of quiet and disturbed periods. More importantly, the AE observations are limited to daytime, whereas the present model represents diurnal
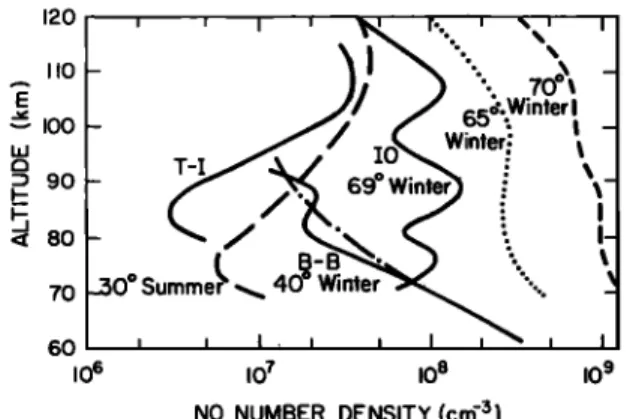
1734 Gi•RARD ET AL.: THERMOSPHERIC ODD NITROGEN
120
.-. I10
-
OOX•
-
E
•,// •
65•t.
Winterl
,oo-
•/'7//..
Winte70
•Oø
Summe•
• 40
ø
Winter•
"....
60 • • I • • I • • •
•O 6 •O z •O e •O 9
NO NUMBER DENSITY (c• 3)
Fig. 9. Medical distribution of nitric oxide measured with rock-
ets in solstice conditions at various latitudes. •oJJd lines indicate
measured distributions by Tohmat;. a.d l•agami [•976] (T-D, Beta. a.d Ba.gert [•979] (•-•), and I•agami a.d Oga•a [•980] 0- O). The calculated profiles for case b are shown at 30 ø summer (dashed line); 40 ø winter (dashed and dotted line); 65 ø winter (dotted line); and 70 ø winter (sho•-dashed line) for comparison.
sphere was recently investigated by Rusch and Sharp [1981]. The magnitude of this variation is latitude-dependent and restricts the comparison with observations to trends rather than absolute values. The Atmospheric Explorer NO densi- ties at high latitudes are smaller than those calculated for
cases b and c with the model. They are also smaller than the
bulge of nitric oxide densities derived in the auroral zones from ion composition data [Swider and Narcisi, 1977; Ar- nold, 1980] and rocketborne ultraviolet spectrometer data [Iwagami and Ogawa, 1980]. The four NO peak densities measured during solar minimum conditions are shown in Figure 8. These rocketborne ion spectrometer measure-
ments were made near solstice in Northern Europe. They
give NO densities
between
1.7 x 10⁸
and 7 x 10⁸
cm
-3 in
summer, in better agreement with the two-dimensional cal-
culations than the AE values. Winter densities are between
1.4 x 10⁹
and 1.5 x 10⁹
cm -3, very close
to the results
of the
case c calculation.
The fair agreement between models and observations for very quiet conditions on one hand and quiet or moderately
disturbed conditions on the other hand clearly indicates the
need for high-latitude heat and ionization sources during even fairly quiet magnetic conditions. The thermospheric
NO maximum in the auroral zones is caused by the enhanced
production of odd nitrogen in the regions subject to particle precipitation, as was previously established by various stud-
ies. This model demonstrates that the dynamical effects that control the background composition and the temperature
also affect the NO distribution equatorward and poleward of the auroral zone. Figure 9 illustrates the comparison be- tween three nitric oxide density profiles measured with rockets at the solstice period and at different latitudes. They were selected to represent typical distributions in solar
minimum conditions and exhibit fairly characteristic differ-
ences in the shape of their distributions below 110km. They were obtained during fairly magnetically quiet conditions. The summer profile measured by Tohmatsu and Iwagami
[1975] in August 1973 was obtained at 31 ø north (Ap = 9).
The thermospheric
peak reaches
about
3 x 10⁷
cm
-3 at 108
km. This distribution shows the density dip in the meso-
sphere typical of other summer profiles and is very similar to the equinox distribution measured at mid-latitude by Baker
et al. [1977] or near the equator by Tohmatsu and Iwagami
[1976].
A winter mid-latitude profile was obtained by Beran and Bangert [1979] on January 4, 1976, at 38 ø N (Ap = 10). This
profile shows a loosely defined maximum near 87 km, a weak mesospheric dip, and mesospheric densities larger than the summer profile by Tohmatsu and Iwagami [1975].
The density in the mesospheric valley near 85 km is about five times larger than the summer profile of Tohmatsu and
Iwagami [ 1975].
The third distribution in Figure 9 was measured by Iwa-
gami and Ogawa [1980] on August 10, 1977, at 69 ø S (Ap -
12). This high-latitude winter profile is quite different from
the other two experimental curves and other lower-latitude measurements. It essentially shows a nearly constant densi-
ty of 1 x 108 cm -3 between
70 and 100 km, with a rather
moderate peak near 89 km. It is very likely that the particularshape of this curve is a consequence of the fact that it was measured in the winter auroral zone.
The three vertical distributions calculated with the model
for quiet magnetic conditions and using Ebel's eddy coeffi- cients (Figure 1 a) are plotted in Figure 9 for the same latitude
as the experimental profiles. Discussion
The results described earlier clearly demonstrate that the odd nitrogen distribution is controlled by various factors. It
has been shown from a comparison of the NO density fields
given in Figures 3, 4, 6, and 7 that the neutral winds, the
atmospheric composition and temperature, and the level of
particle-induced ionization control the nitric oxide distribu-
tion in a complex manner. The eddy diffusion coefficent K, formally defined in (4), also plays a significant role in
controlling the NO distribution. Eddy diffusion becomes the major process for vertical transport below the turbopause where vertical winds have low velocities in our model. Consequently, eddy diffusion regulates the downward trans- port of NO from the thermosphere into the mesosphere and eventually to the stratopause. All three cases modeled so far
were treated by using Ebel's [1980] grid of Kzz values
contained in Figure la. To investigate the sensitivity of the model to the choice of K, the calculations described before were repeated with the set of eddy diffusion coefficients used by R-K. As described by R-K, their coefficients were based on the vertical profile determined from the one-dimensional study of Allen et al. [1981], with an additional term-- constant with altitude and Gaussian in latitude--added to maximize at the equator (Figure 1 b). These coefficients were needed to maintain the atomic oxygen concentration and calculated 555.7-nm green-line emission rate at the observed values. When the Ebel [1980] coefficients were used in the calculation, atomic oxygen recombined at a too rapid rate, allowing the calculated densities to fall below the observed values. This difference in the eddy diffusion coefficients for
NO and O was noted by Solomon et al. [1982a]. $choeberl et' al. [1983] recently found that the vertical eddy diffusion
coefficients for NO and O are sensitive functions of their respective chemical loss rates in the mesosphere and lower thermosphere, thus accounting for the different K values
needed to model these species. Figure 11 shows the nitric
oxide distribution calculated with the R-K K coefficient for the case of quiet magnetic conditions (case b). Only small