1198 • American Journal of Botany 105(7): 1198–1211, 2018; http://www.wileyonlinelibrary.com/journal/AJB © 2018 Botanical Society of America Interspecies associations have extensive implications for evolutionary
and ecological success in all ecosystems, as organisms are constantly being shaped by their biotic and abiotic interactions (Thompson, 2005). Of the many types of interactions among organisms, obligate mutualistic relationships represent some of the closest and most intimate associations (Boucher et al., 1982). Dependence by one symbiotic partner can impose selective forces on both partners (i.e., coevolution). These interactions are mediated by abiotic factors (e.g., climate) and can differ greatly geographically (Thompson, 2005).
Lichens have long been considered and studied as model exam-ples of mutualistic symbioses (Nash, 2008). With rare exceptions in Ostropales (Wedin et al., 2004; Baloch et al., 2010) where a loss of lichenization occurred (Lutzoni et al., 2001), the fungal partner
(mycobiont) is always found in nature in association with a photo-synthesizing partner (photobiont). In some cases, a secondary myc-obiont (e.g., Basidiomycota yeast; Spribille et al., 2016) or photmyc-obiont (e.g., green alga and cyanobacterium together; Miadlikowska and Lutzoni, 2004) is part of the same lichen thallus. Because lichens are associations between heterotrophs (fungi), photoautotrophs (green algae and cyanobacteria), and sometimes organisms that fix atmospheric dinitrogen (cyanobacteria [Hodkinson et al., 2014; Darnajoux et al., 2017] and members of the Rhizobiales [Hodkinson and Lutzoni, 2009; Hodkinson et al., 2012]), they are ecologically successful in a wide variety of environments, including inhospitable areas such as hot deserts and cold polar regions (Cornelissen et al., 2001; Nash, 2008).
Bioclimatic factors at an intrabiome scale are more limiting
than cyanobiont availability for the lichen- forming genus
Peltigera
Jade Lu1, Nicolas Magain1, Jolanta Miadlikowska1,4 , Jessica R. Coyle2, Camille Truong1,3, and François Lutzoni1
Manuscript received 4 February 2018; revision accepted 25 April 2018.
1 Department of Biology, Duke University, Durham, North Carolina 27708, USA
2 Department of Biology, Stanford University, Stanford, California 94305, USA
3 Instituto de Biología, Universidad Nacional Autónoma de México (UNAM), C.P. 04510, Mexico City, Mexico 4 Author for correspondence (e-mail: jolantam@duke.edu)
Citation: Lu, J., N. Magain, J. Miadlikowska, J. R. Coyle, C. Truong, and F. Lutzoni. 2018. Bioclimatic factors at an intrabiome scale are more limiting than cyanobiont availability for the lichen- forming genus Peltigera. American Journal of Botany 105(7): 1198–1211. doi:10.1002/ajb2.1119
PREMISE OF THE STUDY: Factors shaping spatiotemporal patterns of associations in mutualistic
systems are poorly understood. We used the lichen- forming fungi Peltigera and their cyanobacterial partners Nostoc to investigate the spatial structure of this symbiosis at an intrabiome scale and to identify potential factors shaping these associations.
METHODS: Ninety- three thalli were sampled in Québec, Canada, along a south–north and an
east–west transect of ~1300 km each. We identified the two main partners (Peltigera species and Nostoc phylogroups) using molecular markers and modeled the effects of environmental variables and partner occurrence on Peltigera–Nostoc distributions.
KEY RESULTS: Peltigera species showed a high degree of specialization toward cyanobionts,
whereas two Nostoc phylogroups dominated both transects by associating with several
Peltigera species. Peltigera species had narrower ranges than these two main cyanobionts.
Distributions of three Peltigera species were highly associated with precipitation and temperature variables, which was not detected for Nostoc phylogroups at this spatial scale.
CONCLUSIONS: For these cyanolichens, factors driving patterns of symbiotic associations are scale dependent. Contrary to global- scale findings, generalist Peltigera species were not more widespread within the boreal biome than specialists. Nostoc availability was not the only driver of Peltigera species’ geographic ranges; environmental factors also contributed to their intrabiome distributions. Climatic conditions (especially precipitation) limited the range of some Peltigera species more than the range of their cyanobacterial partners at an intrabiome (boreal) scale.
KEY WORDS boreal biome; cyanobiont; factors shaping spatial symbiotic associations;
The study of interspecies specificity (here restricted to the main lichen partners), defined as the number of partner species that are selected by one species throughout its geographic range, is essential for a comprehensive understanding of the lichen sym-biosis (Otálora et al., 2010) and other symbioses in general. The specificity of lichen- forming fungal species and their main pho-tobionts ranges from strict specialists (associating with only one species) to moderate specialists (associating consistently with a few species) to broad generalists (associating with many spe-cies with little or no apparent selectivity). In general, the fungal partner of lichens has a higher degree of specificity in choos-ing a photobiont than the photosynthetic partner, which has a lower degree of specificity toward mycobionts (e.g., Paulsrud and Lindsblad, 1998; Yahr et al., 2004; O’Brien et al., 2013; Magain et al., 2017a).
There are advantages and disadvantages at both ends of the spec-trum. Higher specificity is thought to allow a partner to optimize the benefits obtained from the other partner, while low specificity can allow a partner to occupy more ecological niches (de Vienne et al., 2013). Although it is not entirely clear why mycobionts are usually specialists whereas photobionts are often generalists, sev-eral factors seem to be implicated in this pattern. It has been hy-pothesized that abundance can determine interaction frequency between species, because a relatively abundant species will have fre-quent encounters with many other individuals of different species (Vasquez et al., 2007). Photobionts are much more widespread and common than their mycobiont counterparts (Werth, 2011), which may lead to increased interaction frequency and generalist behav-ior. Interaction frequency can be considered a proxy for ecological effect, given that the most prevalent entity in a biological system is thought to create disproportionate influence (Vermeji, 1999, 2004). This is found to be the case in lichens especially at a small spatial scale, as photobionts are thought to have disproportionate influ-ence over mycobionts, such that mycobionts are more dependent on photobionts for survival (Magain et al., 2017a; Chagnon et al., 2018). Mycobionts thus often experience stronger pressure to adapt to a photobiont, which may contribute to their specificity (Chagnon et al., 2018).
Because these factors are not the only ones in play, the general trend of high mycobiont specificity and low photobiont specificity is not always observed. Mycobiont species have been found to as-sociate with multiple photobiont phylogroups, which were used as proxies for species in the case of cyanobacteria (e.g., O’Brien et al., 2005; Magain et al., 2017a, b). The drivers of variation in interac-tion specificity have yet to be fully elucidated, but this variainterac-tion has been linked to an interplay of genetically and environmen-tally based factors. For example, a harsher regional climate may result in selective pressures toward greater flexibility in mycobiont partner choice (Wirtz et al., 2003; Pérez- Ortega et al., 2012; Singh et al., 2016). When a mycobiont lineage is colonizing a new bioge-ographic zone with a different set of potential partners, flexibility in partner selection may be more beneficial, initially, than being a strict specialist (Singh et al., 2016; Magain et al., 2017a). However, long periods of evolutionary time may shift the pattern toward specialization, as the mycobiont experience differential fitness with different partners under the same environmental conditions. This may result in a mycobiont species associating selectively with one or a few closely related and ecologically adapted (e.g., to wa-ter or sun exposure) photobiont phylogroups (Peksa and Škaloud, 2011; Magain et al., 2017a).
The genus Peltigera Willd. presents an interesting system for analyzing association specificity and has been the subject of sev-eral evolutionary studies at different temporal and spatial scales, designed to reveal patterns of association between symbionts. Some Peltigera species are strict specialists (i.e., only found to associate with one Nostoc Vaucher ex Bornet and Flahault phy-logroup throughout their distribution), while others are broad generalists and associate with many Nostoc phylogroups (Magain et al., 2017a).
According to the worldwide study by Magain et al. (2017a, b), the geographic ranges of highly specialized Peltigera species in section
Polydactylon seem to be limited by their partnering Nostoc’s
distri-bution, whereas generalist Peltigera species, or species associating with different phylogroups in different regions (local specialists; as reported by Blaha et al. [2006] and Nelsen and Gargas [2009]), can spread across wider and more diverse geographic regions through their multiple associations. At a global geographic scale, distribu-tions of Nostoc phylogroups seem to be highly dependent on cli-matic factors (Magain et al., 2017a).
A key element in understanding the evolution of generalist lichen- forming fungi may be host switches from one photobiont to another when they reach the limit of the distribution of one pho-tobiont, resulting in an extension of the mycobiont’s distribution range (de Vienne et al., 2013). This may be the predominant evo-lutionary mechanism shaping symbiotic associations, given that cospeciation, in which the two partners diverge together, appears to be relatively rare (de Vienne et al., 2013; Singh et al., 2016). This is supported by Magain et al. (2017a), in that some Peltigera spe-cies seem to switch among a few closely related Nostoc phylogroups from biome to biome but do not cospeciate. On a smaller and less variable geospatial scale, different evolutionary mechanisms might be at play (i.e., mycobiont selectivity and ranges of cyanobiont part-ners may not be the limiting factors of distribution as is the case at a global spatial scale).
We analyzed patterns of association of Peltigera species and their Nostoc partners (identified on the basis of ITS and rbcLX loci, respectively) along two transects of nearly 1300 km each (south– north and east–west) in the boreal biome. We examined potential drivers (environmental variables vs. presence of symbiont vs. both factors) of each partner’s distribution using linear mixed models. Specifically, we sought to answer the following questions: (1) Does the distribution of Nostoc phylogroups determine the distribution of Peltigera species in the boreal biome? (2) Does an abiotic climatic gradient drive patterns of associations or symbiont distributions in this biome? (3) Do global patterns of association and specificity hold true within this biome?
MATERIALS AND METHODS
Sampling
In August 2011, sampling was conducted along two transects (south–north [SN] and east–west [EW]) that crossed the circum-boreal belt in Québec, Canada. On the SN transect, there were nine major equidistant localities (~160 km apart) ranging from 46.77°N, 73.01°W (SN1) to 57.91°N, 72.98°W (SN9), spanning ~1300 km from the southern limit of the boreal biome (Canadian Shield) to the tree limit (Fig. 1). Specimens of Peltigera were found and collected in eight localities (Appendix 1), from the
second- most southern locality (SN2: 48.63°N, 73.04°W) to the northernmost locality (SN9: 57.83°N, 73.19°W). Within each of these eight localities, sampling was systematically conducted at three sites (west [W], central [C], and east [E]) arranged linearly and separated by 3.2 km from the central site. Within each of the three sites we explored three clusters (W1, W2, W3; C1, C2, C3; E1, E2, E3) of 20 m in diameter each, placed ~10 m apart. The EW transect was located roughly at the latitude of SN4 (51.03°N). The central locality along the EW transect (EW0: 51.11°N, 68.52°W) was ~320 km to the east of SN4 (Fig. 1). East–west localities ranged from 2.4 km (1.5 miles) to 640 km (400 miles) away from EW0. The EW transect spanned ~1300 km from the westernmost (W400: 50.28°N, 77.50°W) to the easternmost locality (E400: 51.68°N, 59.15°W). Peltigera specimens were found and collected from 11 localities ranging from W100 (50.53°N, 70.74°W) to E200 (51.28°N, 63.84°W). Along the EW transect, each locality was represented by only one site (C), and similar to the SN tran-sect, we explored three clusters (C1, C2, C3) of 20 m in diame-ter each, placed ~10 m apart. Lobes were taken from 93 Peltigera thalli from these 19 localities (35 sites and 105 clusters) and air
dried before processing for molecular work. All these specimens were deposited at DUKE (Appendix 1).
Data collection
DNA was extracted from 77 lichen specimens (16 specimens were already included in Magain et al. [2017a]) using a standard phenol- chloroform DNA isolation protocol with 2% SDS buffer (Zolan and Pukkila, 1986). The internal transcribed spacer (ITS) of the nu-clear ribosomal RNA tandem repeats was selected to characterize mycobiont populations because it is highly variable at the species level in Peltigera (Miadlikowska et al., 2003; O’Brien et al., 2009) and has been used as a universal DNA barcode for fungi (Schoch et al., 2012). This region was amplified successfully for 74 specimens using polymerase chain reaction (PCR) with the primers ITS1F (Gardes and Bruns, 1993) and ITS4 (White et al., 1990) following Magain et al. (2017a).
For the cyanobacterial photobiont Nostoc, rbcLX—which in-cludes the last 82 amino acids of the RUBISCO large subunit (rbcL), a putative chaperone gene (rbcX), and two intergenic spacers (Li
FIGURE 1. (Top right) The two physical maps show precipitation and temperature gradients in the area spanned by the south–north (SN) and east– west (EW) transects. Sampling localities along both transects are represented by abbreviations SN1–SN9 and W400–E400. (Left and bottom) Vertical and horizontal bands show Peltigera spp. distributions and associations with Nostoc cyanobionts across the latitudinal (SN) and longitudinal (EW) transects in Québec, Canada. Some localities, such as SN1, W400, and E400, are not shown because no Peltigera thalli were found at those localities.
Peltigera species are labeled and their ranges are represented by solid lines. Colored bands represent Nostoc phylogroups as shown in the key and in
Fig. 3. Black dots indicate specimens for which both partners, mycobiont and cyanobiont, were identified on the basis of ITS and rbcLX sequences, re-spectively. Colored dots represent specimens with missing ITS (red) or rbcLX (green) sequences. Longitude of W200 is approximated by the longitude of SN4 as shown by the large gray star, which also depicts where the EW transect crosses the SN transect.
P.P P oc cidii e d d ntatt lil lisi P. neopolydact yla 4 P. aph thosa P. scab rosa 1
SN9
SN8
SN7
SN6
SN5
SN4
SN3
SN2
W12.5 W6 W3 W1.5 W25W200
W100
W50
EW0
E
5
0
E
1
0
0
E200
P. ma lacea 2 P. scabrosa 4 P. scabrosa 1 P. scabrosa 2 P. neopolydactyla 4 P. aphthosa P.cf. sca brosa 2 Nostoc phylogroup IVNostoc phylogroup XIa Nostoc phylogroup III
Nostoc phylogroup VIId Nostoc phylogroup VIIa
P.Pne op o olylyyd a d d ctytylylal 1 P. neopolydactyla 1 SN9 SN8 SN7 SN6 SN5 SN4 SN3 SN2 SN1 W200 W40 0 W100 W50 W25 W1.5 EW0
E50 E100 E200 E400
SN9 SN8 SN7 SN5 SN4 SN3 SN2 SN1 W20 0 W40 0 W10
0 E100 E200 E400
EW0 W50 E5 0 W25 - W1 .5 SN6
Total Precipitation in the Warmest Quarter (mm) Mean Temperature of the Warmest Quarter (°C)
P. P Poc cidiidde ntttalilsii P. malacea 5 P. malacea 2 XIa VIIa IV XIa IV VIIa VIId XIa III
and Tabita, 1997)—was amplified and sequenced for 75 specimens using the primers CX and CW (Rudi et al., 1998) as described in O’Brien et al. (2013). Both ITS and rbcLX were successfully se-quenced for 72 of the 77 sampled specimens.
The PCR products were purified with ExoSAP (Afymetrix, Santa Clara, California, USA) following the manufacturer’s pro-tocol and sequenced as described in Magain et al. (2017a) at the Duke Genome Sequencing and Analysis Core Facility of the Institute for Genome Sciences and Policies. All newly generated ITS (74 sequences) and rbcLX (75 sequences) data were deposited in GenBank (Appendix 1). Sequences of each locus (ITS and rbcLX) from 16 specimens were already deposited in GenBank by Magain et al. (2017a).
Alignments
All sequences were subjected to BLASTn searches (Wheeler et al., 2007) to confirm the fungal or cyanobacterial origin of each se-quence fragment. They were assembled (visually inspected and manually corrected when necessary) using Sequencher version 5.0.1 (Gene Codes Corporation, Ann Arbor, Michigan, USA) and aligned using MacClade version 4.08 (Maddison and Maddison, 2005). The “Nucleotide with AA color” option was used for guid-ing the rbcLX alignment. Sequencguid-ing reactions of rbcLX produced clean reads without evidence of secondary peaks, suggesting that a single photobiont genotype dominated in each of the lichen thalli. Ambiguously aligned regions were delimited manually following Lutzoni et al. (2000) and were excluded from phylogenetic analyses. Phylogenetic analyses
We assembled a dataset consisting of 319 rbcLX sequences of free- living and symbiotic Nostoc spp. from GenBank in addition to the 16 already published and 75 newly generated sequences from the tran-sects, for a total of 410 rbcLX sequences. Both spacers in rbcLX were too variable to be unambiguously aligned across the alignment and were removed from subsequent phylogenetic analyses (696 sites). The final matrix contained 621 nucleotide sites. Maximum likeli-hood searches for the optimal trees and bootstrap analyses of the cyanobiont sequences were conducted using RAxML version 8.2.10 (Stamatakis, 2006; Stamatakis et al., 2008) as implemented on the CIPRES portal (Miller et al., 2010). These searches were conducted with the rapid hill- climbing algorithm for 1000 replicates with the general time reversible (GTR) substitution model (Rodríguez et al., 1990) and gamma distribution parameter approximated with four categories in all analyses. A partition of three subsets correspond-ing to the first, second, and third codon position of the rbcLX was defined.
Haplotype network
Following previous studies (Magain et al., 2017a, b; J. Miadlikowska, unpublished data, for section Peltidea), mycobiont species were identified on the basis of their ITS sequences. Separate ITS align-ments were prepared for haplotype network analyses on the two
Peltigera sections, Polydactylon Miadlikowska and Lutzoni (798
nucleotide sites) and Peltidea (Ach.) Vain. (691 nucleotide sites). The delimitation of the sections of the genus follows Miadlikowska and Lutzoni (2000). Because haplotype network analyses were re-stricted to each species or small group of closely related species
separately, no ambiguity was found in these subalignments and, consequently, all nucleotide sites were used to infer haplotype net-works. Haplotype networks were generated using TCS version 1.21 (Clement et al., 2000) based on 69 mycobiont ITS sequences from section Polydactylon and 21 mycobiont ITS sequences from section
Peltidea. We used a parsimony criterion with the 0.95 threshold
value, and gaps were considered as a fifth character state. Modeling Peltigera–Nostoc distribution
For each Peltigera species that occurred in at least six clusters (P.
aphthosa, P. neopolydactyla 1, P. occidentalis, P. scabrosa 1, and P. scabrosa 2), we modeled the probability of species presence
across the study region as a function of climate and the presence of observed Nostoc symbiont phylogroups using generalized linear mixed models. We fit three types of models for each species: (1) an environment- only model with linear and quadratic effects of tem-perature and precipitation from the warmest three months of the year, in which quadratic effects were constrained to be negative so that species responses are concave- down; (2) symbiont- only mod-els, which estimate the effect of each potential Nostoc symbiont’s presence on the probability of presence; and (3) full models that combine each symbiont- only model with the environment- only model and also include interactive effects of symbiont presence on the response of Peltigera species to environmental variables. All models used a Bernoulli likelihood with logit link function and in-cluded a random intercept for the effect of locality (to model spatial autocorrelation). We used weakly informative normal and half- normal priors for coefficients and a weakly informative half- Cauchy prior on the standard deviation of the normally distributed random effect of locality. For comparison, we fit the same set of models for each Nostoc phylogroup that occurred in at least six clusters (Nostoc phylogroups IV, VIIa, and XIa). In this case, the symbiont- only models assess the effect of Peltigera species presence on the proba-bility of a Nostoc phylogroup’s presence.
Climate data were obtained from WorldClim (http://worldclim. org/version2), which interpolates and averages weather station data from 1970 to 2000. We chose total precipitation and mean tem-perature during the warmest quarter as measures of water availa-bility and thermal environment because these two variables were less correlated than other, similar measures (r = 0.38) and because they represent environmental conditions when these lichen thalli are metabolically active. We coded models in Stan (Carpenter et al., 2017) and estimated parameters with the MCMC “No- U- Turn” sampler using the R package “RSTAN” (Stan Development Team 2017) and three sampling chains. Model convergence was checked with standard diagnostic tests, and sampling chains were run until all parameters obtained ≥1000 effective samples. Models were com-pared with Akaike weight (WAIC) and area under the ROC curve (AUC). Effects of environmental variables were determined visually from plots of conditional posterior predictive distributions.
RESULTS
Data collection
We generated 149 new sequences: 74 ITS sequences from Peltigera and 75 rbcLX sequences from Nostoc. Both ITS and rbcLX were ob-tained for a total of 72 lichen specimens, while two specimens yielded
only ITS sequences, and three specimens yielded only rbcLX sequences (Appendix 1). Overall, for the 93 lichen specimens collected along both transects, including already pub-lished sequences, 90 ITS sequences of the mycobionts and 91 rbcLX sequences of the cyanobionts were included in this study. A total of 88 thalli were represented by se-quences of both partners (Appendix 1).
Along the SN transect, mean temperature in the warmest quarter ranged from 15.8°C at the second- most southern locality (SN2) to 11.4°C at the most northern locality (SN9). Total precipitation during the warmest quar-ter ranged from 181 mm at SN9 to 326 mm at SN3 (Fig. 1). Although less variable, climatic factors were not entirely even longitudinally. Temperature ranged from 11.5° to 13.1°C, and precipitation ranged from 309 mm to 354 mm within the EW transect (Fig. 1). Peltigera haplotype network
In total, nine Peltigera species (sensu Magain et al., 2017b) belonging to sections Peltidea and Polydactylon (Miadlikowska and Lutzoni, 2000) were detected in the sampled material for this project (Fig. 2). These nine species represent five traditional morpho- species names: Peltigera aphthosa (L.) Willd.,
P. malacea (Ach.) Funck, P. neopolydactyla
(Gyeln.) Gyeln., P. occidentalis (A.E. Dahl) Kristinsson, and P. scabrosa Th. Fr. Section
Polydactylon included 71 specimens from six
species (Fig. 2), which were identified in ac-cordance with Magain et al. (2017b) on the basis of ITS sequence comparisons. There were six specimens of Peltigera
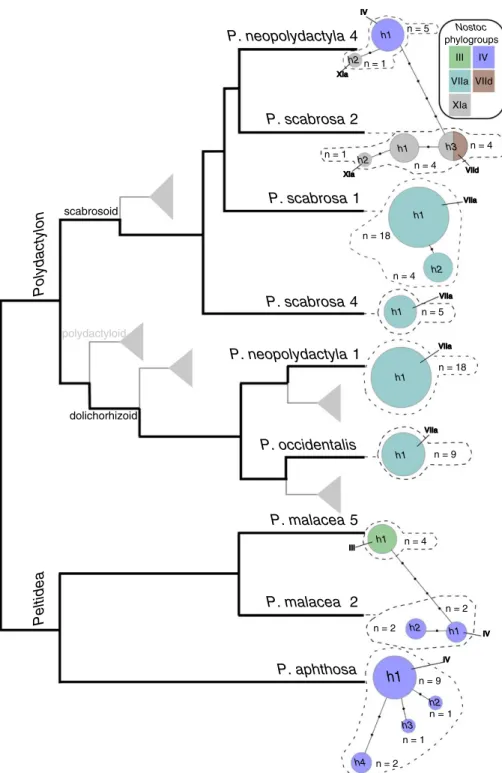
neopolydac-tyla 4, representing two haplotypes separated
by one mutation. One of the two haplotypes was prevalent because it was found in five of the six specimens sampled for this spe-cies (Fig. 2). The nine sequenced specimens of P. scabrosa 2 belong to three haplotypes, two common (n = 4) and one rare (n = 1; Fig. 2). Peltigera scabrosa 1 encompassed 22 sequenced specimens (Fig. 2), which split into two haplotypes: one common haplotype found in 18 specimens and a less common haplotype found in four specimens. A total of five specimens were identified as P.
sca-brosa 4, all belonging to the same haplotype.
Similarly, P. occidentalis and P.
neopolydac-tyla 1 were represented by one haplotype
comprising nine and 18 specimens, respec-tively (Fig. 2).
Section Peltidea accounted for a total
of 22 specimens representing three species (Fig. 2), which were identified in accordance with Miadlikowska and Lutzoni (2000) and more recent analyses (J. Miadlikowska, unpublished data)
based on ITS sequence similarity. Peltigera aphthosa encompassed 14 specimens (one was identified based solely on morphology), representing four haplotypes with one being prevalent (n = 9).
FIGURE 2. Schematic cladogram (in black) depicting relationships among nine putative
Peltigera species from two sections, Peltidea and Polydactylon, sampled for this study (adapted
from Magain et al., 2017a; J. Miadlikowska, unpublished data). Gray lines and triangles indicate placements of the remaining species included in section Polydactylon (Magain et al., 2017a, b), not sampled in this study. ITS haplotype networks of sampled Peltigera species are shown at the tip of the terminal branches. Each circle represents a unique ITS haplotype, and its size is propor-tional to the number of included specimens (n); black dots indicate the number of mutations between haplotypes. Colors represent, proportionally, the Nostoc phylogroups (as delimited in Fig. 3) associated with each Peltigera haplotype.
P. aphthosa h1 h2 h3 h4 P. malacea 5 h1 h2 P. neopolydactyla 1 h1 h1 P. occidentalis h1 P. scabrosa 4 P. scabrosa 1 P. scabrosa 2 P. neopolydactyla 4 h1 h2 h3 h1 n = 9 n = 2 n = 1 n = 1 n = 2 n = 2 n = 4 n = 18 n = 9 n = 5 n = 1 n = 4 n = 4 n = 5 Polydactylon Peltide a h2 n = 1 h1 h2 n = 18 n = 4 P. malacea 2 h1 scabrosoid polydactyloid dolichorhizoid Nostoc phylogroups III IV VIIa VIId XIa IV XIa XIa VIId VIIa VIIa VIIa VIIa III IV IV
Specimens of P. malacea sensu lato corresponding to P. malacea 2 (J. Miadlikowska, unpublished data) are represented by four sequences from two haplotypes, while all four specimens of P.
malacea 5 (J. Miadlikowska, unpublished data) had identical ITS
sequences (Fig. 2). Nostoc identity
Based on the global rbcLX phylogeny of Nostoc (Appendix S1, see Supplemental Data with this article), a total of five phylogroups from
Nostoc clade 2 (sensu Otálora et al., 2010) were identified in
accord-ance with O’Brien et al. (2013) and Magain et al. (2017a) (Fig. 3). These phylogroups were well supported (bootstrap values >70%), except for phylogroup IV. Nostoc phylogroups III and IV, both from
Nostoc clade 2, subclade 2, were found in four and 22 specimens,
respectively (Figs. 2 and 3). Within subclade 3, which contains most lichenized cyanobacteria (Otálora et al., 2010; Magain et al., 2017a),
Nostoc phylogroup VIIa was the most commonly sampled (from
54 specimens), whereas closely related phylogroup VIId was found only in two specimens and the more distant Nostoc phylogroup XIa was found in eight thalli (Figs. 2 and 3).
Peltigera–Nostoc associations
The nine Peltigera species and five Nostoc phylogroups formed 11 symbiotic pairs. Nostoc phylogroups were found to be symbionts of one to four Peltigera species, whereas Peltigera species were found in association with one or two phylogroups (Figs. 1 and 2). At the section level, the six species from section Polydactylon are associated with nearly all Nostoc phylogroups, except phylogroup III (Figs. 2 and 3). All sequenced specimens of P. scabrosa 1 (n = 22), P. scabrosa 4 (n = 5), P. neopolydactyla 1 (n = 18), and P.
oc-cidentalis (n = 9) were found in association only with phylogroup
VIIa. Peltigera scabrosa 1 spanned almost the entirety of both tran-sects as one of the most widespread species in this sampling (i.e., across SN2–SN8 in latitude and W100–E100 in longitude) (Fig. 1). Individuals of P. scabrosa 4 were found only in the northern portion of the SN transect (SN6–SN9), and this species was not collected on the longitudinal transect that is located approximately at the lati-tude of SN4 (Fig. 1). Peltigera neopolydactyla 1 ranged from SN3 to SN6 and from W100 to E100 (Fig. 1), whereas P. occidentalis ranged from SN5 to SN9 and from W100 to E200. Both were thus fairly widespread, especially on the EW transect.
Specimens of P. scabrosa 2, which were confined to the northern portion of the SN transect (SN8 and SN9), occurred in association with two cyanobionts, Nostoc phylogroups XIa and VIId (Figs. 1 and 2). An individual collected at E200, morphologically identified as P. scabrosa 2, was found in association with a cyanobiont from phylogroup XIa. Given that the latitude of the EW transect can be roughly approximated by the latitude of SN4, E200 was the most southern point at which P. scabrosa 2 was found. Unfortunately, the identification of this specimen at E200 could not be confirmed with DNA sequencing because the ITS sequencing failed.
Peltigera neopolydactyla 4 was restricted to the southern parts
of the SN transect, with samples collected at the most southern lo-cality, SN2. However, P. neopolydactyla 4 was found multiple times on the EW transect and ranged from E200 to W100, and was also present in the SN transect, corresponding approximately to W200 in longitude. These specimens associated with phylogroup IV, with one exception of an individual collected at W100 that was found in association with phylogroup XIa (Figs. 1–3).
Species from section Peltidea associated with two Nostoc phy-logroups (III and IV; Figs. 2 and 3) from clade 2, subclade 2 (section
Peltidea was not found in association with cyanobionts from
sub-clade 3). All sequenced P. aphthosa samples were associated with
Nostoc phylogroup IV. Distribution of these specimens ranged from
SN4 to SN9 on the latitudinal transect and from W100 to E200 on the longitudinal transect. Peltigera malacea 2, also associated with
Nostoc phylogroup IV, spanned SN6–SN8 in latitude and was found
at W3 (corresponding to the latitude of SN4; Fig. 1). Peltigera
mal-acea 5 was found in association with Nostoc phylogroup III at the
northernmost localities, SN8 and SN9 (Fig. 1).
The Nostoc phylogroups also had variable distributions, although not as scattered as the Peltigera species (Fig. 1). Nostoc phylogroups VIIa and IV have widespread distributions across both transects and associate with multiple Peltigera species (four and three, re-spectively; Fig. 1). Nostoc phylogroups VIId and III have limited northern distributions (SN8 and SN9) and associate only with P.
scabrosa 2 and P. malacea 5, respectively (Fig. 1). The presence of
these two phylogroups in the northernmost localities results in a higher Nostoc diversity in the northern portion of the SN transect. Phylogroup XIa, by contrast, has a relatively scattered distribution. It was found in the northernmost localities of the SN transect with
P. scabrosa 2 and at both edges of the EW transect in association
with P. scabrosa 2 and P. neopolydactyla 4.
Predicted occurrence of Peltigera and Nostoc partners
In all cases, full models including both environmental covari-ates and the effect of symbiont presence performed better than environment- only or symbiont- only models (Table 1), except in the case of P. scabrosa 2, for which inclusion of the presence of Nostoc VIId did not improve the predictive ability of the model. Therefore, hereafter we interpret species responses to climate gradients from predictions of the full models. In the full models, three Peltigera species responded to environmental gradients. Models predict that, when the Nostoc symbiont is present at a locality, P.
neopolydac-tyla 1 is more likely to occur at wetter sites, P. occidentalis is less
likely to occur at the wettest sites, and P. scabrosa 1 is more likely to occur in the middle of the precipitation gradient (Fig. 4A). Each of these three species was found exclusively in association with the same Nostoc phylogroup VIIa. Peltigera scabrosa 2 is unlikely to oc-cur at warm- temperature sites, whereas the other taxa show only weak responses to temperature but are generally more likely to oc-cur in the middle of the temperature gradient (Fig. 4B). In general, precipitation and temperature did not have consistent effects on
FIGURE 3. Global phylogenetic tree of Nostoc based on a maximum likelihood analysis of 410 rbcLX sequences representing free- living and symbiotic
Nostoc, including 91 cyanobionts from lichen thalli collected along both transects (south–north and east–west) in Québec, Canada. Thick branches
received bootstrap values >70%. Clades and subclades were delimited following Otálora et al. (2010). A detailed view of this phylogenetic tree, includ-ing support values, taxon names, and GenBank accession numbers for all terminals, is provided in Appendix S1. Phylogroups sampled in this study are highlighted by colored boxes. Phylogroups were numbered following Magain et al. (2017a). Two terminal branches were truncated, as indicated by a folding symbol.
III IV XIa VIIa VIId 0.05 Nostoc clade 1 Nostoc clade 2 subclade 1 subclade 2 subclade 3
the distribution of Nostoc taxa among models including different
Peltigera symbionts, although models of Nostoc phylogroup IV
pre-dicted a lower probability of occurrence at high- temperature sites (Appendices S2 and S3).
DISCUSSION
Our findings were largely aligned with the traditional paradigm that mycobiont species show a higher degree of specialization than their photobiont partners (e.g., Beck et al., 2002; Yahr et al., 2004; O’Brien et al., 2005, 2013; Myllys et al., 2006; Magain et al., 2017a). Furthermore, we found consistent associations between previously studied Peltigera species and Nostoc phylogroups with no novel mycobiont–cyanobiont pairings (O’Brien et al., 2013; Magain et al., 2017a, b). The two most common Nostoc cyanobionts (phylogroups IV and VIIa) were associated with seven of the nine Peltigera spe-cies sampled for this study (Fig. 2). None of the Peltigera spespe-cies were present along the entire length of either the longitudinal or
latitudinal transect. Some species were widespread (e.g., P. scabrosa 1) while others were limited to certain areas, mostly restricted to the southern (P. neopolydactyla 4) or northern (P. scabrosa 2 and
P. malacea 5) ends of the latitudinal transect. By contrast, the two
most common cyanobionts, Nostoc phylogroups VIIa and IV, were found throughout both transects where Peltigera thalli were sam-pled (Fig. 1).
Asymmetric specificity associated with ecological success of Peltigera lichens
At this intrabiome spatial scale, the common Nostoc phylogroups and their interactions with Peltigera species displayed a pattern of asymmetrical specialization—highly specialized mycobionts asso-ciating with generalist photobionts (Figs. 1 and 2). This has been found to indicate the heavy influence that the generalist photobiont partner wields over the specialist mycobiont, in an evolutionary and ecological sense (Chagnon et al., 2018). This unequal influence mir-rors the asymmetrical dependence of these associations; Peltigera
TABLE 1. Comparison of models predicting the presence of Peltigera species and Nostoc phylogroups. “Focal species” is the species whose occurrence was modeled. “Symbiont” indicates which potential symbiont was included as a covariate in the full and symbiont- only models. AUC is the area under the ROC curve. Within each focal species, models are ranked by increasing Akaike weight (WAIC; best to worst).
Focal species Symbiont Model AUC WAIC Model rank
P. aphthosa Nostoc IV Full 0.99 17.2 1
Environment- only 0.80 55.1 2
Nostoc IV Symbiont- only 0.91 66.2 3
P. neopolydactyla 1 Nostoc VIIa Full 0.95 34.2 1
Environment- only 0.92 41.8 2
Nostoc VIIa Symbiont- only 0.28 70.8 3
P. occidentalis Nostoc VIIa Full 0.96 23.6 1
Environment- only 0.89 39.0 2
Nostoc VIIa Symbiont- only 0.69 51.4 3
P. scabrosa 1 Nostoc VIIa Full 0.90 50.1 1
Environment- only 0.87 58.0 2
Nostoc VIIa Symbiont- only 0.74 79.3 3
P. scabrosa 2 Nostoc Xia Full 1.00 5.8 1
Nostoc VIId Full 0.95 23.0 2
Environment- only 0.95 23.5 3
Nostoc Xia Symbiont- only 0.88 51.3 4
Nostoc VIId Symbiont- only 0.39 51.4 5
Nostoc IV P. aphthosa Full 0.98 24.7 1
P. malacea 2 Full 0.90 52.0 2
P. neopolydactyla 4 Full 0.85 57.0 3
Environment- only 0.85 65.4 4
P. aphthosa Symbiont- only 0.80 81.7 5
P. malacea 2 Symbiont- only 0.59 81.7 5
P. neopolydactyla 4 Symbiont- only 0.37 81.8 7
Nostoc VIIa P. occidentalis Full 0.98 24.1 1
P. neopolydactyla 1 Full 0.96 32.1 2
P. scabrosa 4 Full 0.96 33.8 3
P. scabrosa 1 Full 0.96 33.9 4
Environment- only 0.94 41.2 5
P. neopolydactyla 1 Symbiont- only 0.69 78.0 6
P. occidentalis Symbiont- only 0.39 78.0 6
P. scabrosa 1 Symbiont- only 0.75 78.0 6
P. scabrosa 4 Symbiont- only 0.45 78.0 6
Nostoc XIa P. scabrosa 2 Full 0.99 10.6 1
P. neopolydactyla 4 Full 0.93 26.3 2
Environment- only 0.90 31.2 3
P. neopolydactyla 4 Symbiont- only 0.41 47.7 4
(never found free living) is much more dependent on Nostoc (found free living; O’Brien et al., 2005; Zúñiga et al., 2017) than vice versa. In the case of Nostoc phylogroup VIIa, there are four Peltigera spe-cies that are highly dependent and exclusively interacting with this phylogroup (Figs. 1 and 2). As shown in Magain et al. (2017a, b) based on the complete phylogeny of section Polydactylon, these four species belong to two different major lineages in the section: the dolichorhizoid (P. neopolydactyla 1 and P. occidentalis) and scabrosoid (P. scabrosa 1 and 4) clades (Fig. 2). It is thus possible that the fungal partner speciated while the Nostoc phylogroup did not, resulting in an increasingly more generalist Nostoc symbiont, as suggested by Singh et al. (2016) for lichenized fungi associated with the green alga Trebouxia. For these four Peltigera species, there seems to be no selective pressure for the Nostoc phylogroup to diverge, as the fungal partner continues to be dependent on this
Nostoc phylogroup. Overall, our results suggest that Peltigera
spe-cies have a narrower ecological range than Nostoc phylogroups at this intrabiome scale. The observed high specialization and narrow spatial range of Peltigera within the boreal biome, and the larger ge-ographic range of cyanobiont phylogroups IV and VIIa compared to most Peltigera species, suggests that the spatial distribution of
Peltigera species is very likely shaped by other factors
(environmen-tal variables) in addition to the presence–absence of their cyanobi-onts at this intrabiome scale.
Spatial scales matter
The finding of Magain et al. (2017a) at a global spatial scale—that a generalist pattern of association with multiple Nostoc phylogroups
and local specialization through photobiont switches is associated with larger geographic ranges of the fungal partners—does not ap-pear to hold true at the intrabiome scale. Many of the Peltigera spe-cies that were found widely distributed along the transects are strict specialists in the area surveyed, such as P. scabrosa 1 and P.
aph-thosa. However, this is occurring in an area where their respective
cyanobiont phylogroup seems omnipresent, therefore not requiring host switches. Moreover, it should be noted that specialists in this context are not necessarily global specialists. Cyanobiont switches have been reported for species such as P. neopolydactyla 1 and P.
occidentalis across bioclimatic zones (Magain et al., 2017a). For
ex-ample, these two species, always found in association with Nostoc phylogroup VIIa along the SN and EW transects, and overall across the boreal biome, were associated with phylogroup VIIb in the Appalachian Mountains (Magain et al., 2017a). Therefore, within the boreal biome, cyanobiont switches do not seem to play a large role in shaping patterns of associations, except at the border with another biome (e.g., the Arctic; Fig. 1). A potential case of Nostoc switch may be P. scabrosa 2, which is found at lower latitudes with
Nostoc phylogroup XIa (E200) and with both Nostoc phylogroups
XIa and VIId at the most northern locality (SN9). It is possible that beyond SN9, in the Arctic biome, P. scabrosa 2 might asso-ciate more frequently with phylogroup VIId, for example (Figs. 1 and 3). Peltigera scabrosa 2 was also reported with phylogroup VIId in other northern areas such as Nunavik and Greenland (Magain et al., 2017a). Even if P. scabrosa 2 can associate with two Nostoc phylogroups, it does not seem to correlate with a more widespread distribution within the boreal biome (Fig. 1). Similarly, P.
neopoly-dactyla 4 was found in association with two Nostoc phylogroups but
FIGURE 4. Predicted effect of (A) precipitation and (B) temperature on the probability of Peltigera species presence. Lines indicate the median of the posterior predictive distribution from the full (blue) and environment- only (yellow) models. In A, model predictions are conditional on precipitation held constant at its mean value across sites (290 mm), whereas in B, model predictions are conditional on temperature held constant at its mean value across sites (12.7°C). The full model prediction is conditional on the Nostoc symbiont being present at the locality. The label at the top of each panel indicates which Nostoc phylogroup was included as a predictor in the full model. Model predictions are shown with 90% highest posterior density (HPD) intervals.
also showed a limited distribution. These findings are in agreement with a recent study on Peltigera and Nostoc that found evidence against the hypothesis that generalism allows for niche expansion (Chagnon et al., 2018), showing instead that associating with mul-tiple partners resulted in a “jack- of- all- trades but master of none” scenario, in which a mycobiont’s ability to associate with one part-ner may impair its fitness when associating with another (Wilson and Yoshimura, 1994; Chagnon et al., 2018). This is supported in the present study, in that Peltigera species that are not strict spe-cialists still show increased preference for one Nostoc phylogroup over others (Fig. 2). A similar pattern was found in a recent study of Peltigera and cyanobiont associations in Chile and maritime Antarctica, where mycobionts displayed preference for a specific
Nostoc through unequal frequencies of association within a climatic
zone (Zúñiga et al., 2017).
In finding evidence against the niche- breadth hypothesis, Chagnon et al. (2018) postulated that the range of potential partners does not act as the limiting factor for niche and range expansion for
Peltigera and Nostoc. This appears to be true in our study at the
in-trabiome scale, for both strict specialists and mycobionts associat-ing with more than one phylogroup. Although, as discussed earlier, some specific Peltigera–Nostoc associations are wide ranging in the boreal zone, many are confined to parts of the transect. It is the case throughout much of this sampled region that Nostoc distribution is wider than Peltigera distribution (Fig. 1). Thus, many Peltigera species are restricted in their distribution, even if their photobiont partner is available in surrounding areas. This biome- level finding differs markedly from the global observation that Nostoc distribu-tions drive Peltigera distribution patterns (Magain et al., 2017a). However, these conclusions are scale dependent. On the global (i.e., interbiome) spatial scale, cyanobiont availability appears to be the limiting factor for niche expansion. Cyanobiont switches allow
Peltigera to bypass the limitation of a specific Nostoc distribution
in order to extend their global range (Magain et al., 2017a). It has also been found within fungal–algal lichen associations that low photobiont availability in harsh environmental regions drives asso-ciations toward a generalist pattern, again indicating that photobi-ont availability is the limiting factor (Wirtz et al., 2003; Singh et al., 2016). Both of these outcomes show the dynamic interaction be-tween environmental, evolutionary, and genetically based factors, as well as the importance of spatial scale.
At an intrabiome scale, geographic ranges of Peltigera species are shaped more by abiotic factors than by cyanobiont availability
It appears that within the boreal biome, environmental factors have more influence on the spatial range of the fungal partner Peltigera than on the Nostoc phylogroups. Specifically, latitudinal gradients, especially precipitation (Fig. 4A), seem to have greater impacts on the mycobiont than on the cyanobiont. For example, P.
neopolydac-tyla 4 is found only in the southern area of the biome (SN2) and
across the EW transect (approximately the latitude of SN4) (Fig. 1). However, Nostoc phylogroup IV was found throughout our two transects. It is thus likely that environmental limitations drive the distribution of P. neopolydactyla 4. This may indicate that the cli-matic preferences of Peltigera are more restricted within a biome, and that lichen photobionts are more resilient to abiotic factors, than previously indicated. We did not model the presence of P.
neo-polydactyla 4 (and P. malacea spp.) because of their limited records.
However, the distributions of three more abundant species—P.
ne-opolydactyla 1, P. occidentalis, and P. scabrosa 1—were highly
asso-ciated with the climate gradient, especially precipitation (Fig. 4A). These three species were found exclusively associated with Nostoc phylogroup VIIa, which is present throughout both transects, yet P.
occidentalis is more likely to occur in dry sites, P. neopolydactyla 1
is more likely to occur in wet sites, and P. scabrosa 1 is more likely to be found in areas with intermediate levels of precipitation (Fig. 4A). These relatively narrow environmental spectra for lichen- forming fungi associating with the same photobiont could explain their higher species richness compared to their photobionts and could be an important driver of speciation for the genus Peltigera. By con-trast, only Nostoc phylogroup IV showed a slight association with temperature (Appendix S3). Furthermore, models that attempt to predict the distribution of Peltigera species solely from the presence of an appropriate Nostoc symbiont generally perform poorly within a biome. Comparing the predictions of the full models to those of the models containing only environmental covariates shows that en-vironmental constraints of Peltigera species distributions are weaker if the Nostoc symbiont is present. In general, models predict a wider range of suitable environmental conditions when the symbiont is present than when symbiont presence is not included as a predictor (Fig. 4). For example, the environment- only model of P. scabrosa 2 suggests that this species is unlikely to occur at sites experiencing mean summer temperatures above 12°C. However, when Nostoc XIa is present, that threshold shifts up to 13°C (Fig. 4B).
In the present study, a notable case that may indicate more finely tuned environmental preferences is that of putative P. malacea 2 and P. malacea 5. Peltigera malacea 2 was found in association with
Nostoc phylogroup IV at W3 and from SN6 to SN8, whereas closely
related P. malacea 5 occurred in the most northern localities, SN8 and SN9, in association with a different Nostoc (phylogroup III) de-spite the presence of phylogroup IV. In this case, it is possible that a speciation event of the mycobiont was associated with a Nostoc phylogroup switch. However, to better understand and explain the observed patterns within the malacea complex, we need to extend the sampling farther north.
Factors shaping levels of specificity
The conditions for the rare reciprocal one- to- one specificity in species of the genus Peltigera are not well known but have been described for certain species of Collema, Leptogium, and Degelia li-chens (Otálora et al., 2010, 2013). In those cases, asexual reproduc-tion through codispersal of the mycobiont and the photobiont (i.e., vertical transmission of the photobiont) as well as narrow ecological niches were identified as essential driving factors toward high re-ciprocal specificity. Given that P. malacea sensu lato does not have specialized codispersal structures, O’Brien et al. (2013) proposed that either thallus fragmentation resulting in clonal reproduction or genetically determined specificity drives reciprocal specificity. Our results are consistent with those of Otálora et al. (2010) showing that a narrow ecological niche may be a driving factor for high spec-ificity, in that P. malacea 5 and its reciprocal partner were found only at the northern reaches in our study.
In assessing genetically based specificity with the resulting
Peltigera haplotype network (Fig. 2) and Nostoc phylogenetic tree
(Fig. 3 and Appendix S1), our findings are similar to those of Magain et al. (2017a) and O’Brien et al. (2013). Although phylogenetic re-lationships help predict associations in some cases, this is not a
consistent rule. For example, Nostoc phylogroup VIIa associates with relatively closely related species, all from section Polydactylon (Figs. 1 and 2). However, Nostoc phylogroup IV is found with two
Peltidea species, P. malacea 2 and P aphthosa, but also with P. ne-opolydactyla 4, which is a member of section Polydactylon (Figs. 1
and 2; Miadlikowska et al., 2014). These relationships may then be mediated by spatial distribution, given that phylogenetically unre-lated species that are side- by- side in the transect, such as P.
neopoly-dactyla 4 and P. aphthosa, can share the same Nostoc phylogroup
(Fig. 2).
Overall implications
Factors driving patterns of symbiotic associations are scale de-pendent. Whereas previous studies examined Peltigera and other lichen associations at a macroscale (Singh et al., 2016; Magain et al., 2017a) or mostly at a microscale (O’Brien et al., 2013), the present study aimed to assess intermediate, intrabiome patterns. We found
Peltigera species to be specific, associating with mostly one and
sometimes two cyanobiont phylogroups. Although Magain et al. (2017a) showed that at the interbiome scale, environmental factors drive Nostoc phylogroup distributions, which then delimit global
Peltigera species ranges, Nostoc availability was not the only driver
of Peltigera species geographic ranges and association at the intrabi-ome scale. At this smaller spatial scale, we found that environmental factors seem to be important co- drivers of Peltigera species distri-butions and that the most commonly found Nostoc phylogroups have broader ranges than their associating Peltigera species. Many
Peltigera species distributions were restricted to subsections of our
transects even when the preferred Nostoc phylogroup was more widespread, indicating that regional- scale abiotic factors limit the fungal partner’s distribution. Contrary to the mycobiont, in general
Nostoc ranges were not associated with climatic variables at this
in-trabiome scale. Within the boreal biome, an increase in the number of Nostoc partners was not found to expand the distribution range of the mycobiont.
ACKNOWLEDGEMENTS
The authors thank the Air Saguenay pilot J. Bérubé and the team at Lac Margane for making the sampling across the boreal biome in Québec possible; members of the Lutzoni (Duke University) and A. E. Arnold (University of Arizona) labs for field assistance in Québec, part of the sampling for the Dimensions of Biodiversity project; and two anonymous reviewers for comments and sugges-tions that improved the manuscript. The sampling, processing, and sequencing of lichen specimens for this project was financially sup-ported by National Science Foundation grants (DEB- 1046065 to F.L.; DEB- 1025930 and DEB- 1556995 to J.M. and F.L.). This work was supported in part by the Swiss National Science Foundation prospective researcher grant PBGEP3_145339 to C.T.
DATA ACCESSIBILITY
The rbcLX dataset (410 OTUs) and the resulting most likely tree are available in TreeBASE (http://purl.org/phylo/ treebase/phylows/ study/S22406). GenBank accession numbers for sequences gener-ated in this study are included in Appendix 1.
SUPPORTING INFORMATION
Additional Supporting Information may be found online in the supporting information tab for this article.
LITERATURE CITED
Baloch, E., H. T. Lumbsch, and M. Wedin. 2010. Major clades and phylogenetic relationships between lichenized and non- lichenized lineages in Ostraples (Ascomycota: Lecanoromycetes). Taxon 59: 1483–1494.
Beck, A., T. Kasalicky, and G. Rambold. 2002. Myco- photobiontal selection in a Mediterranean cryptogam community with Fulgensia fulgida. New
Phytologist 153: 317–326.
Blaha, J., E. Baloch, and M. Grube. 2006. High photobiont diversity associ-ated with the euryoecious lichen- forming ascomycete Lecanora rupicola (Lecanoraceae, Ascomycota). Biological Journal of the Linnean Society 88: 283–293.
Boucher, D. H., S. James, and K. H. Keeler. 1982. The ecology of mutualism.
Annual Review of Ecology and Systematics 13: 315–347.
Carpenter, B., A. Gelman, M. D. Hoffman, D. Lee, B. Goodrich, M. Betancourt, M. Brubaker, et al. 2017. Stan: A probabilistic programming language.
Journal of Statistical Software 76: 1–32.
Chagnon, P.-L., N. Magain, J. Miadlikowska, and F. Lutzoni. 2018. Strong speci-ficity and network modularity at a very fine phylogenetic scale in the lichen genus Peltigera. Oecologia 187: 767–782.
Clement, M., D. Posada, and K. A. Crandall. 2000. TCS: A computer program to estimate gene genealogies. Molecular Ecology 9: 1657–1660.
Cornelissen, J. H. C., T. V. Callaghan, J. M. Alatalo, A. Michelsen, E. Graglia, A. E. Hartley, D. S. Hik, et al. 2001. Global change and arctic ecosystems: Is lichen decline a function of increases in vascular plant biomass? Journal of
Ecology 89: 984–994.
Darnajoux, R., X. Zhang, D. L. McRose, J. Miadlikowska, F. Lutzoni, A. M. L. Kraepiel, and J.-P. Bellenger. 2017. Biological nitrogen fixation by alternative nitrogenases in boreal cyanolichens: Importance of molybdenum availabil-ity and implications for current biological nitrogen fixation estimates. New
Phytologist 213: 680–689.
de Vienne, D. M., G. Refregier, M. Lopez-Villavicencio, A. Tellier, M. E. Hood, and T. Giraud. 2013. Cospeciation vs host- shift speciation: Methods for test-ing, evidence from natural associations and relation to coevolution. New
Phytologist 198: 347–385.
Gardes, M., and T. D. Bruns. 1993. ITS primers with enhanced specificity for basidiomycetes—application to the identification of mycorrhizae and rusts.
Molecular Ecology 2: 113–118.
Hodkinson, B. P., J. L. Allen, L. Forrest, B. Goffinet, E. Sérusiaux, Ó. S. Andrésson, V. Miao, et al. 2014. Lichen- symbiotic cyanobacteria associated with Peltigera have an alternative vanadium- dependent nitrogen fixation system. European Journal of Phycology 49: 11–19.
Hodkinson, B. P., N. R. Gottel, C. W. Schadt, and F. Lutzoni. 2012. Photoautotrophic symbiont and geography are major factors affecting highly- structured and diverse bacterial communities in the lichen microbi-ome. Environmental Microbiology 14: 147–161.
Hodkinson, B. P., and F. Lutzoni. 2009. A microbiotic survey of lichen- associated bacteria reveals a new lineage from the Rhizobiales. Symbiosis 49: 163–180.
Li, L. A., and L. R. Tabita. 1997. Maximum activity of recombinant ribulose 1,5 bisphosphate carboxylase/oxygenase of Anabaena sp. strain CA requires the product of the rbcX gene. Journal of Bacteriology 179: 3793–3796.
Lutzoni, F., M. Pagel, and V. Reeb. 2001. Major fungal lineages are derived from lichen symbiotic ancestors. Nature 411: 937–940.
Lutzoni, F., P. Wagner, V. Reeb, and S. Zoller. 2000. Integrating ambiguously aligned regions of DNA sequences in phylogenetic analyses without violat-ing positional homology. Systematic Biology 49: 628–651.
Maddison, D., and W. Maddison. 2005. MacClade v. 4.08. Sinauer Associates, Sunderland, Massachusetts, USA.
Magain, N., J. Miadlikowska, B. Goffinet, E. Sérusiaux, and F. Lutzoni. 2017a. Macroevolution of specificity in cyanolichens of the genus Peltigera section
Polydactylon (Lecanoromycetes, Ascomycota). Systematic Biology 66: 74–99.
Magain, N., J. Miadlikowska, O. Mueller, M. Gajdeczka, C. Truong, A. Salamov, I. Dubchak, et al. 2017b. Conserved genomic collinearity as a source of broadly applicable, fast evolving, markers to resolve species complexes: A case study using the lichen- forming genus Peltigera section Polydactylon.
Molecular Phylogenetics and Evolution 117: 10–29.
Miadlikowska, J., and F. Lutzoni. 2000. Phylogenetic revision of the genus
Peltigera (lichen- forming ascomycetes) based on morphological, chemical
and large subunit nuclear ribosomal DNA data. International Journal of
Plant Sciences 161: 925–958.
Miadlikowska, J., and F. Lutzoni. 2004. Phylogenetic classification of peltiger-alean fungi (Peltigerales, Ascomycota) based on ribosomal RNA small and large subunits. American Journal of Botany 91: 449–464.
Miadlikowska, J., F. Lutzoni, T. Goward, S. Zoller, and D. Posada. 2003. New ap-proach to an old problem: Incorporating signal from gap- rich regions of ITS and nrDNA large subunit into phylogenetic analyses to resolve the Peltigera
canina species complex. Mycologia 95: 1181–1203.
Miadlikowska, J., D. Richardson, N. Magain, B. Ball, F. Anderson, R. Cameron, J. Lendemer, et al. 2014. Phylogenetic placement, species delimitation, and cyanobiont identity of endangered aquatic Peltigera species (lichen- forming Ascomycota, Lecanoromycetes). American Journal of Botany 101: 1141–1156. Miller, M. A., W. Pfeiffer, and T. Schwartz. 2010. Creating the CIPRES Science
Gateway for inference of large phylogenetic trees. Gateway Computing Environments Workshop (GCE), 2010, IEEE.
Myllys, L., S. Stenroos, A. Thell, and M. Kuusinen. 2006. High cyanobiont se-lectivity of epiphytic lichens in old growth boreal forest in Finland. New
Phytologist 173: 621–629.
Nash, T. H. 2008. Lichen biology. Cambridge University Press, Cambridge, UK. Nelsen, M. P., and A. Gargas. 2009. Symbiont flexibility in (Pertusariales:
Icmadophilaceae). The Bryologist 112: 404–417.
O’Brien, H. E., J. Miadlikowska, and F. Lutzoni. 2005. Assessing host specializa-tion in symbiotic cyanobacteria associated with four closely related species of the lichen fungus Peltigera. European Journal of Phycology 40: 363–378. O’Brien, H. E., J. Miadlikowska, and F. Lutzoni. 2009. Assessing reproductive
isolation in highly diverse communities of the lichen- forming fungus genus
Peltigera. Evolution 63: 2076–2086.
O’Brien, H. E., J. Miadlikowska, and F. Lutzoni. 2013. Assessing popula-tion structure and host specializapopula-tion in lichenized cyanobacteria. New
Phytologist 198: 557–566.
Otálora, M. A., G. Aragón, I. Martínez, and M. Wedin. 2013. Cardinal charac-ters on a slippery slope: A re- evaluation of phylogeny, character evolution, and evolutionary rates in the jelly lichens (Collemataceae s. str). Molecular
Phylogenetics and Evolution 68: 185–198.
Otálora, M. A., I. Martínez, H. O’Brien, M. C. Molina, G. Aragon, and F. Lutzoni. 2010. Multiple origins of high reciprocal symbiotic specificity at an intercontinental spatial scale among gelatinous lichens (Collemataceae, Lecanoromycetes). Molecular Phylogenetics and Evolution 56: 1089–1095. Paulsrud, P., and P. Lindblad. 1998. Sequence variation of the tRNA Leu Intron
as a marker for genetic diversity and specifcity of symbiotic cyanobacteria in some lichens. Applied and Environmental Microbiology 64: 310–315. Peksa, O., and P. Škaloud. 2011. Do photobionts influence the ecology of
li-chens? A case study of environmental preferences in symbiotic green alga
Asterochloris (Trebouxiophyceae). Molecular Ecology 20: 3936–3948.
Pérez-Ortega, S., R. Ortiz-Álvarez, T. G. A. Green, and A. de Los Ríos. 2012. Lichen myco- and photobiont diversity and their relationships at the edge of life (McMurdo Dry Valleys, Antarctica). FEMS Microbiology Ecology 82: 429–448.
Rodríguez, F. J., J. L. Oliver, A. Marín, and J. R. Medina. 1990. The general sto-chastic model of nucleotide substitution. Journal of Theoretical Biology 142: 485–501.
Rudi, K., O. M. Skulberg, and K. S. Jakobsen. 1998. Evolution of cyanobacteria by exchange of genetic material among phyletically related strains. Journal of
Bacteriology 180: 3453–3461.
Schoch, C. L., K. A. Seifert, S. Huhndorf, V. Robert, J. L. Spouge, C. A. Levesque, and W. Chen. 2012. Nuclear ribosomal internal transcribed spacer (ITS) region as a universal DNA barcode marker for Fungi. Proceedings of the
National Academy of Sciences USA 109: 6241–6246.
Singh, G., F. Dal Grande, P. K. Divakar, J. Otte, A. Crespo, and I. Schmitt. 2016. Fungal- algal association patterns in lichen symbiosis linked to macrocli-mate. New Phytologist 214: 317–329.
Spribille, T., V. Tuovinen, P. Resl, D. Vanderpool, H. Wolinski, M. C. Aime, K. Schneider, et al. 2016. Basidiomycete yeasts in the cortex of ascomycete mac-rolichens. Science 353: 488–492.
Stamatakis, A. 2006. RAxML- VI- HPC: Maximum likelihood- based phyloge-netic analyses with thousands of taxa and mixed models. Bioinformatics 22: 2688–2690.
Stamatakis, A., P. Hoover, and J. Rougemont. 2008. A rapid bootstrap algorithm for the RAxML Web servers. Systematic Biology 57: 758–771.
Stan Development Team. 2017. RStan: The R interface to Stan. R package version 2.16.2. http://mc-stan.org.
Thompson, J. N. 2005. The geographic mosaic of evolution. University of Chicago Press, Chicago, Illinois, USA.
Vasquez, D. P., C. J. Melián, N. M. Williams, N. Blüthen, B. R. Krasnov, and R. Poulin. 2007. Species abundance and asymmetrical interaction strength in ecological networks. Oikos 116: 1120–1127.
Vermeji, G. J. 1999. Inequality and the directionality of history. The American
Naturalist 153: 243–253.
Vermeji, G. J. 2004. Nature: An economic history. Princeton University Press, Princeton, New Jersey, USA.
Wedin, M., H. Döring, and G. Gilenstam. 2004. Saprotrophy and lichenization as options for the same fungal species on different substrata: Environmental plasticity and fungal lifestyles in the Stictis-Conotrema complex. New
Phytologist 164: 459–465.
Werth, S., and D. Fontaneto. 2011. Biogeography and phylogeography of li-chen fungi and their photobionts. In D. Fontaneto [ed.], Biogeography of micro-organisms: Is everything small everywhere? 191–208. Cambridge University Press, Cambridge, UK.
Wheeler, D. L., T. Barrett, D. A. Benson, S. H. Bryant, K. Canese, V. Chetvernin, D. M. Church, et al. 2007. Database resources of the national center for bio-technology information. Nucleic Acids Research 35: D5–D12.
White, T. J., T. Bruns, S. Lee, and J. Taylor. 1990. Amplification and direct se-quencing of fungal ribosomal RNA genes for phylogenetics. PCR Protocols:
A Guide to Methods and Applications 18: 315–322.
Wilson, D. S., and J. Yoshimura. 1994. On the coexistence of specialists and gen-eralists. American Naturalist 144: 692–707.
Wirtz, N., H. T. Lumbsch, T. G. Green, R. Türk, A. Pintado, L. Sancho, and B. Schroeter. 2003. Lichen fungi have low cyanobiont selectivity in maritime Antarctica. New Phytologist 160: 177–183.
Yahr, R., R. Vilgalys, and P. T. Depriest. 2004. Strong fungal specificity and se-lectivity for algal symbionts in Florida scrub Cladonia lichens. Molecular
Ecology 13: 3367–3378.
Zolan, M., and P. Pukkila. 1986. Inheritance of DNA methylation in Coprinus
cinereus. Molecular and Cellular Biology 6: 195–200.
Zúñiga, C., D. Leiva, M. Carú, and J. Orlando. 2017. Substrates of Peltigera li-chens as a potential source of cyanobionts. Microbial Ecology 74: 561–569.
APPENDIX 1. Taxon sampling of Peltigera on the south–north (SN) and east–west (EW) transects (Fig. 1) in Québec, Canada.
Specimen ID Taxon Locality, site, and cluster Coordinates ITS rbcLX haplotypePeltigera phylogroupNostoc
P5057 Peltigera aphthosa SN5_C2 52.41264°N, 73.07248°W MG811733 MG818406 1 IV P5053 P. aphthosa SN8_E1 56.53598°N, 73.22478°W MG811732 MG818411 1 IV P5002 P. aphthosa SN8_E2 56.53636°N, 73.22427°W MG811728 MG818409 1 IV P5007 P. aphthosa SN8_E3 56.53677°N, 73.22429°W MG811731 MG818412 3 IV P5046 P. aphthosa SN9_C1 57.91270°N, 72.97673°W MG811737 MG818434 4 IV P5054 P. aphthosa SN9_W1 57.96773°N, 73.04319°W MG811738 MG818436 4 IV P5005 P. aphthosa W12.5_C2 50.95784°N, 68.71450°W MG811730 MG818408 2 IV P5003 P. aphthosa W12.5_C3 50.95783°N, 68.71523°W MG811729 MG818407 1 IV P5084 P. aphthosa E100_C1 51.13508°N, 66.04708°W MG811734 MG818433 1 IV
P5086 P. aphthosa E200_C2 51.28011°N, 63.83678°W MG811735 Missing 1 n/a
P5080 P. aphthosa W100_C1 50.79232°N, 70.74293°W MG811736 MG818439 1 IV
P0741 P. aphthosa W1.5_C1 51.08493°N, 68.53860°W MG811726 MG818432 1 IV
P0727 P. aphthosa W6_C1 51.03429°N, 68.60778°W MG811727 MG818438 1 IV
P5056 P. aphthosa SN4_E2 51.06926°N, 73.03429°W Missing MG818410 n/a IV
P0735 P. malacea 2 SN6_E2 53.86195°N, 72.99868°W MG811718 MG818374 1 IV P5044 P. malacea 2 SN6_E3 53.86195°N, 72.99868°W MG811720 MG818375 2 IV P5063 P. malacea 2 W3_C3 51.06652°N, 68.55525°W MG811721 MG818376 2 IV P5004 P. malacea 2 SN8_C1 56.52742°N, 73.27129°W MG811719 MG818377 1 IV P5006 P. malacea 5 SN8_W2 56.53179°N, 73.34526°W MG811723 MG818379 3 III P0737 P. malacea 5 SN8_W3 56.53210°N, 73.34454°W MG811725 MG818378 3 III P5047 P. malacea 5 SN9_C1 57.91270°N, 72.97673°W MG811724 MG818381 3 III P5000 P. malacea 5 SN9_W1 57.96773°N, 73.04319°W MG811722 MG818380 3 III P5025 P. neopolydactyla 1 SN3_W2 49.34304°N, 73.40994°W MG811754 MG818425 1 VIIa
P5016 P. neopolydactyla 1 SN3_E1 49.39553°N, 73.46278°W MG811751 MG818382 1 VIIa
P5015 P. neopolydactyla 1 SN3_C1 49.36126°N, 73.44313°W MG811750 MG818431 1 VIIa
P0303 P. neopolydactyla 1 SN3_C1 49.36126°N, 73.44313°W MG811740 MG818385 1 VIIa
P5024 P. neopolydactyla 1 SN3_E1 49.39553°N, 73.46278°W MG811752 MG818383 1 VIIa
P5042 P. neopolydactyla 1 SN5_W1 52.39765°N, 73.09985°W MG811755 MG818426 1 VIIa
P0317 P. neopolydactyla 1 SN6_E3 53.86195°N, 72.99868°W MG811744 MG818386 1 VIIa
P0324 P. neopolydactyla 1 W1.5_C1 51.08493°N, 68.53860°W MG811748 MG818384 1 VIIa
P0319 P. neopolydactyla 1 W100_C2 50.79128°N, 70.74345°W MG811745 MG818391 1 VIIa
P0323 P. neopolydactyla 1 W25_C1 50.92852°N, 68.97288°W MG811747 MG818387 1 VIIa
P0313 P. neopolydactyla 1 W25_C2 50.92820°N, 68.97259°W MG811743 MG818389 1 VIIa
P5061 P. neopolydactyla 1 E100_C3 51.13462°N, 66.04774°W MG811749 MG818430 1 VIIa
P5083 P. neopolydactyla 1 E100_C1 51.13508°N, 66.04708°W MG811753 MG818429 1 VIIa
P0300 P. neopolydactyla 1 W3_C1 51.06635°N, 68.55641°W MG811739 MG818388 1 VIIa P0309 P. neopolydactyla 1 W50_C1 50.89513°N, 69.50816°W KX897220 KX922922 1 VIIa P0307 P. neopolydactyla 1 W50_C2 50.89483°N, 69.50854°W MG811742 MG818428 1 VIIa P0322 P. neopolydactyla 1 W6_C2 51.03423°N, 68.60746°W MG811746 MG818427 1 VIIa P0304 P. neopolydactyla 1 W100_C1 50.79232°N, 70.74293°W MG811741 MG818390 1 VIIa P0320 P. neopolydactyla 4 E100_C2 51.13479°N, 66.04754°W MG811757 MG818404 1 IV P5082 P. neopolydactyla 4 W100_C1 50.79232°N, 70.74293°W MG811759 MG818416 2 XIa P0321 P. neopolydactyla 4 E200_C1 51.28066°N, 63.83717°W KX897253 KX922949 1 IV P5026 P. neopolydactyla 4 E200_C3 51.27972°N, 63.83693°W MG811756 MG818405 1 IV P5014 P. neopolydactyla 4 SN2_E1 47.91781°N, W72.96183 MG811758 MG818403 1 IV P0302 P. neopolydactyla 4 SN2_W1 47.89268°N, 72.89707°W KX897252 KX922948 1 IV
P5062 P. occidentalis E200_C1 51.28066°N, 63.83717°W MG811762 MG818435 1 VIIa
P0299 P. occidentalis SN5_C1 52.41323°N, 73.07322°W KX897269 KX922965 1 VIIa
P0305 P. occidentalis SN5_C3 52.41315°N, 73.07139°W MG811763 MG818422 1 VIIa
P0314 P. occidentalis SN8_C3 56.52835°N, 73.27141°W KX897270 KX922966 1 VIIa
P5048 P. occidentalis SN9_C1 57.91270°N, 72.97673°W MG811760 MG818447 1 VIIa
P0316 P. occidentalis SN9_E1 57.88662°N, 73.02011°W MG811764 MG818448 1 VIIa
P0108 P. occidentalis W1.5_C3 51.08519°N, 68.53794°W KX897268 KX922964 1 VIIa
P5081 P. occidentalis W100_C1 50.79232°N, 70.74293°W MG811765 MG818420 1 VIIa
P0103 P. occidentalis SN5_W3 52.39718°N, 73.10094°W MG811761 MG818421 1 VIIa
P5033 P. scabrosa 1 EW0_C1 51.10506°N, 68.52175°W MG811779 MG818445 1 VIIa
P5027 P. scabrosa 1 SN3_W1 49.34324°N, 73.41033°W MG811783 MG818398 1 VIIa
P5022 P. scabrosa 1 SN3_W3 49.34311°N, 73.41059°W MG811780 MG818397 1 VIIa
P5020 P. scabrosa 1 SN5_C2 52.41264°N, 73.07248°W MG811782 MG818395 1 VIIa
P5021 P. scabrosa 1 SN5_E3 52.42619°N, 73.03578°W MG811781 MG818401 1 VIIa
P5017 P. scabrosa 1 SN6_W1 53.79902°N, 73.07108°W MG811777 MG818402 1 VIIa
![[PDF] Formation informatique sur le Framework QT](data:image/gif;base64,R0lGODlhAQABAIAAAP///wAAACH5BAEAAAAALAAAAAABAAEAAAICRAEAOw==)