A Review of Public
Finances in Haiti
Better
Spending,
Better
Services
Public Disclosure Authorized
Public Disclosure Authorized
Public Disclosure Authorized
A Review of Public
Finances in Haiti
Better
Spending,
Better
Services
Standard Disclaimer:
This volume is a product of the staff of the International Bank for Reconstruction and Development/ The World Bank. The findings, interpretations, and conclusions expressed in this paper do not necessarily reflect the views of the Executive Directors of The World Bank or the governments they represent. The World Bank does not guarantee the accuracy of the data included in this work. The boundaries, colors, denominations, and other information shown on any map in this work do not imply any judgment on the part of The World Bank concerning the legal status of any territory or the endorsement or acceptance of such boundaries.
Copyright Statement:
The material in this publication is copyrighted. Copying and/or transmitting portions or all of this work without permission may be a violation of applicable law. The International Bank for Reconstruction and Development/ The World Bank encourages dissemination of its work and will normally grant permission to reproduce portions of the work promptly.
For permission to photocopy or reprint any part of this work, please send a request with complete information to the Copyright Clearance Center, Inc., 222 Rosewood Drive, Danvers, MA 01923, USA, telephone 978-750-8400, fax 978-750-4470, http://www.copyright.com/.
All other queries on rights and licenses, including subsidiary rights, should be addressed to the Office of the Publisher, The World Bank, 1818 H Street NW, Washington, DC 20433, USA, fax 202-522-2422, e-mail [email protected].
Credit: Isabelle Schaefer / World Bank
Acronyms and Abbreviations
AFD Agence Française de Développement (French agency for development)
AIDS Acquired Immunodeficiency Syndrome
ARI Acute Respiratory Infection
ASC Agent de Santé Communautaire (community health worker)
BM Banque Mondiale
BMPAD Bureau de Monétisation des Programmes d’Aide au Développement (Monetization Office of Development
Assistance Programs)
BRH Banque de la République d’Haïti (Haiti Central Bank)
BSEIPH Bureau du Secrétaire d’Etat à l’Intégration des Personnes Handicapées (Office of the Secretary of State for
Integration of Persons with Disabilities)
CAL Centre de Santé avec Lit (health centre with bed)
CAS Caisse d’Assistance Sociale (Social Assistance Fund)
CDB Caribbean Development Bank
CHE Catastrophic Health Expenditure
CIDA Canadian International Development Agency
CNMP Commission Nationale des Marchés Publics (National Procurement Commission)
CONATEL Conseil National de Télécommunication (National Telecommunication Regulator)
CSAFP Conseil Supérieur de l’Administration et de la Fonction Publique
CSCCA Cour Supérieure des Comptes et du Contentieux Administratif (Supreme Court of Accounts and Contentious
Administrative Proceedings)
CSL Centre de Santé sans Lit (health centre without bed)
DAB Directorate of Administration and Budget
DAO Dossier d’Appel d’Offres (Bidding Document)
DDP Document Définitif du Projet (Final Project Document)
DEA Data Envelopment Analysis
DEC Direction d’Evaluation et de Contrôle (Evaluation and Control Directorate)
DGB Direction Générale du Budget (Budget Directorate)
DTDCP Direction du Trésor, Dette, et Comptabilité Publique (Treasury Directorate)
DHS Demographic and Health Survey
DIP Direction de l’Investissement Public (Directorate of Public Investment)
DPC Direction de la Pension Civile (Directorate for Public Pensions)
DPES Direction de la Programmation Economique et Sociale (Economic and Social Programming Directorate)
DSE Direction du Suivi et de l’Evaluation (Directorate of Monitoring & Evaluation)
ECVMAS Enquête sur les Conditions de Vie des Ménages après le Séisme (survey on the living conditions of households
after the earthquake – household survey)
EMMUS Haiti Mortality, Morbidity, and Service Utilization Survey (DHS in English)
EPPLS Entreprise Publique de Production de Logement Social (Public Enterprise for the Promotion of Social Housing)
EPSSS Evaluation de la Prestation des Services de Soins de Santé (Service Provision Assessment)
EPT Education Pour Tous (Education For All)
EU European Union
FAES Fonds d’Assistance Economique et Social (Economic and Social Assistance Fund)
FER Fonds d’Entretien Routier (Road Maintenance Fund)
FIOP Fiche d’Identification et d’Opération des Projets (Identification and Project Operation File)
FNE Fonds National de l’Education (National Education Fund)
FY Fiscal Year
GDP Gross Domestic Product
GL General Ledger
GoH Government of Haiti
GPRSP Growth and Poverty Reduction Strategy Paper
GSP Groupe Santé Plus (Health group – private company)
HCR Hôpital Communautaire de Référence (Community Referral Hospital)
HIMO Travaux à Haute Intensité de Main d’Oeuvre (Labor-intensive public works) HIS Health Information System
HIV Human Immunodeficiency Virus
HRMIS Human Resources Management Information System
HTG Haitian Gourdes
IADB Inter-American Development Bank
IBERS Institut du Bien-Etre Social et de Recherches (Institute of Social Welfare and Research)
IDA International Development Association
IDB Inter-American Development Bank
IGF Inspection Générale des Finances (Inspectorate General of Finances)
IHE Institut Haïtien de l’Enfance (Haitian Institute of Childhood)
IHSI Institut Haïtien de Statistique et d’Informatique (Haitian Statistics Agency)
IMF International Monetary Fund
IMR Infant Mortality Rate
INTOSAI International Organization of Supreme Audit Institutions
KF Kore Fanmi (Family Support – Community Social Worker Initiative)
LdF Loi de Finances
MARNDR Ministère de l’Agriculture, des Ressources Naturelles et du Développement Rural (Ministry of Agriculture, Natural
Resources and Rural Development)
MAST Ministère des Affaires Sociales et du Travail (Ministry of Social Affairs and Labor)
MCFDF Ministère de la Condition Féminine et des Droits des Femmes (Ministry for Women and Women’s Rights)
MDG Millennium Development Goals
MEF Ministère de l’Economie et des Finances (Ministry of Economy and Finance)
MENFP Ministère de l’Education Nationale et de la Formation Professionnelle (Ministry of National Education and
Vocational Training)
MICT Ministère de l’Intérieure et des Collectivités Territoriales (Ministry of Interior and Local Government)
MIS Management Information Systems
MMR Maternal Mortality Ratio
MNCH Maternal, Neonatal, and Child Health
MoP Ministry of Planning
MPCE Ministère du Plan et de la Coopération Extérieure (Ministry of Planning and External Cooperation) MSPP Ministère de la Santé Publique et de la Population (Ministry of Public Health and Population)
MTPTC Ministère des Travaux Publics, Transports et Communications (Ministry of Public Works, Transport, and
Communication)
NGO Non Governmental Organization
NHA National Health Account
OFATMA Office d’Assurance Accidents du Travail, Maladie et Maternité (Office of Insurance for Work Accidents, Illness and
Maternity)
OMRH Office des Ressources Humaines (Office of Human Ressources)
ONA Office National d’Assurance Vieillesse (National Office for Old Age Insurance )
ONART Office National de l’Artisanat (National Handicrafts Office)
ONM Office National de la Migration (National Migration Office)
PAARP Plan d’Action pour l’Accélération de la Réduction de Pauvreté (Plan for Accelerating the Reduction of Extreme
PaP Port-au-Prince
PARDH Plan d’Action pour le Relèvement et le Développement d’Haïti (Action Plan for Haitian National Recovery and
Development)
PDS Plan Directeur de Santé (Health Master Plan) PEFA Public Expenditure and Financial Accountability
PFM Public Financial Management
PIMS Public Investment Management System
PIP Programme d’Investissement Public (Public Investment Program)
PMS Paquet Minimum de Santé (Minimum Package of Services)
PNCS Programme National de Cantines Scolaires (National School Canteen Program)
PNS Politique Nationale de Santé (National Health Policy)
PSDH Plan Stratégique de Développement d’Haïti (Strategic Plan for the Development of Haiti)
PSUGO Programme de Scolarisation Universelle Gratuite et Obligatoire (Free and Compulsory Universal Schooling
Program)
PTI Plan Triennal d’Investissement (Triennial Investment Plan)
RBF Results-Based Financing
SAI Supreme Audit Institution
SDI Schéma Directeur Informatique (IT Master Plan)
SIGMP Système Informatisé de Gestion des Marchés Publics (IT System for Procurement Management)
SP Social Protection
SSN Social Safety Net
SYSCOMPTE Système de gestion des Comptes Courants (Accounting System for Specific Budget Items)
SYSDEP Système Informatisé de gestion des Dépenses Publiques (Public Expenditure Management System)
SYSPIP Système Informatisé de gestion du Programme d’Investissement Public (Public Investment Management
System)
TB Tuberculosis
THE Total Health Expenditure
U5MR Under-five Mortality Rate
UAS Unité d’Arrondissement de Santé (District Health Unit)
UCE Unité de Contrôle d’Exécution
UEP Unité d’Etude et de Programmation (Programming and Analysis Unit)
ULCC Unité de Lutte Contre la Corruption (Anti-Corruption Unit)
UN United Nations
UNCITRAL United Nations Commission on International Trade Law
UNDP United Nations Development Program
UNICEF United Nations Children’s Fund
USAID United States Agency for International Development
WB World Bank
WFP World Food Program
WHO World Health Organization
W
e would like to thank the members of the Haiti Country Team, as well as all the partners and stakeholders in Haiti who have contributed to the preparation of this document in a strong collaborative process. We are very grateful for the generosity exhibited in providing us with substantive inputs, knowledge and advice. The Team was led by Raju Jan Singh (Program Leader, LCC8C) and the table below identifies the full list of team members who have contributed their time, effort and expertise, and their affiliations.We wish to thank for their helpful suggestions and insights our peer reviewers: Margaret Grosh (Practice Manager, GSPDR), Sebastian James (Senior Investment Policy Officer, GTCDR), Roland Kpodar (Senior Economist, IMF), David Cal McWilliam (Senior Economist, GMFDR), Patrick Ramanantoanina (Senior Operations Officer, GEDDR), and Anand Rajaram (Practice Leader, GGODR). Mary Barton-Dock (Special Envoy for Haiti, LCC8C) and Miria Pigato (Practice Manager, GMFDR) advised the Team throughout the stages of the process.
The Team is also extremely grateful for the cooperation of the Haitian authorities and for the invaluable contributions of senior officials and governmental agencies. We acknowledge in particular
the following institutions: the Ministry of Economy and Finance, the Ministry of Education, the Ministry of Planning and External Cooperation, the Ministry of Public Health and Population, the Ministry of Social Affairs, and the Prime Minister’s Office, as well as the Central Bank of Haiti (BRH). The Team wishes to thank all the participants of the numerous workshops where preliminary results have been presented and discussed, in particular Mme Laleau, Head of the Economic Studies (Ministry of Economy and Finance) and Berny Duvalsaint, Secretary of the PER Steering Committee. The Team gratefully acknowledges also the support from donors present in Haiti: AFD, Brazil, Canada, European Union, IADB, IMF, Mexico, USAID, UNDP, and UNICEF.
A strong emphasis has been put throughout the preparation of this report on training and capacity building. Special attention has been put on ensuring as much as possible that the various analytical tools and technics used in this document be transferred to our Haitian counterparts, and many of the quantitative work was carried out jointly with Haitian teams. In this regard, the Team would like to thank particularly all the Haitian participants who attended our various workshops on the Tariff Reform Impact Simulation Tool (TRIST), the subsidy simulation toolkit (SUBSIM), and BOOST, as well as Ibrahim El ghandour (GGODR), Olivier Jammes (Consultant,
GEDDR), and Paulo Verme (Senior Economist, GPVDR) for running these trainings.
The Team is also grateful to a number of colleagues who provided insights, comments and support in the course of the report preparation. They include Lucy Basset (Social Protection Specialist, GSPDR), Malaika Becoulet (Consultant, GTIDR), Ludmilla Buteau (Consultant, GHNDR), Pierre Bonneau (Program Leader, LCC8C), Daniel Boyce (Practice Manager, GGODR), Michelle Keane (Lead County Officer, LCC8C), Donald Mphande (Lead Financial Management Specialist, GCFDR), Deo Ndikumana (Senior Country Officer, LCC8C), Prosper Nindorera (Senior Procurement Specialist, GGODR), Maki Noda (Consultant, GSPDR), Elizabeth Ruppert Bulmer (Lead Economist, GCJDR), Paolo Verme (Senior Economist, GPVDR), and Kanae Watanabe (Country Officer, LCC8C).
Data in Haiti is particularly challenging. This study built on the recently-completed Poverty Assessment, carried out jointly by the World Bank and the ONPES. The expansion in donor assistance and the availability of concessional financing over the past decade has compounded, however, the fragmentation of fiscal data. In this regard, the Team would like to thank the Gates Foundation financing the BOOST Initiative in Haiti, as well as Massimo Mastruzzi (Senior Economist, GGODR) and Leif Jensen (Senior Public Sector Specialist, GGODR) for assisting the Team in this process. Our work on fuel price subsidies would not have been possible without the financial support of the Energy Sector Management Assistance Program (ESMAP), and the help of Sameer Shukla (Senior Energy Specialist, GEEES) and Rohit Khanna (Practice Manager, GEEES).
HAITI PER TEAM
Global Practice/Cross-cuttingArea Team Members
Communication Christelle Chapoy, Berdine Edmond
Education Melissa Adelman, Juan Baron, Eva Junyen, Axelle Latortue Energy & Extractives Frederic Verdol
Governance Emeline Bredy, Mamadou Deme, Ibrahim El ghandour, Eduardo Estrada, Rubens Lacerd, Andy MacDonald, Fabienne Mroczka, Renas Sidahmed, Gerard Verger
Haiti CMU Gabrielle Dujour, Nellie Sew Kwan Kan, David Lighton, Raju Jan Singh, Paula White
Health, Nutrition & Population Eleonora Cavagnero; Marion Cros; Sunil Rajkumar Macro Economics & Fiscal
Management Kassia Antoine, Calvin Djiofack, Evans Jadotte, Naoko Kojo, Jan Loeprick, Julie Lohi, Sandra Milord, Erik von Uexkull, Konstantin Wacker Poverty Facundo Cuevas, Federica Marzo, Aude-Sophie Rodella, Thiago Scot Social Protection Carine Clert, Victoria Strokova, Frieda Vandeninden
Social, Urban, Rural and
Emmanuel Wilkinton fait ses devoirs de sciences à Delmas 32 , Haïti. Emmanuel est l’un des bénéficiaires ayant accès à l’électricité jusqu’à 23 heures et peut maintenant étudier facilement chaque soir.
Acronyms and Abbreviations ...iii
Acknowledgement ...ix
Executive Summary ...xxv
CHAPTER 1 Country Profile ...1
A. Haiti Has Opportunities …. ... 1
B. … Hampered by Political Instability and Natural Disasters ... 2
C. … As Well as Weak Structural Policies and Institutions ... 2
CHAPTER 2 Living With Tighter Budget Constraints ...9
A. Macroeconomic Stability Has Been Maintained … ... 9
B. … With Greater Revenue Mobilization and a Surge in Aid ... 10
C. … Allowing Higher Public Spending ... 12
D. … Despite Widening Deficits, Debt is Expected to Remain Sustainable … ... 13
E. … But Financing Constraints Are Becoming Tighter ... 17
F. … While Natural Disasters Would Call for Larger Fiscal Buffers ... 17
CHAPTER 3 Protecting Priority Spending ...19
A. Haiti Has a Vision Calling for Higher Human and Physical Capital … ... 19
B. … Reflected in the Rise in Public Investment … ... 24
C. … And Greater Priority Given to Social Sectors … ... 26
D. … But Haiti’s Inclusiveness Remains Limited ... 29
CHAPTER 4 TOWARDS GREATER AND MORE EQUITABLE REVENUE MOBILIZATION ...31
A. Despite Some Increase, Revenue Mobilization Remains Low and Regressive… 31 B. … With Exemptions and Ill-Designed Tax Brackets Eroding Direct Taxes… .... 34
C. … And Indirect Taxes Hampered by Weak Revenue Administration and Unclear Exemptions ... 40
D. … But Could Be Bolstered By a Simple VAT ... 42
E. … And Taxes on International Trade Could Be Streamlined ... 44
CHAPTER 5 GETTING A GREATER GROWTH DIVIDEND FROM PUBLIC INVESTMENT ...51
A. High Public Investment Doesn’t Translate into Faster Growth in Haiti… ... 51
B. … Because of an Overly Elaborate and Rarely Respected Regulatory Framework ... 56
C. … Little Strategic Guidance to Select Projects ... 57
D. … A Budgeting Process That is Not Followed ... 60
E. … Weak Procurement… ... 63
F. … Fragmented Project Execution and Administration… ... 65
G. … Limited Physical and Financial Monitoring… ... 69
H. … And a Lack of Ex-post Evaluation (Project Auditing and Evaluation) ... 72
CHAPTER 6 Increasing Sustainability and Improving Further Health Outcomes ...75
A. Although Low, Health Indicators Have Improved … ... 75
B. … But Disparities Remain … ... 79
C. … With Relatively High Health Spending Financed by Donors ... 81
D. … Access to Health Is Limited Especially For the Poor … ... 83
E. … And Public Spending Is Not Geared to Better Services. ... 85
CHAPTER 7 KEEPING CHILDREN IN SCHOOL AND IMPROVING EDUCATION OUTCOMES ...99
A. Despite Progress, Education Outcomes are Low … ... 99
C. … While Public Spending Has Been Recently Rising … ... 104
D. … Its Composition Is Not Conducive to Better Services … ... 107
E. … With Cost Remaining a Main Obstacle to Access… ... 109
F. … And Disparities across Regions and Poor Services ... 110
CHAPTER 8 TOWARDS A MORE EFFECTIVE AND BETTER TARGETED SOCIAL PROTECTION SYSTEM ...113
A. Growing Investments in Social Safety Nets ... 113
B. … Needed By A Vulnerable Population … ... 117
C. … But Too Fragmented … ... 120
D. … Too Small … ... 122
E. … Not Well Targeted … ... 127
F. … And of Limited Impact ... 131
CHAPTER 9 PREVENTING A RETURN OF FUEL SUBSIDIES ...135
A. Fuel Price Subsidies Implied a Heavy Burden on the Budget… ... 135
B. … Are Regressive… ... 138
C. … And Could Return. ... 146
Concluding Observations ...149
List of Annexes
Annex 1 : PIM Process Flowcharts ... 166
Annex 2 : Correlates with Enrollment ... 171
Annex 3 : Correlates with Overage Status ... 172
Annex 4 : EDE PEP Programs: A Glossary ... 173
Annex 5 : Price Structure for Petroleum Products (2010/2011) ... 175
List of Boxes Box 2.1 : Electricité d’Haiti ... 15
Box 2.2 : Petrocaribe and Haiti ... 16
Box 3.1 : Benchmarking the Drivers of Shared Prosperity: An Application to Haiti ... 22
Box 3.2 : Fiscal Data Challenges ... 27
Box 4.1 : International Experience with Tax Incentives ... 35
Box 4.2 : Removing Nuisance Taxes ... 37
Box 4.3 : The CATT Methodology for Benchmarking Customs Performance ... 42
Box 4.4 : The World Bank’s Tariff Reform Impact Simulation Tool (TRIST) ... 48
Box 5.1 : Common Features of PIM in Donor-Dependent Countries ... 54
Box 5.2 : Haiti Legislative Framework ... 56
Box 5.3 : The Share of Recurrent Expenditures in Investment Projects ... 61
Box 5.4 : INTOSAI Conditions Supporting Corruption ... 65
Box 5.5 : Project Completion ... 74
Box 6.1 : Health Care Provision in Haiti ... 86
Box 6.2 : Definitions of Operating Budget Terms ... 88
Box 6.3 : Definition of Technical Efficiency ... 94
Box 6.4 : More Health for Every Dollar: Results-Based Financing ... 96
Box 6.5 : The Right Incentives Lead to Measurable Results in Rwanda ... 97
Box 7.1 : Education Provision in Haiti ... 105
Box 8.1 : Methodology Note on Social Protection Spending ... 125
List of Figures
Figure 1.1 : Annual GDP Growth vs. Change in Government,
1971-2013 (percent) ... 3
Figure 1.2 : Annual GDP Growth vs. Occurrence of Natural Disaster, 1971-2013 (percent) ... 3
Figure 1.3 : Obstacles to Growth ... 4
Figure 1.4 : Change in Governance Indicators, 2004-13 ... 6
Figure 1.5 : Logistic Performance Index, 2014 ... 7
Figure 1.6 : Port Tariffs Estimated Cost Per TEU*, 2009 (in US Dollar). ... 7
Figure 1.7 : Electric Power Consumption, 2011 ... 8
Figure 2.1 : Inflation, 2004-14 ... 10
Figure 2.2 : Gross International Reserves, 2004-14 (Millions of US Dollars) ... 10
Figure 2.3 : Fiscal Revenues, 2004-13 (In Percentage of GDP) ... 12
Figure 2.4 : General Government – Total Revenues, 2000-12 (In Percentage of GDP) ... 12
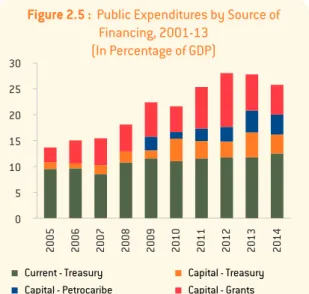
Figure 2.5 : Public Expenditures by Source of Financing, 2001-13 (In Percentage of GDP) ... 13
Figure 2.6 : General Government Expenditure - International Comparison 2004-13 ... 13
Figure 2.7 : Central Government Fiscal Balance, ... 14
Figure 2.8 : Current Account Balance, 2004-14 (Percentage of GDP) ... 14
Figure 2.9 : Haiti – Stock of Debt from Petrocaribe, 2009-14 (In Percentage of GDP) ... 14
Figure 2.10: External Debt (PV), 2014-35 (Percentage of Exports G&S + Remittances) ... 14
Figure 2.11: International Aid, 2008-25 (In Percentage of GDP) ... 17
Figure 2.12: Government Deposits, 2009-14 (In Percentage of GDP)... 17
Figure 2.13: Petrocaribe Financing, 2008-17 (Millions of US Dollars) ... 18
Figure 3.1 : Extreme Poverty Simulations ... 20
Figure 3.2 : Economic Magnitude of Estimated Parameters ... 21
Figure 3.3 : Life Expectancy at Birth, 2010 (Years) ... 23
Figure 3.4 : Cabinet Changes, 2003 (10 Years Average) ... 23
Figure 3.6 : Current Expenditure, 2005-14 (In Percentage of GDP) ... 26
Figure 3.7 : Operating and Capital Expenses, 2005-14 (In Percentage of GDP) ... 26
Figure 3.8 : Changes in Sectoral Composition –... 28
Figure 3.9 : Project Activities Financed by Petrocaribe Funds, 2008-13, (USD Millions) ... 28
Figure 3.10: Project Activities Financed by Petrocaribe Fund, 2008-13, (Percentage of Total) ... 29
Figure 3.11: Donors Financing, 2010-12 (Percentage of Total) ... 29
Figure 3.12: International Comparison - Social Spending, 2013 or latest (In Percentage of GDP) ... 30
Figure 4.1 : Fiscal Revenue, 2009-13 (In Percent of GDP) ... 32
Figure 4.2 : Tax-to-GDP Ratio ... 33
Figure 4.3 : Ratio Direct To Indirect Taxation, 2009 or 2011 ... 34
Figure 4.4 : Corporate (left) and Personal (right) Income Tax Rates in Regional Comparison (Percent) ... 35
Figure 4.5 : Income Tax Rate Thresholds In Regional Comparison (Per Capita GDP) ... 38
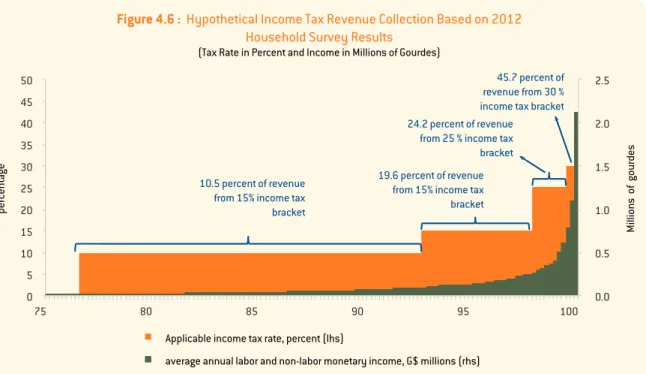
Figure 4.6 : Hypothetical Income Tax Revenue Collection Based on 2012 Household Survey Results ... 39
Figure 4.7 : Hypothetical Effect of Changes in Income Tax Brackets on Revenue Collection ... 40
Figure 4.8 : Results of Haiti Customs Assessment: Distance from ... 41
Figure 4.9 : Tax Revenue Collection around the Introduction of VAT ... 43
Figure 4.10: Applied Protection from Tariffs and Inspection Fees for Four Reform Scenarios ... 48
Figure 5.1 : Capital Investment (a) and (b) ... 52
Figure 5.2 : Public Management Efficiency Index ... 53
Figure 5.3 : Public Investment Management Index – PIM (0=Lowest, 4=Highest) ... 53
Figure 5.4 : Four Stages of the Project Life Cycle ... 55
Figure 5.5 : Required Process for Adding New Projects to the PIP ... 59
Figure 5.6 : Illustrates the Budget Formulation Process for the Preparation of the Investment Budget. ... 62
Figure 5.8 : Complexity in Procurement Processes ... 66
Figure 5.9 : PIP Project Execution Processes ... 67
Figure 5.10: Treasury funded Public Investment ... 70
Figure 5.11: Cash Flows National Treasury Funded Projects 2012-13 ... 71
Figure 5.12: Monitoring and Evaluation on Projects, in PIP, 2011-13 (in Number of Projects) ... 73
Figure 6.1 : Maternal Mortality, 2013 (Per 100,000 live birth) ... 76
Figure 6.2 : Under-5 Child Mortality, 2013 (Per 1,000 live births) ... 76
Figure 6.3 : Health Service Utilization (In Percent of Population) ... 77
Figure 6.4 : Changes in Under-5 Child Mortality Rates, 1990-2013 (per 1,000 live births) ... 78
Figure 6.5 : Maternal Mortality Ratio, 1990-2013 (Per 100,000 live births)... 78
Figure 6.6 : Changes in Life Expectancy at Birth, ... 78
Figure 6.7 : Health Service Utilization, 1994-2012 (In Percent of Population) .... 78
Figure 6.8 : Change in Infant Mortality, 2006-12 (Percentage Points) ... 79
Figure 6.9 : Change in Under-5 Child Mortality, 2006-12 (Percentage Points) ... 79
Figure 6.10: Change in Stunting Rate, 2006-12 (Percentage Points) ... 79
Figure 6.11: Change in Diarrhea Prevalence Rate, 2006-12 (Percentage Points) ... 79
Figure 6.12: Child Health Outcome Indicators, 2012 (Per 1,000 Live Births) ... 81
Figure 6.13: Health Expenditure Per Capita, 2012 (Current US$) ... 82
Figure 6.14: Health Expenditure Per Capita PPP, 1995-2012 (Constant 2005 US$) ... 82
Figure 6.15: Public Health Expenditure, 2012 (Percent of GDP) ... 82
Figure 6.16: Public Health Spending, 2000-12 (Percent of Government Expenditure) ... 82
Figure 6.17: Health Expenditure, 2005-10, (Percentage of Total) ... 82
Figure 6.18: Health Expenditure, 2011-12 (Percentage of Total) ... 82
Figure 6.19: Health Expenditure by Source, 2004-2013 ... 83
Figure 6.20: Barriers to Health Care Access for Women Aged 15-49, 2012 or 2013 (Percentage of Total) ... 84
Figure 6.21: Enrollment of Populations in Risk-Pooling ... 84
Figure 6.22: Incidence of Catastrophic Health Expenditures at ... 85
Figure 6.24: Investment Budget from Public Funds, 2012-13
(Percentage of Total) ... 89 Figure 6.25: Utilization of the Different Types of Structures by Area, 2013 ... 89 Figure 6.26: Density of Medical Personnel, 2013 (Per 10,000 Inhabitants) ... 91 Figure 6.27: Density of Inpatient Beds, 2013 ... 91 Figure 6.28: Density of Medical Personnel by Department – Private for-Profit
Sector Excluded ... 91 Figure 6.29: Number of Beds, exc. Private For-Profit (Per 10,000 Inhabitants) ... 91 Figure 6.30: Density of (a) Medical (b) Paramedical Personnel, and (c)
Community Agents by Location, ... 91 Figure 6.31: Technical Efficiency Score, 45 First-Level ... 93 Figure 6.32: Consultations Per Doctor and Nurse, exc. Private For-Profit
Sector, 2013 (Daily Numbers) ... 94 Figure 6.33: Consultations per Medical Staff ... 94 Figure 6.34: International Comparisons-Share of Administrative Personnel
In Total Number of Primary Health Facilities (Percentage Total) ... 95 Figure 7.1 : Share of 3-25 Year Olds Currently ... 100 Figure 7.2 : Haiti’s Literacy Rate Is Between LIC and LAC Averages ... 100 Figure 7.3 : Figures (a) and (b) - Gross and Net Enrollment Ratios, 2001-12 ... 101 Figure 7.4 : Youth Enrolled in School by Age and ... 104 Figure 7.5 : Number of Primary Schools, 1930-2011 (Number of Schools) ... 105 Figure 7.6 : Donor Financing for Education Sector, 2010-13 ... 105 Figure 7.7 : MENFP Annual Budget Funded by Domestic Resources,
2005-13... 106 Figure 7.8 : Student Beneficiaries by Department, 2013 ... 107 Figure 7.9 : Public Expenditures on Education ... 108 Figure 7.10: Education Budget, 2014 (domestic resources only,
percentage of total) ... 108 Figure 7.11: Education Expenditures by Type, 2012 ... 109 Figure 8.1 : EDE-PEP SSN Financing, By Source, 2013 (Percentage of Total) ... 116 Figure 8.2 : Programs Under EDE PEP ... 116 Figure 8.3 : Chronic Poverty, Multidimensional Deprivation and Transient
Poverty, 2012 (Percent of Total) ... 118 Figure 8.4 : Poverty Headcount by Age Group, 2012 (In Percent) ... 120
Figure 8.5 : Key Risks, the Life Cycle, and Social Protection in Haiti ... 121 Figure 8.6 : Public Expenditure on Social Protection, 2013
(Percentage of GDP) ... 124 Figure 8.7 : Social Safety Net Spending – International Comparison,
2013 or latest (Percent of GDP) ... 126 Figure 8.8 : Distribution of Social Protection Benefits
(Benefit Incidence), 2012 ... 128 Figure 8.9 : Access to Social Security by Income Group, 2012
(Percentage of Total) ... 129 Figure 8.10: Coverage of Social Assistance Programs and Distribution
of Beneficiaries ... 130 Figure 8.11: Coverage of Social Assistance Programs by Age Group, 2012, ... 131 Figure 8.12: EDE PEP Coverage (FAES-Executed) by Region
and Program Type, 2013 ... 132 Figure 8.13: Numbers of Meals Distributed, Kantin Mobile, 2013
(Percentage of Total Population) ... 132 Figure 8.14: Benefit Amounts and Contribution to Consumption
of Beneficiaries ... 132 Figure 9.1 : Evolution of Domestic Price and International Prices
of Oil Products, 2004-14 ... 136 Figure 9.2 : Oil Subsidies Costs, 2010-13 ... 137 Figure 9.3 : Total Post-Tax Costs of Petroleum Subsidies, 2011
(Percentage of GDP) ... 137 Figure 9.4 : Total Post-Tax Costs of Petroleum Subsidies, 2011
(In percent of General Revenues) ... 137 Figure 9.5 : Oil Subsidies and Public Spending Allocation, 2010-12 ... 138 Figure 9.6 : Expenditure on Petroleum Products Per Decile, 2012
(Percentage of Budget) ... 139 Figure 9.7 : Fuel Subsidies Received By Group, 2012 (Percentage of Total) ... 140 Figure 9.8 : Composition of Expenditure by Groups, by Decile, 2012 ... 140 Figure 9.9 : Expenditures by Groups, 2012 ... 140 Figure 9.10: Welfare Loss by Direct Effect (Percentage) ... 141 Figure 9.11: Intensity In Oil Products By Sector ... 142 Figure 9.12: Effect of Prices from the IO Table ... 142 Figure 9.13: Contribution to Inflation ... 142
Figure 9.14: Welfare Loss by Decile (Percent) ... 145 Figure 9.15: Main Source of Lighting, 2012 (percent Households)... 145 Figure 9.16: Households Using Kerosene As Main Source of Lighting,
2012 (Percent) ... 145 Figure 9.17: Total Loss of Welfare by Decile ... 146 Figure 9.18: Welfare Losses by Urban/Rural Areas ... 146
List of Tables
Table 1.1 : Frequency and Impact of Natural Disasters, 1971-2014 ... 3 Table 2.1 : Macroeconomic Indicators ... 11 Table 2.2 : Fiscal Revenues - International Comparison
(In Percentage of GDP) ... 12 Table 3.1 : Fiscal Indicators (In Percent of GDP) ... 25 Table 4.1 : Customs Duties and Inspection Fees (2013) ... 45 Table 4.2 : TRIST Simulations on Four Scenarios of Tariff Reform ... 47 Table 5.1 : Set of Projects Reviewed by Ministerial Affiliations ... 55 Table 5.2 : Procurement Thresholds for State institutions
(in millions of Haitian Gourdes) ... 64 Table 5.3 : Summary of Applications Relating to the Expenditures
and Investment Chain... 71 Table 6.1 : Maternal and Children Health Coverage by Income Group,
2005-6 and 2012 (In Percent of Population) ... 80 Table 6.2. Participation Incidence by Income Groups, 2013
(in Percent of Beneficiaries) ... 85 Table 6.3 : Technical Efficiency In Haiti And Other Low-Income Countries ... 93 Table 7.1 : Late Starts, Repetition, and Drop out Contribute
to Low System Efficiency ... 102 Table 7.2 : National Exam Passing Rates, 2012-13 (In Percent) ... 103 Table 7.3 : Characteristics of Primary Schools by Department,
2010-11 (In Percent) ... 110 Table 8.1 : Social Insurance: Institutions and Programs in Haiti,
Table 8.2 : EDE PEP Fragmentation: Institutions and Programs
by October 2014 ... 123 Table 8.3 : EDE PEP Executed Spending (Actual) in 2013 ... 126 Table 8.4 : Key Donors’ Contributions (Estimates) - Social Protection. ... 127 Table 8.5 : Alignment of EDE PEP Programs with Risks and Vulnerabilities
Across the Life Cycle ... 133 Table 9.1 : Distribution of Oil Subsidies by Fuel Product, 2009-13
(Billion Gourdes) ... 137 Table 9.2 : Average Yearly Expenditure on Fuels (HTG) ... 139 Table 9.3 : Fuel Subsidies Received By Income Decile (Percentage of Total) ... 140 Table 9.4 : Subsidies (Million Gourdes) Given Different Scenarios
Executive Summary
Objectives
1. Haiti has a vision to become an emerging economy by 2030. Haiti has comparative
advantages, including its proximity and access to major markets; a young labor force and a dynamic diaspora; and substantial geographic, historical, and cultural assets. Areas of economic opportunity for Haiti include agribusiness, light manufacturing and tourism. Recognizing these opportunities, the Government of Haiti issued in May 2012 a Strategic Development Plan (PSDH), aiming at building a new modern, diversified, resilient, competitive and inclusive economy, respectful of its environment and in which people’s basic needs are met. Achieving this objective would require ambitious double digit growth rates, a significant break from the past, possibly based on an expansion of agriculture, construction, manufacturing, and tourism.
2. Haiti’s growth performance in the last four decades has been overall disappointing, however, and poverty remains endemic. A
history of vested interests, political instability, and natural disasters, as well as poor governance, inadequate infrastructure and limited skills, have prevented the country to realize up to now its aspirations, trapping it in a low equilibrium.
GDP per capita fell by 0.7 percent per year on average between 1971 and 2013. As a result, Haiti is the poorest country in the Latin America and Caribbean (LAC) region and among the poorest in the world. The overall poverty headcount amounts to about 59 percent and extreme poverty to 24 percent in 2012, indicating that almost 6.3 million Haitians cannot meet their basic needs and 2.5 million cannot even cover their food needs. Furthermore, with a Gini coefficient at 0.6, Haiti has the highest income inequality in the region and one of the highest in the world.
3. Haiti experienced a return of donor assistance and greater access to concessional financing over the past decade. Haiti has long been
characterized by its very low fiscal revenue mobilization, seriously constraining its ability to carry out needed developmental spending (infrastructure, health, education). A lot of basic services are provided in Haiti by non-State actors. Following greater political stability and particularly the 2010 earthquake, the budget has benefitted from exceptional donor assistance with external grants increasing from 2 percent of GDP in 2004 to 8.1 percent in 2013, peaking at 12.1 percent of GDP in 2010. Meanwhile, in addition to benefiting from the HIPC and the
MDRI initiatives, Haiti received additional debt cancellation in the aftermath of the earthquake, reducing its total external debt to 8.9 percent of GDP in 2011 and providing borrowing space that the country used for concessional financing from Venezuela.
4. These resources allowed Haiti to finance a strong expansion in capital spending. Greater donor
assistance and the availability of concessional financing have allowed an expansion in capital spending, a substantial shift in the country’s priorities as reflected by the growing share of public investment: it represented in 2014 more than half of total public spending compared to a third in 2005. In line with higher own fiscal revenue, current expenditure has also been on the rise, increasing from just below 10 percent of GDP in 2005 to about 13 percent GDP in 2014, driven by a higher wage bill: wages in relation to GDP rose significantly from 2005 to 2014 (from 3.5 to about 6 percent of GDP).
5. Priority spending in Haiti has also increased.
The fragmented fiscal data available would suggest that these additional resources have been channeled to the reconstruction and social sectors, consistent with the decline in poverty and improvements in human development indicators (such as in education) observed over the same period. Overall, the share of resources allocated to social sectors seems to have expanded from an average of about 16 percent of total public spending for the period 2007 to 2010 to about 28 percent of total public spending after the earthquake, for the period 2010 to 2012. In addition, 22 percent of donor assistance on average is estimated to have gone towards social sectors over the period of 2010 to 2012.
6. The composition of public spending may, however, not be conducive to better services.
Part of the growing wage bill reflects, however, increases in support, administrative or security staff, and not in staff directly delivering social services. Furthermore, operating costs more
specifically (e.g. equipment, utilities) have not kept up with rising public investment, remaining broadly unchanged over the past decade. Without the needed resources to operate the newly built investments and equipment, it is questionable whether the new facilities could be maintained or deliver the expected growth dividends.
7. Furthermore, despite the recent increase in social public spending, Haiti’s economic inclusiveness is still limited. Social spending
remains limited and the delivery of basic services highly inequitable. Public spending in health, education, and social protection amounts to 5 percent of GDP, below comparator countries, limiting the government’s ability to offer equal opportunities to its citizens. At the same time, many large spending items such as fuel subsidies clearly favor the rich. In the absence of government, basic services such as health and education are mainly provided by
non-government actors. Seventy to eighty percent
of primary school students attend non-public schools, placing a substantial financial burden on households and delivering achievements closely linked with household income. Outcomes are equally unfavorable to the poor in the health sector and only a small share of the poor can benefit from basic safety nets.
8. Haiti needs now to adjust to tighter budget constraints. An expansion of aid and
concessional borrowing has allowed Haiti to increase public spending and catch up with regional comparators. It has, however, also increased its reliance on foreign assistance as source of financing. Donor assistance and concessional financing represent about 70 percent of the financing for public capital spending. Social sectors including health, education and social protection rely on donor assistance for 45 percent of their financing in 2012. This heavy reliance on donor and concessional financing makes these spending items particularly vulnerable to the decline in
aid and in international oil prices (which affect the availability of concessional resources from Venezuela). These tighter constraints could put into question some of the recent progress achieved in human development, making the country’s balancing act between developmental needs and fiscal sustainability even more challenging. In this regard, this report examines more particularly how to:
i. mobilize greater fiscal revenue;
ii. enhance the growth dividend of public investment;
iii. improve the efficiency of spending in critical sectors such as health, education, and social protection; and
iv. protect the budget from a return of fuel price subsidies.
9. Against this backdrop, this study aims at contributing to an evidence base to inform decision-making. This report builds on newly
available data, including the 2012 household survey, the 2012 Demographic and Health Survey (DHS), and the 2011/12 School Census, to provide a better understanding of the equity and sustainability issues in the delivery of some basic services such as health and education, and engage policy makers and other actors on gaps and priorities. The surge in donor assistance and the availability of concessional financing have exacerbated the fragmentation of fiscal data in Haiti. As part of the study, a special effort has been made to partially consolidate fiscal data and gather a more comprehensive picture of the use of public resources (BOOST Initiative). Finally, the document builds on the recently completed Public Investment Management Diagnostic and Assessment (PIMDA) that has led to an action plan to improve the management of public investment in Haiti.
Findings
Greater and More Equitable Revenue
Mobilization
10. While own fiscal revenue has increased over the past decade, Haiti has still one of the lowest revenue mobilization rates in the region.
Haiti’s own fiscal revenues have improved going from less than 10 percent of GDP in 2004 to 12.6 percent of GDP in 2014. Despite this rise in revenue, Haiti has still one of the lowest rates of revenue mobilization in the region. Furthermore, Haiti’s tax system tends to be regressive, relying heavily on indirect taxes. The ratio of direct to indirect taxes stood at about 30 percent in 2011, a level inferior to that of most countries in LAC and to the average of Low-Income Countries, and is largely explained by the fact that a sizable share of Haiti’s revenues comes from international trade. Tax systems relying relatively more on direct taxes tend to be more progressive because in such systems the burden of taxes weighs differently on economic agents of varying income levels. Moreover, while direct taxes tend to be harder to administer, they are frequently seen as an important indicator and tool of successful state-building as they tend to create a more direct citizen-state interaction and voice.
11. With income tax rates largely comparable to the regional average, a large share of revenue is, however, lost because of exemptions.
Corporate and personal income tax rates are largely comparable to the regional average and cannot explain Haiti’s low tax burden. For instance, Haiti’s corporate income tax rate of 30 percent is slightly above the regional average. Exemptions, however, are estimated to have amounted in 2011 to the equivalent of more than half of all income tax collected. Most exemptions derive from the 2002 investment code that grants 15-year-tax exemptions for companies in free
zones as well as 5-10 year exemptions for specific investment projects that are considered desirable from a development perspective. International experience tends to show, however, that lower taxation does not compensate for an unfavorable investment climate and foster little additional investment. Anecdotal evidence suggests a number of taxes that generate little revenue but impose high compliance costs on businesses (“nuisance” taxes) and reducing them would be a better alternative to attract investors.
12. The top personal income tax rate seems to apply only to very few taxpayers. While top
income tax rates are also in line with other countries in the region (30 percent), income brackets are defined in such a way that the top rates only apply to a small share of taxpayers. There are currently four tax bands for personal income tax: 10 percent on incomes above HTG 20,000 and below 100,000; 15 percent up to HTG 250,000; 25 percent up to HTG 750,000; and 30 percent for everything above that. The maximum rate is thus levied at incomes above more than twenty times the national average per capita GDP, more than twice the ratio for the next highest comparator country (Guatemala at about eight times).
13. Substantial fiscal revenue shortfalls also occur at the borders. The largest share of fiscal revenue
in Haiti (60 percent) is collected at the border through customs duties, inspection fees, and sales and excise taxes on imported goods. While no complete data is available on TCA and excise tax exemptions, detailed transaction level data on taxes collected at the border makes it possible to calculate the value of exemptions on imported products. Estimating the foregone revenue by comparing the actual revenue collected to the amount an importer should have normally paid had the official rate been applied suggests that Haiti gave up in 2013 the equivalent of 14 percent of total sales tax revenue collected at the border, plus another 19 percent in ad valorem excise
taxes. For tariffs, the revenue shortfall rises to 50 percent and the classification of exemptions in customs data is insufficient to thoroughly track their justification.
14. Finally, while Haiti is one of the most open economies, inspection fees increase the country’s effective protection. While Haiti is
one of the most open economies with very low tariffs, it imposes various fees that add up to the cost of importing goods. A 5 percent inspection fee is applied to almost all imported products, increasing tariff revenues by about 75 percent in 2013. Inspection fees in the magnitude applied in Haiti mask the true level of protection in the country. Being applied across the board with an identical rate for almost all products, they are unlikely to be in line with the country’s strategic trade objectives that would normally suggest placing a higher tariff on consumer goods, and lower tariffs on key inputs and capital goods. Meanwhile, Haiti is a member of CARICOM, but applies lower tariffs. Alignment of Haiti’s tariffs to the current CARICOM Common External Tariff could generate significant additional revenue, but also substantially raise protection and costs for firms and consumers. One way forward could be to replace the inspection fees with a combination of higher regular tariffs and a removal of exemptions with no loss in total revenue and no increase in protection.
Getting a Greater Growth Dividend from
Public Investment
15. Despite rising public investment, economic growth has not accelerated so far in Haiti. Haiti
still performs poorly for selected infrastructure indicators, such as access to electricity, roads or ports. In this context, high public investment should be expected to contribute in reducing bottlenecks to faster growth. This paradox is, however, nothing new in Haiti. Several reasons have been put forward, ranging from
deficiencies in the country’s national accounting system to chronic lack of maintenance or simply the unproductive nature of the investment itself. Poor past donor coordination and the high volatility of external aid have also been argued to have affected the impact of investments in Haiti.
16. This disappointing outcome stems in part from very weak public investment management.
Haiti’s public investment management exhibits a number of distinctive features and practices common to countries that are aid-dependent, including weak appraisal capacity and reliance on donors to design good projects. These hamper the effectiveness of public investments. Sectoral strategies to guide the prioritization of projects are lacking. This leads to a Public Investment Program composed of projects that are neither fully assessed nor prioritized. Furthermore, there is no effective ex-ante control on disbursements based on the physical progress of projects against plans. More importantly, domestically-funded capital expenditures are not properly accounted for, tracked and reported, creating an environment conducive to a lack of transparency and accountability, as well as to mismanagement of scarce public resources. Finally, even though the existing legal framework is acceptable for the management of public investments, its requirements are rarely respected, with numerous processes and procedures that, when not redundant, are excessively elaborate.
Increasing Sustainability and Improving
Further Health Outcomes
17. Health indicators have improved over the last two decades. Child health indicators have
improved for instance with the under-five mortality rate declining from 145 deaths per 1,000 live births in 1990 to 73 deaths per 1,000 births in 2013. Haitians can now expect to live 8 more years than back in 1990, two additional years gained compared to the progress made
by the average LAC country. The gap in health outcomes between rich and poor households has also narrowed. Significant gains have been made in infant mortality for the poorest quintile, as well as the second and third quintiles over the last decade. Reduction in stunting and in the prevalence of diarrhea has been more pronounced for poor income groups.
18. Health indicators in Haiti remain, nevertheless, poor and disparities persist. The under-five
mortality rate is four times higher than the LAC regional average. The 2012 DHS generally shows large inequalities in health outcomes and results that are worse for the poorest quintiles. Infant mortality was thus found to be 62 (per 1,000 live births) for the highest quintile of income, versus 104 for the lowest quintile of income in 2012. Compared to the highest quintile, the number of children suffering from stunting was four times higher in the lowest quintile in 2012 (DHS, 2012), a gap that has not changed since 2006.
19. While the level of total health expenditure per capita is relatively high in Haiti, public spending in health is very low. Health
expenditure per capita in Haiti has increased in line with the average of low-income countries and at USD 76.6 per capita stood in 2012 above what the average low-income country spends. According to the WHO, USD 50 per capita would ensure the provision of a basic care package to the population. Haiti was allocating, however, only 5 percent of government spending to health in 2013-14, well behind the 15 percent recommended by the Abuja Declaration, and government spending accounted for only about 1.5 percent of GDP, a low rate compared to other low- and middle-income countries, spending on average between 2 and 6 percent of GDP. This high level of per capita expenditure was thus mainly financed by external funding, which surged after the earthquake but has been declining since 2012.
20. Despite the recent increase in donor assistance, lack of finance still prevents the poor from seeking treatment. In 2012, total health
expenditure was largely financed by donors in Haiti, more so than in other low-income countries, questioning the sustainability of the recently-achieved progress. The surge in donor assistance seems to have been accompanied by a substantial decline in the contribution of households to their health expenditure. This development should have improved access to health services for the poorest. Yet, the most recent household survey reveals that 65 percent of households in the lowest consumption quintiles did not seek medical attention due to their lack of money against 39 percent for the highest consumption quintiles. Moreover, lack of money for treatment is most frequently cited as a barrier to health care in Haiti by women aged 15-49 (76 percent).
21. The composition of public spending may not be conducive to better service delivery. The
health sector is a good example, showing that overall operational spending has not kept up with the recent rise in public investment. While operating expenditure has changed little, the investment budget from public funds (Treasury and Petrocaribe) in this sector has doubled between 2006 and 2013. Moreover, the wage bill may be crowding out critical operating expenses (such as medicine and equipment) with the share of the operating budget allocated to personnel costs representing about 90 percent over the period 2006 to 2012. Furthermore, public investment may not be targeted where it
is most needed: in 2012, for instance, nearly a
third of the commitments of national investment funds were allocated to the construction or rehabilitation of hospitals and only 22 percent of the commitments were allocated to investment projects for dispensaries and health centers, although these facilities account for 87 percent of health care delivery in Haiti.
22. The productivity of the medical personnel of first-level primary facilities is low. Only
13 percent of health facilities are estimated to produce health services efficiently: they have neither excessive operating costs, nor excessive personnel. In particular, the number of consultations is low with one patient per hour, much lower than in comparable countries. A second occupation could explain low productivity with evidence revealing often that half of the medical personnel derive an income from sales activities or from a private practice. Excessive administrative personnel may also undermine efficiency. Administrative personnel represents 40 percent of total institutional personnel although in general the need for such personnel in primary level facilities is low. These facilities are small and have little or no equipment (for dispensaries), requiring a low level of maintenance and management, and therefore few administrative personnel.
Keeping Children in School and Improving
Education Outcomes
23. Today, the majority of children are in school in Haiti. The majority of preschool age children,
and 90 percent of children of official primary school age (6-11), are in school. Educational attainment has also been rising steadily across cohorts of young adults. In 1994, fewer than 30 percent of 15-19 year olds had reached lower secondary school, a figure which had risen to over 50 percent for women and over 40 percent for men by 2012.
24. Despite this progress, education indicators remain low with late primary school entry, high dropout, and limited learning. Compared
to its LAC neighbors, Haiti has the highest share of adults with no education, and the highest share of 15-19 year olds who have not completed primary school. The adult literacy rate is about 77 percent, midway between the LIC and the
LAC averages. Furthermore, many students, particularly in poor communities, learn little. Indicators of the quality of education, including teacher knowledge and learning materials available at the school level, suggest that many children, particularly poor ones, are receiving a low-quality primary education. Assessments administered in early grades in selected schools have found that fundamental skills are acquired very slowly or not at all, particularly in schools in poor communities. For example, the average third grader reads only 23 words per minute, well below the estimated speed of 35-60 words per minute required for comprehension of a basic text.
25. Growth in education supply has primarily come from the non-public sector, making Haiti one of the countries with the largest non-public sectors at the primary and secondary levels. According to the 2010-11 School
Census (the most recent published), 94 percent of preschool, 78 percent of primary, and 73 percent of secondary students attend non-public schools. These shares are among the highest in the world. Tuition waivers for students in non-public primary schools have, however, been put in place to help children access school. Donors are financing a complete cycle of primary school for cohorts of children in disadvantaged communities by providing tuition waivers to non-public schools, while the authorities are financing a similar program financed by a new tax on international phone calls and money transfers. Declining donor financing and a recent decision by the Ministry of Education to stop funding tuition waivers for new cohorts of first graders in non-public schools could therefore threaten the gains in access made in recent years.
26. As in health, however, the composition of public spending is not conducive to better services. The operating budget of the Ministry
of Education is skewed towards non-“front line” staff. In 2013, for instance, almost 70 percent of
the operating budget is allocated to salaries and personnel costs. Although, this share is in line with other LAC countries (where 60-80 percent of the total education budget is absorbed by the wage bill), the public sector in these countries pays the majority of all primary and secondary teachers, while in Haiti the State only directly employs those in the small public sector. As a result, about 42 percent of salary expenditures go to staff who are not working as teachers, directors, or inspectors. Furthermore, half of non-salary operating expenditures go towards textbooks, national exams, and the national school canteen program.
27. Despite weak progression and learning, households spend a substantial amount on sending children to school. Among all
households with children age 6-14 in school, 93 percent report positive education expenditures. These expenditures are substantial: on average, these households reported spending 10 percent of total annual household consumption on education in the 2011-12 school year. Consequently, costs remain a major obstacle to education for poor households: when asked why school-aged children are not currently in school, 83 percent of households cite costs as the primary reason.
Towards a More Effective and Better Targeted
Social Protection System
28. The chronic and transient poor should be an important focus of an effective social protection system in Haiti. Although poverty
is widespread in Haiti, rural areas and specific geographic departments require special attention from the social protection system. Nearly half the households are considered chronically poor because they live below the moderate poverty line and lack at least three of the seven basic dimensions defining non-monetary well-being. Such a large share of chronic poverty, unusual
in Latin America, highlights the structural challenges of poverty reduction and limitations of the contributions of social protection interventions without combined interventions around basic services and income generation. Haiti’s social protection system should also be able to include the transient poor with one million people living slightly above the poverty line but vulnerable to drop below if a shock (weather or health-related) occurred. Natural disasters, in particular, have great disruptive potential partly because they have such a serious impact on agriculture, which represents the main source of livelihood for most of the poor, especially in rural areas.
29. During the last three years (2012-14), there have been encouraging signs of increased attention for social protection as a framework to address both short-term and long-term vulnerability and poverty reduction. In 2012,
the national strategy for fighting hunger and malnutrition, ‘Aba Grangou’, was launched, with the aim of coordinating donor and government activities in the nutrition sector. A notable step toward the formation of a social protection strategy was taken in 2014 with the launch of the three-year action plan “Thinking and Fighting for a Haiti without Poverty: Action Plan for Accelerating the Reduction of Extreme Poverty” (PAARP). This document defines a set of flagship programs constituting a social assistance strategy named “EDE PEP” to protect the vulnerable population living in extreme poverty throughout their life cycle, in the short and medium term, to ensure long-term investment in human capital and to provide opportunities to overcome the condition of extreme poverty. The PAARP also identifies a set of elements required to underpin the implementation of a social protection system, such as a national targeting system, a unique beneficiary registry, and an integrated service delivery model at communal level through a
network of multi-sectorial agents, as well as local coordination on social protection.
30. Despite these efforts, social protection spending has still a long way to go to become more aligned with challenges at hand. More
investment is particularly needed for children under five as this group suffers from the highest poverty rates and as a lack of investment in young children has irreversible negative consequences. As shown in the education and health findings, there is a need for a set of social protection and promotion interventions that would enable the poorest households (especially those in rural areas with young children) to overcome hurdles in building, accumulating, and preserving their human capital in the face of repeated shocks.
31. Furthermore, the various programs building Haiti’s social protection system are excessively fragmented, small, and not targeted well enough to make a difference.
Within government’s public spending on social protection, both the contributory (social insurance) and non-contributory pillars (social safety nets) are spread across multiple institutions, challenging the country’s weak administrative capacity. Public spending in social protection is low, amounting to about 5 percent of GDP with subsidies for electricity and petroleum products representing a considerable share (2 percent of GDP). In addition, social assistance benefits are not well targeted: the results of the most recent household survey suggest that as much as half of social assistance benefits accrues to the non-poor. As a consequence, social protection programs have limited impact on poverty and inequality. Finally, most EDE PEP programs are financed principally by concessional borrowing, which poses challenges in terms of their sustainability.
Preventing a Return of Fuel Price Subsidies
32. The size of oil subsidies in Haiti had increased dramatically over the last five years, imposing
a large burden on public finances. Haiti raised
retail fuel prices in October 2014, a notoriously difficult reform, especially in a fragile situation. This move combined with a decline in international oil prices has allowed to eliminate the fuel price subsidies that were burdening the budget. Like other net oil-importing developing countries, Haiti has faced economic difficulties with high oil prices. Haiti has been for a long time cautious passing through the increase in international oil prices to consumers. In 2010, it abandoned a mechanism of automatic pass-through, and adopted a price control system through adjustments in taxes. As the gap between international and domestic prices widened, the cost of keeping retail petroleum prices fixed was placing an increasingly significant burden on public finances (nearly 2 percent of GDP in 2013).
33. Subsidized fuels are mainly consumed by the wealthiest households. Poor households in
Haiti consume very little fuel, both in absolute terms and as a share of their total budget. As a result, the poor receive only 1.6 percent of total subsidies accruing directly to households. Since direct usage of petroleum products is so limited among the poor, wealthier households benefit disproportionally from subsidies granted to these products: over 93 percent of fuel subsidies going directly to households benefit the richest 20 percent of the population. Even though there are no data on expenditures on kerosene, there is some indication, nevertheless, that poor households in rural areas would be the most affected by increases in the prices of this product: among the rural poor, over 80 percent of households use kerosene as main source of fuel. Fuel subsidies are particularly regressive when compared to subsidies on other categories of consumer expenditures, such as food, education and health: because these items represent a larger share in their budget, the poor would receive between 30 percent and 40 percent of the
benefits from a universal reduction in education, health, and food prices.
34. Increases in fuel prices have large effects on electricity and transportation, however, and poor households are especially vulnerable to increases in food prices. Directly, households
are affected through their own consumption of gasoline or kerosene. Indirectly, they are also affected since petroleum products are used as intermediary products in many sectors and their higher price will feed into the price of the final good produced by these sectors. The analysis of the indirect effects suggests that an increase in fuel prices would have the largest direct impact on transportation and electricity, in which oil products account for more than 30 percent of total inputs. Even though the production of food is not intensive in fuel, rises in food prices nevertheless impose a sizeable loss of welfare on the poorest households, due to the large share of food in their budgets.
35. The budget remains vulnerable to a rebound in international oil prices. Fuel subsidies have been eliminated in October 2014. International oil prices are, however, volatile and without the introduction of an automatic price adjustment mechanism for petroleum products, fuel price subsidies could return to haunt the budget, but this time under tighter financing constraints. The subsidies, which amounted to around 2 percent of GDP in 2013, could climb to over 3 percent of GDP with international prices at USD 100/barrel.
Going Forward
36. Against this background, some options going forward present themselves. While the report
wanted to provide mainly a diagnostic and a better understanding of some critical sectors such as health and education, some broad options going forward can nevertheless be suggested as basis for discussion:
• Data: Overall tighter financing constraints
make it even more urgent to collect timely data to track public spending appropriately and make it more efficient in different sectors. Differences in budget classifications and the absence of an effective Single Treasury Account lead to a fragmentation of fiscal data and prevents a comprehensive monitoring of public spending from budget appropriation to payment. Fiscal reporting needs thus to be strengthened to allow an appropriate tracking of public spending and set in place the minimum conditions for transparency and accountability in the use of public resources. Completing the roll-out of the Single Treasury Account and unifying the budget classifications among the various sources of financing would be important steps in this direction.
• Donors: With declining donor assistance,
greater donor coordination is needed to make the most of these resources. A master plan for critical sectors translating the priorities of these sectors into areas of intervention could federate the actions of the donor community, allowing it to coordinate its technical and financial contributions, and avoid potential duplication and inefficiencies. Such a
plan would have indicators and deadlines,
triennial operational plans, and an annual action plans to structure the monitoring of its implementation.
• Budget composition: The composition of
public spending has room for improvement to enable better service delivery. The growing wage bill, although in line with economies at similar levels of development, has been the driving force of total current spending, but most of it is accounted for by staff not directly involved in service delivery. Sharp increases in capital outlays have not contributed to the acceleration of growth, due in part to an inadequate resource allocation for operating
and maintenance expenses (e.g., equipment, utilities), thereby limiting growth dividends of investment.
• Fiscal revenue: Balancing fiscal sustainability
and development needs will remain a daunting challenge for Haiti as long as the country does not mobilize substantially more own fiscal resources. In this regard, a review would be needed of existing exemption regimes for all tax instruments with priority to customs duties and corporate income tax where revenue losses are the greatest. An important step would be the introduction of a clear classification system in customs data to track the justification of exemptions. Where tax exemptions or other investment incentives are used, a clear framework needs to be put in place to measure and track their costs. At the same time, it is important to track and monitor the benefits these incentives were expected to deliver (such as employment creation or technology transfer).
• Greater growth dividend: Haiti’s
development needs are daunting and will need to be addressed. In this regard, the overall public investment management needs to be improved through a strengthening of project evaluation, selection, programming, execution, and control. As a first step, the priority should be put on implementing basic elements of formal project selection and appraisal, execution and controls such as the need for investment projects to (i) advance only if they are mature enough (i.e. developed in a concept or in a justification); (ii) be monitored (including physically); (iii) use resources adequately; (iv) are controlled ex-post as required.
• Improve the performance of health facilities:
For a long time the focus has been put on increasing the resources or the inputs. With shrinking budgets, the time may have come to shift the logic upside down and pay more