O
pen
A
rchive
T
OULOUSE
A
rchive
O
uverte (
OATAO
)
OATAO is an open access repository that collects the work of Toulouse researchers and makes it freely available over the web where possible.This is an author-deposited version published in : http://oatao.univ-toulouse.fr/
Eprints ID : 14060
To link to this article : DOI:10.4028/www.scientific.net/MSF.765.130
URL :http://dx.doi.org/10.4028/www.scientific.net/MSF.765.130
To cite this version : Ferdian, Deni and Lacaze, Jacques and
Lizarralde, Ibon and Niklas, Andrea and Fernandez-Calvo, Ana Isabel
Study of the Effect of Cooling Rate on Eutectic Modification in A356 Aluminium Alloys. (2013) Materials Science Forum, vol. 765. pp.
130-134. ISSN 0255-5476
Any correspondance concerning this service should be sent to the repository administrator: [email protected]
Study of the Effect of Cooling Rate on Eutectic Modification
in A356 Aluminium Alloys
D. Ferdian
1,2,a, J. Lacaze
1,b, I. Lizarralde
3,c, A. Niklas
3,dand A.I. Fernández-Calvo
3,e1
CIRIMAT, Université de Toulouse, ENSIACET, BP 44362, 31030 Toulouse, Cedex 4, France
2
Dept. Metallurgy and Material, Universitas Indonesia, Kampus Baru UI Depok, 16424, Indonesia
3
Engineering and Foundry Processes, IK4-AZTERLAN, Aliendalde Auzunea 6, E-48200 Durango (Bizkaia), Spain
a
[email protected], [email protected], [email protected], [email protected],
e
Keywords: A356 alloy, Thermal analysis, Differential thermal analysis, Eutectic modification Abstract. In this present work, an assessment of eutectic modification based on thermal analysis
was performed on modified A356 alloy. The effect of various cooling rates which were achieved by means of casting samples with various moduli in sand and metallic moulds was investigated. Cooling curves recorded from thermocouples inserted in the centre of the samples showed characteristic undercooling and recalescence associated with (Al)-Si eutectic modification. The results showed that cooling rate has a role in observed modification level. Furthermore, differential thermal analysis was included to determine the eutectic melting temperature.
Introduction
Thermal analysis has been used for a long time in the foundry industry to monitor melt quality prior to casting. In aluminium casting, parameters such as nucleation undercooling and eutectic temperature depression are associated with grain refinement and silicon modification level respectively [1,2]. A356 grade classified as hypoeutectic Al-Si-Mg alloy, is commonly used due to its superior castability and good mechanical properties, especially after heat treatment (T6) owing to
precipitation of fine Mg2Si [3]. This alloy is widely used in permanent die casting and sand casting,
e.g. for manufacturing automotive components such as cast wheels and engine blocks. In this paper, an assessment of the effect of cooling rate on eutectic modification of A356 alloy was performed on samples of various thermal moduli cast in sand and metallic moulds at nearly constant Sr level.
Experimental Procedure
Three modified A356 alloys with chemical compositions listed in Table 1 were cast in both sand and metallic moulds following a procedure previously described [4]. These moulds consist of a set of cylinders of different sizes which were designed in such a way that the height of each cylinder was equal to its diameter. Each cylinder was equipped with a thermocouple located at its geometrical centre and the cooling curves were recorded using the Thermolan-Al system [5]. However, some of the cooling curves were not obtained because of thermocouple failure. The
thermal modulus (TM) values and the corresponding range of eutectic cooling rates CRe (see Fig. 1)
are listed in Table 2. At the time of casting, a standard cup for thermal analysis (TA) with TM = 0.605 cm was also poured and its cooling curve recorded.
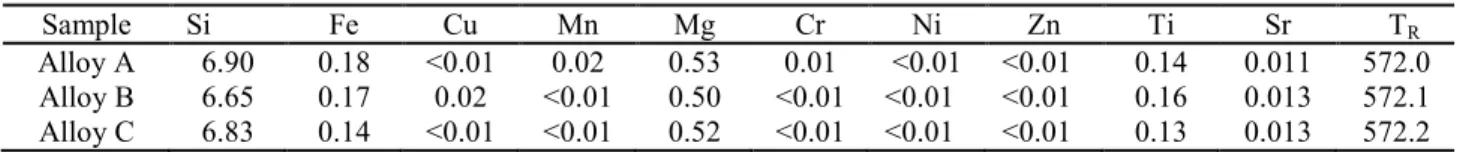
Table 1. Chemical composition (wt.%) of studied A356 alloys and reference temperature TR (°C).
Sample Si Fe Cu Mn Mg Cr Ni Zn Ti Sr TR
Alloy A 6.90 0.18 <0.01 0.02 0.53 0.01 <0.01 <0.01 0.14 0.011 572.0
Alloy B 6.65 0.17 0.02 <0.01 0.50 <0.01 <0.01 <0.01 0.16 0.013 572.1
Fig. 1. Parameters taken from thermal analysis cooling curves for characterizing the (Al)-Si eutectic arrest. Table 2. Thermal moduli (TM) and ranges of eutectic cooling rate (CRe) of cylinder test samples.
Sand mould TM [cm] 1.5 1.15 1 0.8 0.6 0.4 -
CRe [oC/s] 0.18-0.20 0.22-0.32 0.36-0.38 0.69-0.72 1.1 2.5-2.8 -
Metallic mould TM [cm] - 1.15 1 0.8 0.6 0.4 0.3
CRe [oC/s] - 2.6-2.8 3.0 4.2-5.0 5.5-6.5 7.5-11 13-16
This study is focused on parameters related to the (Al)-Si eutectic reaction as obtained from the cooling curves according to the nomenclature shown in Fig. 1. These parameters are defined as follows:
• Minimum eutectic temperature (Te,min), maximum eutectic temperature (Te,max) and
recalescence (∆Te). In the case of no recalescence, the Te,max was obtained as the temperature
for which the absolute value of the cooling rate (time derivative of the cooling curve) was highest.
• ∆Td = TR - Te,max, is the eutectic depression, where TR is the equilibrium eutectic temperature
calculated using an equation obtained by updating the one proposed by Mondolfo [6], where
the weight percentage, wi, of alloying elements i are considered:
( )
(
Mg Fe Cu Zn Mn Ni)
Si o R 4.59 w 1.37 w 1.65 w 0.35 w 2.54w 3.52 w w 5 . 12 577 C T = − ⋅ ⋅ + ⋅ + ⋅ + ⋅ + ⋅ + ⋅ (1)Eutectic cooling rate (CRe) was measured from the slope of the cooling curve (600 °C to 575 oC)
after primary (Al) nucleation and prior to the (Al)-Si eutectic reaction.
Furthermore, samples machined out from the cast cylinders were subjected to differential thermal analysis (DTA) using a SETARAM–SETSYS apparatus to evaluate the eutectic temperature. DTA signals were recorded with scanning rates for heating and cooling of 2, 5 and 10 °C/min. Each run used the same sample and low argon flux was used during the entire experiment. Finally, evaluation of the modification level was performed using the AFS chart [2], according to which well-modified structures present an index higher than 3.5.
Results
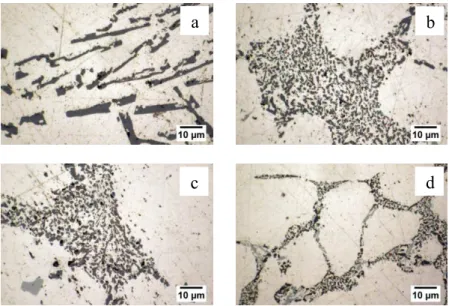
Microstructure Analysis. Fig. 2 illustrates the as cast microstructure and silicon modification for
the two extreme moduli of both moulds. In the case of metallic mould, the eutectic silicon was well modified in all cylinders. However, in the case of large thermal moduli in the sand mould, the silicon modification appeared incomplete. This relates to the low effectiveness of Sr modification which is known at low cooling rates [7]. Observation of the microstructures also revealed other
phases such as π-(Al8FeMg3Si6), Mg2Si and β-Al5FeSi phases associated with the so-called final
Fig. 2. Microstructure of alloy A samples, cast in sand (a, c) and metallic (b and d) moulds with maximum (a and b) and minimum (c and d) thermal modulus.
Thermal Analysis. Fig. 3 shows the cooling curves in the eutectic region obtained from all records
with alloy A. The dashed line represents the TA standard cup record. As the cooling rate increases, the total solidification and eutectic plateau times are reduced. Recalescence of the (Al)-Si eutectic reaction is clearly visible on all sand mould records while it is not visible for the biggest metal mould samples. Observation of the cooling curves revealed also that the final eutectic reaction is visible only in the sand mould at low cooling rates. Correlation between the eutectic cooling rate
and maximum eutectic temperature (Te,max) is illustrated in Fig. 4a, which shows that the maximum
eutectic temperature decreases as the eutectic cooling rate increases. Fig. 4b illustrates that there is
no direct correlation or trend between eutectic cooling rate and recalescence (∆Te).
Fig. 3. Cooling curves obtained for cylindrical samples of different thermal moduli with alloy A, cast in sand (a) and metallic (b) moulds.
Fig. 4. Correlation between maximum eutectic temperature, Te,max (a) and recalescence, ∆Te
(b) versus eutectic cooling rate. 540 550 560 570 580 590 600 0 200 400 600 Time (s)800 T e m p e ra tu re ( o C ) 540 550 560 570 580 590 600 0 20 40 60 Time (s)80 T e m p e ra tu re ( o C) 545 550 555 560 565 570 0 5 10 15 CRe ( 20 o C/s) e u te c ti c t e m p e ra tu re ( o C )
A-sand mould A-metal mould B-sand mould B-metal mould C-sand mould C-metal mould
0 0.5 1 1.5 2 2.5 3 3.5 0 5 10 15CRe ( 20 o C/s) re c a le s c e n c e ( o C)
A-sand mould A-metal mould B-sand mould B-metal mould C-sand mould C-metal mould
a b a b a c b d
0 5 10 15 20 25 0,0 1,0 2,0 3,0 CR4,0e0,5(oC/s)5,00.5 E u te c ti c d e p re s s io n ( o C ) Alloy A Alloy B Alloy C Modified (Al)-Si
DTA Results. Fig. 5 presents the DTA record upon cooling and heating alloy A at 2 °C/min. The
thermogram shows successive reactions upon solidification: precipitation of (Al) dendrites (1), of the (Al)-Si eutectic (2) and of the final eutectic (3). This latter peak was seen to split in two thermal arrests (3a and 3b) at low scanning rates. Three thermal peaks could similarly be identified on heating records. The start and peak temperatures for (Al)-Si precipitation were evaluated on all the heating and cooling thermograms. These values are plotted versus the scanning rate in Fig. 6 for alloy A, while the results for the two other alloys were nearly superimposed on these ones. The shift of the characteristic temperatures when the scanning rate increases is mainly caused by the thermal resistance in thermocouple measurement of the DTA apparatus [8]. The values obtained by extrapolation to a zero scanning rate are thus expected to be the relevant equilibrium temperatures to be discussed below.
The peak temperature upon heating extrapolates to 574 oC, only slightly above the calculated TR
values at 572.0-572.2 oC. This peak temperature is at about 10 oC above the start temperature upon
cooling which shows that modification affects the eutectic reaction temperature at the slow cooling rates achieved in DTA even though the microstructure appeared unmodified. It is interesting to note that the peak temperature on cooling, which represents the end of the (Al)-Si eutectic reaction, extrapolates to about the same temperature as the start temperature on heating. This temperature
(559±1 oC) appears slightly above the final eutectic temperature of about 555 °C [9-11], thus
showing the extent of the (Al)-Si eutectic.
Fig. 5. DTA thermograms recorded upon cooling and heating at 2 °C/min of alloy A (the records were adjusted along the y axis to separate the curves for easier reading).
Fig. 6. Effect of scanning rate on the characteristic temperatures of the (Al)-Si eutectic thermal arrest of alloy A.
Fig. 7. Evolution of the eutectic depression (∆Td)
with the square root of the eutectic cooling rate. Crosses represent data without recalescence.
Discussion
Typical solidification sequence for A356 alloy can be referred to in works by Bäkerud et al. [9], Mackay et al. [10], and Closset and Gruzleski [11]. They all reported three thermal arrests as the alloy solidified, which correspond to the major solidification reactions described in relation to
-70 -50 -30 -10 10 30 50 70 530 550 570 590 Temperature (610 630oC) D T A s ig n a l 500 520 540 560 580 600 0 5 CR (10oC/min) T e m p e ra tu re ( o C )
A-cooling, start A-cooling, peak A-heating, start A-heating, peak
1
3a 3b
Fig. 5. The degree of silicon modification has been related in the literature to the depression of the (Al)-Si eutectic temperature [12,13], and a value of 5.5 °C has been previously reported as the
minimum for efficient modification [2]. The evolution of ∆Td with the square root of the eutectic
cooling rate is shown in Fig. 7 which is indicated the domain where well-modified structures were observed. It is seen that the necessary depression is 7 °C, slightly higher than the value previously reported, and it corresponds to a eutectic cooling rate higher than 0.7 °C/s.
Conclusion
Thermal analysis showed that the (Al)-Si eutectic depression increases with the cooling rate as expected, though only values of cooling rate higher than 0.7 °C/s relate to satisfactory modification of A356 alloy in either sand or metallic moulds.
Acknowledgments
Financial support from the European Space Agency (contract #4200014347) through the MICAST program and from the DGHE- Education Ministry -Republic of Indonesia are greatly appreciated.
References
[1] G.K. Sigworth, Theoretical and practical aspects of the modification of Al-Si alloys, AFS Trans. 91(1983) 7-16.
[2] D. Apelian, G.K. Sigworth, K.R. Whaler, Assessment of grain refinement and modification of Al-Si foundry alloys by thermal analysis, AFS Trans. 92 (1984) 297-307.
[3] A. Lutts, Pre-precipitation of Al-Mg-Ge and Al-Mg-Si, Acta Metall. 9 (1961) 577-586.
[4] A. Niklas, U. Abaunza, A.I. Fernández-Calvo, J. Lacaze, R. Suárez, Thermal analysis as a microstructure prediction tool for A356 aluminium parts solidified under various cooling conditions, China Foundry 8 (2011) 89-95.
[5] P. Larrañaga, J.M. Gutiérrez, A. Loizaga, Thermolan-Al is a system under development that is based on the Thermolan system used for cast irons, AFS Trans. 116 (2008) 547-561.
[6] L.F. Mondolfo, Aluminum alloys, structure and properties, Butterworth, London, 1979.
[7] K. Song, H. Fufii, H. Nakae, H. Yamaura, A study on modification mechanism by Sr in Al-Si eutectic alloy, J. Jpn. Inst. Light Met. 43 (1993) 484-489.
[8] W.J. Boettinger, U.R. Kattner, On differential thermal analysis curves for the melting and freezing of alloys, Metall. Trans. A 33 (2002) 1779-1794.
[9] L. Bäkerud, G. Chai, J. Tamminen, Solidification characteristics of Aluminum alloys, Vol.2, AFS, Illinois, 1990.
[10] R.I. Mackay, J.E. Gruzleski, Quantification of Magnesium in 356 alloy via thermal analysis, Int. J. Cast Met. Res. 10 (1998) 255-265.
[11] B. Closset, J.E. Gruzleski, Mechanical Properties of A356.0 alloys modified with pure strontium, AFS Trans. 90 (1982) 453-464.
[12] S. Gowri, Comparison of thermal analysis parameter of 356 and 359 alloys, AFS Trans. 29 (1994) 503-508.
[13] H. Jiang, J.H. Sokolowski, M.B. Djurdjevic, W.J. Evans, Recent advances in automated evaluation and on-line prediction of Al-Si eutectic modification level, AFS Trans. 23 (2000) 505-510.