Path coefficient analysis of body weight and body measurements in Red Sokoto goats
(Caprahircus l.) of Niger State, Nigeria
Egena, S.S.A*., Tsado, D.N., Kolo, P., Banjo, A. A. and Shehu-Adisa, M.
Department of Animal Production, Federal University of Technology, P.M.B 65, Minna, Niger State, Nigeria. ( * ) email: [email protected]
ABSTRACT
Indigenous Red Sokoto goats raised under extensive system of management were used to evaluate the relationship between body weight (BW), head length (HL), head width (HW), height at withers (HAW), chest depth (CD), chest girth (CG), shin circumference (SC) and body length (BL). The objective of the study was to assess variability among body weight and its related characters using path coefficient analysis. Pair wise correlation between body weight and linear body measurements were positive and mostly significant (r= 0.053 - 0.826 in males; -0.020 - 0.667 in females and 0.072 – 0.690 in the combined population; P<0.05, 0.01). Path analysis showed that chest depth, shin circumference and body length made the greatest direct effect on body weight in male, female and the combined population (path coefficient = 0.360, 0.341 and 0.322, respectively) while the least direct effect was observed for height at withers, chest depth and height at withers in the male, female and the combined population (path coefficient = 0.019, 0.104 and -0.001 respectively). The optimum linear regression model with a coefficient of determination (R2) value of 0.684, 0.635 and 0.628 included forecast indices such as chest depth and body length in the male, head length, height at withers, chest depth, chest girth, shin circumference and body length in the female and head length, head width, chest girth, shin circumference and body length in the combined population. The optimum regression equations could be used in predicting body weight of indigenous goats in the field and for selection purposes.
1. Introduction
Body weight is a key economic trait in farm animals and a major determinant of profitability in any livestock venture. Body weight is the culmination of the various body parts of the animal. Therefore, a positive correlation between the various body parts and body weight is desirable. High correlation coefficients have been reported between body weight and chest girth (Bello and Adama, 2012; Slippers et al., 2000; Thys and Hardouin, 1991). The relationships between body weight and various length and height measurements have also been accessed in cattle and goat (Abdelhadi and Babiker, 2009; Adeyinka and Mohammed, 2006; Fajemilehin and Salako, 2008; Goe et al., 2001; Mekonnen and Biyuk, 2004; Mohammed and Amin, 1997). It is important to know the body weight of goats as it helps the farmer in making management decisions related to feeding, health, culling and selection for genetic improvement. Apart from the use of scales, the most often used method of ascertaining the body weight of animals is by visual analyses which in most cases return inaccurate estimates. Such inaccuracies could be surmounted through the development of simple but accurate methods of prediction. Multivariate analyses have been used to effectively reflect the underlying relationship between body weight and body measurements (Yaprak et al.,2008). One of the multivariate analyses used in evaluating this relationship is path coefficient (Okpeku et al.,2011; Yakubu, 2010). Path coefficient analysis is a technique used in determining the direct influence exerted by one variable on another; and is also used to separate the correlation coefficient into direct effect (path coefficient) and indirect effects
ARTICLE INFO Reçu : 19 – 03 - 2014 Accepté : 30 - 06 - 2014 Key words: Path coefficient analysis,Red Sokoto goat,body weight, linear body measurements, indigenous goats, regression, correlation.
Revue semestrielle – Université Ferhat Abbas Sétif 1
REVUE AGRICULTURE
Revue home page: http.www: http://revue-agro.univ-setif.dz/
UFAS - SETIF
5 (effects exerted through other independent variables) (Azeez and Morakinyo, 2011). The objective of the study was to evaluate the relationship between body weight and body measurements in indigenous goats in a sub-humid savannah area of Nigeria using path coefficient analysis.
2.Materials and Methods
2.1 Experimental animals and their management
Three hundred and seventy five indigenous goats of both sexes (113 males and 262 females) were randomly selected in certain smallholders’ farms in villages located within the three administrative zones of Niger State in the North Central part of Nigeria. The animals were extensively managed. Hence they scavenged on kitchen wastes, straw and crop residues when available. Records keeping and health care for the animals was almost zero.
2.2 Traits measured
The traits measured include body weight and morpho-biometrical characters. Measurements were taken on the goats in the morning before they were released for grazing. The body parts measured were head length (HL), measured as the distance from the nostril to the point of attachment of the horns; head width (HW), distance between the outer canthus of the right and left eye; height at withers (HAW), measured as the distance from point of withers to toe region; chest depth (CD), measured as distance between the withers and chest floor; chest girth (CG), measured as the body circumference just behind the forelegs and shin circumference (SC), measured as the canon bone perimeter and body length (BL), measured as the distance from the nostril to the pin bone. Body weight (BW) was measured with a hanging scale (kg). The height and circumference measurements (cm) were done using a tape rule while the width measurement was done using a calibrated wooden calliper. The measurements were carried out by the same person in order to avoid between individual variations.
2.3 Statistical analysis
Means, standard deviation and coefficients of variation of the body weight and body measurements of goats adjusted for sex effects were computed using Microsoft Excel 2007 version. The initial values of the parameters measured were transformed to generate the standardized version from the unstandardized variables using the means and standard deviations as described by Akintunde (2012). The standardized data was then subjected to regression and bivariate correlation analysis using SPSS (2001). The standardized partial regression coefficients called direct path coefficients were calculated thus:
σX1/σY= ‘P1’, the path coefficient from X1 to Y. σX2/σY= ‘P2’, the path coefficient from X2 to Y. σX3/σY= ‘P3’, the path coefficient from X3 to Y. σX4/σY= ‘P4’, the path coefficient from X4 to Y. σX5/σY= ‘P5’, the path coefficient from X5 to Y. σX6/σY= ‘P6’, the path coefficient from X6 to Y. σX7/σY= ‘P7’, the path coefficient from X7 to Y.
Where Y is the effect and X1, X2, X3, X4, X5, X6 and X7 are the causes. The indirect contributions of X1, X2, X3, X4, X5, X6 and X7 to Y were worked as follows:
Y1 = P1 + P2RX1X2 + P3RX1X3 + P4RX1X4 + P5RX1X5 + P6X1X6 + P7RX1X7 Y2 = P1RX1X2 + P2 + P3RX2X3 + P4RX2X4 + P5RX2X5 + P6X2X6 + P7RX2X7 Y3 = P1RX1X3 + P2RX2X3 + P3 + P4RX3X4 + P5RX3X5 + P6X3X6 + P7RX3X7 Y4 = P1RX1X4 + P2RX2X4 + P3RX3X4 + P4 + P5RX4X5 + P6X4X6 + P7RX4X7 Y5 = P1RX1X5 + P2RX2X5 + P3RX3X5 + P4RX4X5 + P5 + P6X5X6 + P7RX5X7 Y6 = P1X1X6 + P2RX2X6 + P3RX3X6 + P4RX4X6 + P5RX5X6 + P6 + P7RX6X7 Y7 = P1RX1X7 + P2RX2X7 + P3RX3X7 + P4RX4X7 + P5RX5X7 + P6X6X7 + P7
Where R = correlation coefficient between the variables. The equations illustrate the splitting process for a 7 factor variables with one effect variable Y. The multiple linear regression model adopted for the studies was: Y = a + b1X1 +b2X2 + b3X3 + --- + bpXp
Where Y = dependent or endogenous variable (body weight), a = intercept, b = regression coefficients and X = independent or exogenous variables (HL, HW, HAW, CD, CG, SC, BL).
3. Results
3.1 Morphometric traits
The results of the descriptive statistics of body weight and body measurement traits of indigenous goats as affected by extensive management are presented in Table 1. Sexual dimorphism was significantly (P<0.05) in favour of male goats for all the traits except HL and CG where the female goats had better (P<0.05) values. Apart from HL and CG, the trend of result is male goats followed by combine goat population and female goats. Height at withers varied more in the male followed by BW and CD. In the female, BW varied more than the other parameters. This was followed by CD and SC. In the combined population sampled (male and female), HAW was observed to have the highest variation followed by BW and CD. The least variation for male, female and the combined population was observed for BL.
Table 1: Descriptive statistics for all traits in male and female indigenous goats
Male (N=113) Female (N=262) Total (N=375)
Parameter Mean SD CV Mean SD CV Mean SD CV
BW (kg) 22.09a 6.38 28.86 21.85c 4.66 21.31 21.93b 5.23 23.84 HL (cm) 16.97c 1.93 11.34 17.10a 1.48 8.63 17.06b 1.62 9.51 HW (cm) 13.25a 1.67 12.62 13.02c 1.10 8.43 13.09b 1.30 9.93 HAW (cm) 57.38a 38.17 66.52 50.68c 3.92 7.73 52.70b 21.36 40.54 CD (cm) 20.31a 4.62 22.72 18.67c 2.95 15.79 19.16b 3.61 18.82 CG (cm) 59.85c 6.21 10.37 60.63a 6.74 11.11 60.40b 6.58 10.90 SC (cm) 8.18a 1.41 17.19 7.57c 1.04 13.68 7.75b 1.19 15.37 BL (cm) 104.00a 7.89 7.59 101.62c 6.25 6.15 102.33b 6.86 6.71 a,b,c: Means within the same row with different superscripts differ (P<0.05) significantly; BW= body weight; HL= head length; HW= head width; HAW= height at withers; CD= chest depth; CG= chest girth; SC= shin circumference; BL= body length; SD= standard deviation; CV= coefficient of variation.
3.2 Pair-wise correlation
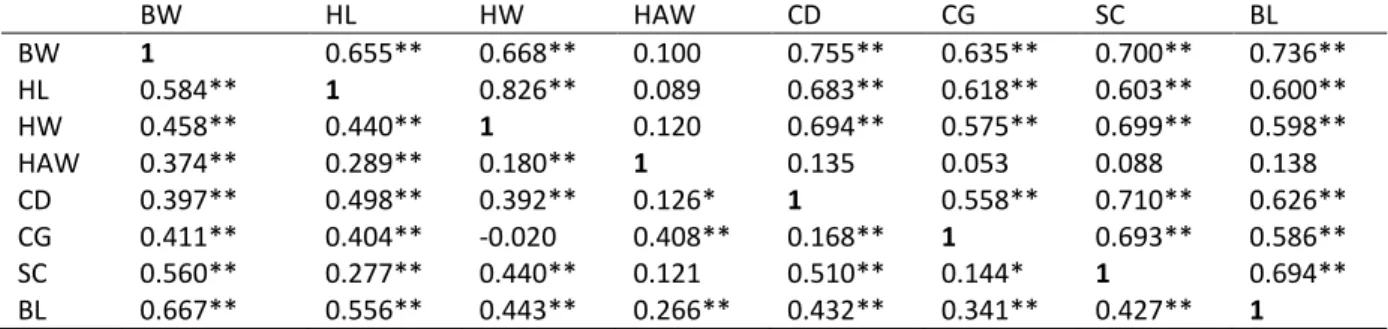
The coefficient of correlation between body weight and body measurements of indigenous goats under extensive management are presented in Tables 2a and 2b. Correlation between body weight and body measurements were all positive and highly significant (P<0.01) except for correlation between BW and HAW in males which was not significant (P>0.05). Correlation between body weight and the body measurements was strongest between body weight and chest depth in the male (r = 0.755; P<0.01), followed by BW and BL (r = 0.736; P<0.01) and least between BW and HAW (r = 0.100; P>0.05). In females, the best correlation was observed between BW and BL (r = 0.667; P<0.01), followed by BW and HL (r = 0.584; P<0.01) while the least was between BW and HAW (r = 0.374; P<0.01). In the combined population, the best correlation was observed between BW and BL (r = 0.690; P<0.01), followed by BW and HL (r = 0.614; P<0.01) while the least was between BW and HAW (r = 0.111; P<0.05) respectively.
Table 2a: Correlation coefficient between body weight and body measurements (male top of diagonal and female below the diagonal) of indigenous goats
BW HL HW HAW CD CG SC BL BW 1 0.655** 0.668** 0.100 0.755** 0.635** 0.700** 0.736** HL 0.584** 1 0.826** 0.089 0.683** 0.618** 0.603** 0.600** HW 0.458** 0.440** 1 0.120 0.694** 0.575** 0.699** 0.598** HAW 0.374** 0.289** 0.180** 1 0.135 0.053 0.088 0.138 CD 0.397** 0.498** 0.392** 0.126* 1 0.558** 0.710** 0.626** CG 0.411** 0.404** -0.020 0.408** 0.168** 1 0.693** 0.586** SC 0.560** 0.277** 0.440** 0.121 0.510** 0.144* 1 0.694** BL 0.667** 0.556** 0.443** 0.266** 0.432** 0.341** 0.427** 1
BW= body weight; HL= head length; HW= head width; HAW= height at withers; CD= chest depth; CG= chest girth; SC= shin circumference; BL= body length; SD= standard deviation; CV= coefficient of variation;
7 Table 2b: Correlation coefficient between body weight and body measurements of indigenous goats (combined population) BW HL HW HAW CD CG SC BL BW 1 HL 0.614** 1 HW 0.556** 0.610** 1 HAW 0.111* 0.085 0.113* 1 CD 0.559** 0.561** 0.548** 0.136** 1 CG 0.479** 0.472** 0.193** 0.072 0.288** 1 SC 0.609** 0.397** 0.562** 0.103* 0.623** 0.309** 1 BL 0.690** 0.561** 0.515** 0.139** 0.533** 0.403** 0.555** 1
BW= body weight; HL= head length; HW= head width; HAW= height at withers; CD= chest depth; CG= chest girth; SC= shin circumference; BL= body length; SD= standard deviation; CV= coefficient of variation;
** (p<0.01), * (p<0.05).
3.3 Direct and indirect effects
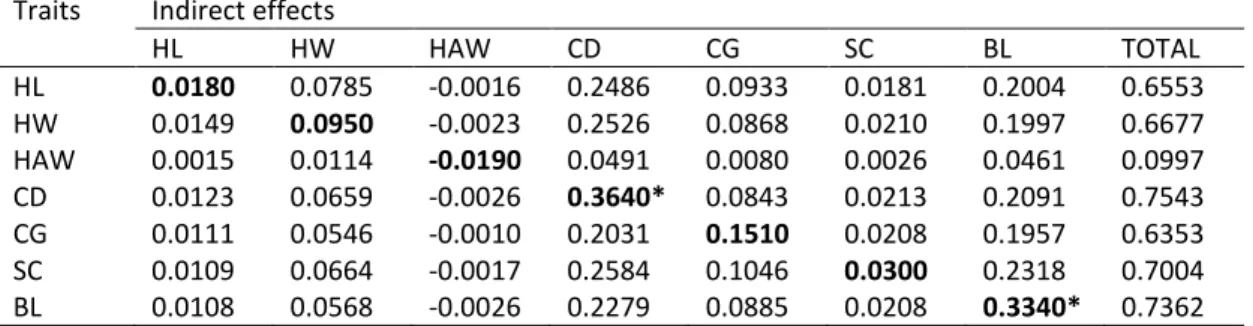
Direct effect (path coefficient) of HW, CD, CG and BL in male goats was statistically significant (P<0.05) while those of HL, HAW and SC were not significant (Table 3a). Chest depth made the greatest direct effect on body weight of male goats, followed by BL while the least direct effect was HAW. When combined, the indirect effects acting on body weight were observed to be higher than the direct effects mostly via BL.
Path coefficient or direct effect of CD on body weight in female goats was negative and insignificant (Table 3b). Shin circumference had the highest positive direct influence on body weight in females. This was followed by BL while CD had the least direct effect on BW. Path coefficient or direct effect of HAW on body weight in goats (combined population) was observed to be negative and insignificant (Table 3c). Body length had the highest positive direct influence on body weight in the combined population, followed by SC while the least direct effect was observed for HAW. As was observed in the male, indirect effects were through body length which had the highest values (female and combined population).
Table 3a: Direct and indirect effects of body measurements on body weight of indigenous male goats Traits Indirect effects
HL HW HAW CD CG SC BL TOTAL HL 0.0180 0.0785 -0.0016 0.2486 0.0933 0.0181 0.2004 0.6553 HW 0.0149 0.0950 -0.0023 0.2526 0.0868 0.0210 0.1997 0.6677 HAW 0.0015 0.0114 -0.0190 0.0491 0.0080 0.0026 0.0461 0.0997 CD 0.0123 0.0659 -0.0026 0.3640* 0.0843 0.0213 0.2091 0.7543 CG 0.0111 0.0546 -0.0010 0.2031 0.1510 0.0208 0.1957 0.6353 SC 0.0109 0.0664 -0.0017 0.2584 0.1046 0.0300 0.2318 0.7004 BL 0.0108 0.0568 -0.0026 0.2279 0.0885 0.0208 0.3340* 0.7362
Bold= direct effect; BW= body weight; HL= head length; HW= head width; HAW= height at withers;
CD= chest depth; CG= chest girth; SC= shin circumference; BL= body length; * (p<0.05).
Table 3b: Direct and indirect effects of body measurements on body weight of indigenous female goats Traits Indirect effects
HL HW HAW CD CG SC BL TOTAL HL 0.2400* 0.0365 0.0355 -0.0518 0.0517 0.0945 0.1768 0.5832 HW 0.1056 0.0830 0.0221 -0.0408 -0.0026 0.1500 0.1409 0.4582 HAW 0.0694 0.0149 0.1230* -0.0131 0.0522 0.0413 0.0846 0.3723 CD 0.1195 0.0325 0.0155 -0.1040* 0.0215 0.1739 0.1374 0.3963 CG 0.097 -0.0017 0.0502 -0.0175 0.1280* 0.0491 0.1084 0.4135 SC 0.0665 0.0365 0.0149 -0.0530 0.0184 0.3410* 0.1358 0.5601 BL 0.1334 0.0368 0.0327 -0.0449 0.0436 0.1456 0.3180* 0.6652
Bold= direct effect; BW= body weight; HL= head length; HW= head width; HAW= height at withers;
Table 3c: Direct and indirect effects of body measurements on body weight of indigenous goats (combined population)
Traits Indirect effects
HL HW HAW CD CG SC BL TOTAL HL 0.1820* 0.0586 -0.00009 0.0241 0.0779 0.0901 0.1806 0.6132 HW 0.1110 0.0960* -0.0001 0.0236 0.0327 0.1276 0.1658 0.5566 HAW 0.0155 0.0108 -0.0010 0.0058 0.0119 0.0234 0.0448 0.1112 CD 0.1021 0.0526 -0.0001 0.0430 0.0475 0.1414 0.1716 0.5581 CG 0.0859 0.0190 -0..00007 0.0124 0.1650* 0.0701 0.1298 0.4821 SC 0.0723 0.0540 -0.0001 0.0268 0.0510 0.2270* 0.1787 0.6097 BL 0.1021 0.0494 -0.0001 0.0229 0.0665 0.1260 0.3220* 0.6888
Bold= direct effect; BW= body weight; HL= head length; HW= head width; HAW= height at withers;
CD= chest depth; CG= chest girth; SC= shin circumference; BL= body length; *(p<0.05).
3.4 Percentage contribution of parameters
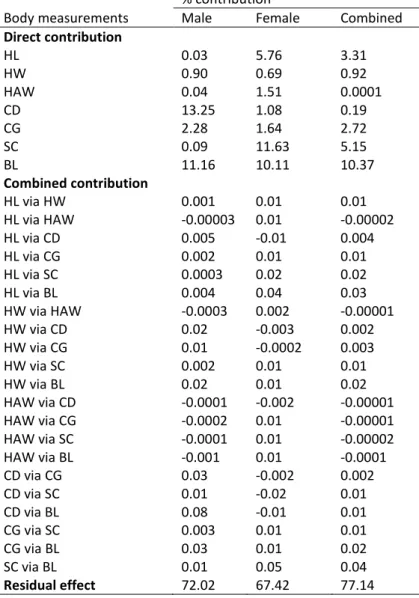
Body length in males made the utmost direct percent contribution to BW followed by BL while HL made the least percent contribution to BW (Table 4). In the female, SC made the greatest direct contribution to BW. This was followed by BL while CD made the least direct contribution. In the combined population, BL made the highest percent contribution to body weight, followed by SC while CD made the least contribution. The best combined percent contributions were made by CD via BL (in males), SC via BL (in females) and, SC via BL (in the combined population).
Table 4: Percent contribution of different body measurement attributes of indigenous goats to body weight (kg)
% contribution
Body measurements Male Female Combined
Direct contribution HL 0.03 5.76 3.31 HW 0.90 0.69 0.92 HAW 0.04 1.51 0.0001 CD 13.25 1.08 0.19 CG 2.28 1.64 2.72 SC 0.09 11.63 5.15 BL 11.16 10.11 10.37 Combined contribution HL via HW 0.001 0.01 0.01 HL via HAW -0.00003 0.01 -0.00002 HL via CD 0.005 -0.01 0.004 HL via CG 0.002 0.01 0.01 HL via SC 0.0003 0.02 0.02 HL via BL 0.004 0.04 0.03 HW via HAW -0.0003 0.002 -0.00001 HW via CD 0.02 -0.003 0.002 HW via CG 0.01 -0.0002 0.003 HW via SC 0.002 0.01 0.01 HW via BL 0.02 0.01 0.02 HAW via CD -0.0001 -0.002 -0.00001 HAW via CG -0.0002 0.01 -0.00001 HAW via SC -0.0001 0.01 -0.00002 HAW via BL -0.001 0.01 -0.0001 CD via CG 0.03 -0.002 0.002 CD via SC 0.01 -0.02 0.01 CD via BL 0.08 -0.01 0.01 CG via SC 0.003 0.01 0.01 CG via BL 0.03 0.01 0.02 SC via BL 0.01 0.05 0.04 Residual effect 72.02 67.42 77.14
9
Total 100.00 100.00 100.00
BW= body weight; HL= head length; HW= head width; HAW= height at withers; CD= chest depth; CG= chest girth; SC= shin circumference; BL= body length.
3.5 Establishment of preliminary and optimized regression equations
The following equations with their coefficients of determination (R2) were obtained from simple regression between body weight and the body measurements:
Y = 0.018HL + 0.095HW – 0.019HAW + 0.364CD + 0.151CG + 0.030SC + 0.334BL ………i (male goat; R2 = 0.711). Y = -0.001 + 0.240HL + 0.083HW + 0.123HAW - 0.104CD + 0.128CG + 0.341SC + 0.318BL ………ii (female goat; R2 = 0.639).
Y = -0.001 + 0.182HL + 0.096HW – 0.001HAW + 0.043CD + 0.165CG + 0.227SC + 0.322BL ………iii (combined population; R2 = 0.629).
In other to optimize the models, redundant (non-significant) variables were removed from the regression equations to obtain simplified equations with their coefficient of determination (R2). The simplified equations are:
Y = 0.483CD + 0.433BL …… i (male goat; R2 = 0.684).
Y = 0.000 + 0.267HL + 0.134HAW - 0.101CD + 0.101CG + 0.363SC + 0.336BL ………ii (female goat; R2 = 0.635).
Y = -0.001 + 0.195HL + 0.1HW + 0.164CG + 0.244SC + 0.327BL …….iii (combined population; R2 = 0.628).
4. Discussion
The high variation observed for HAW (male), BW (female) and HAW (combined) (Table 1) suggests that these traits could be selected for subsequent genetic improvement. The higher values observed for male goats compared to the females might be due to the effect of sex. Farmers and consumers prefer their goats to be heavy partly due to economic benefits. This is because farmers will earn more money from the sales of heavy goats while consumers believe heavy goats will be meatier. The high variability in these traits might not be unconnected with environmental effects acting on the animal. The body weight observed in this study for indigenous goats is similar to that reported by Yakubu (2011).
The positive nature of the pair wise correlation observed in the study (Table 2a, 2b and 2c) means that body weight could be estimated from body measurements to a large extent in conditions or situations where weighing scales are not readily available like in agrarian areas. Similar high correlation coefficients between body weight and body measurements have been reported in goats (Ogah et al.,2009; Okpeku et al.,2011; Thiruvenkadan, 2005; Yakubu, 2011).
The direct effects of HL, HW, HAW, CG and SC in male goat body weight were insignificant (Table 3a). However, the total values of indirect effects of these measurements were larger than their respective direct effects. These large indirect effects were realized through CD. This is an indication that the high and significant correlations observed between HL, HW, CG and SC was largely due to the indirect effect of CD. The direct effects of CD and BL were however significant. It could be inferred that CD and BL are valuable traits useful in the estimation of BW in male indigenous goats.
The direct effect of HW in female goat was not significant (P>0.05) while its total indirect effect was high (Table 3b). The large indirect effect of HW was realized via SC. Body weight could therefore be estimated using HL, HAW, CD, CG, SC and BL. In the combined population, the direct effects of HAW and CD were not significant, although their indirect effects were large (Table 3b). The large indirect effects in the combined population were both realized through BL, the implication being that the significant correlation between HAW, CD and BW was largely due to the indirect effect of BL. Therefore, BW could be estimated in the combined population, from HL, HW, CG, SC and BL. Indirect effects of independent variables play important roles on the dependent variable (Ulukanet al.,2003). Keskin et al.(2005) and Yakubu (2011) reported that path analysis provides a more comprehensive determination of the causal factors of an event or occurrence, and in the process provides information which could be useful for selection during animal improvement programmes. This is because correlation alone does not provide the exact knowledge of the contribution made by a growth attribute to the overall body weight of an animal. This is evident in this study because correlation between BW and HAW (male, female and the combined population) were all positive albeit the lowest. On the basis of the positive nature alone, one would have opined that the trait made great and positive contribution to the overall BW of goats. In this study, path analysis has made it clear that its contribution might not be directly (especially in male and the combined population of sheep), but it might be indirectly by combination with other body traits.
The individual or combined percent contributions means that BL (male and the combined population), SC, CD via BL (male) and SC via BL (female and the combined population), made the greatest contributions to the body weight of indigenous goats raised under extensive management system (Table 4). This might be because body weight and its component traits are polygenic and strongly influenced by environmental factors. It is possible that there are some factors yet to be established, but which have a great influence on the BW of the indigenous goats. This possibly explains the high residual effect observed in the study. The high residual effect might also be an indication that there are some key traits not included in the study but whose roles might have had key effects on the body weight of goats.
The direct effects of HL, HW, HAW, CG and SC (in males), HW (in females) and, HAW and CD (in the combined population) were not significant and hence were removed from the equations. The removal of the redundant variables led to changes in the R2 value of equations i, ii and iii respectively. The optimized equations gave the best results. This is because they include only those aspects of the body measurements likely to make significant input to the overall BW of the indigenous goats. The removal of redundant variables in order to obtain optimized equations for predictive purposes in regression models has been reported by Malau-Aduli et al.(2004) and Yakubu and Mohammed (2012). Reports by Sebolai et al.(2011), Sowande et al.(2010) and Yakubu and Mohammed (2012) showed that body measurements could be used as veritable tools for predicting the BW of goats. Due to the positive and significant correlations observed between the body measurements and BW, they could also be used as yardstick for making management decision as to which animals should be selected for subsequent improvement, and which should be culled.
5. Conclusion
Phenotypic correlation showed that body weight correlated positively and significantly with all the traits studied except height at withers in males. The result of path analysis revealed that chest depth and body length contributed directly to body weight in male and female goats. Also, the indirect effect of other traits on body weight was via body length. Body weight of indigenous goats in Niger state, Nigeria could be estimated with a great degree of accuracy using body measurements such as head width, chest depth, chest girth, shin circumference and body length because they showed significant direct effects. Selecting these traits most likely will impact positively on body weight of goats, and enhance the profitability to goat enterprises.
References
Abdelhadi, O.M.A. and Babiker, S.A. (2009) Prediction of Zebu cattle live weight using live animal measurements. Livest. Res. Rural Development 21. http://www.lrrd.org/lrrd21/8/abde21133.htm
Adeyinka, I.A. and Mohammed, I.D. (2006) Relationship of live weight and linear body measurements in two breeds of goats of Northern Nigeria. J. Anim. Vet. Adv., 5(11): 891-893.
Akintunde, A.S. (2012) Path analysis step by step using Excel. J. Tech. Sci. Techno., 1(1): 9-15.
Azeez, M.A. and Morakinyo, J.A. (2011) Path analysis of the relationships between single plant seed yield and some morphological traits in sesame (Genera Sesamum and Ceratotheca). Int. J. Plan. Breed. Genet., 5: 358-368.
Bello, A.A. and Adama, T.Z. (2012) Study on body weight and linear body measurements of castrates and non-castrate savannah brown goats. Asian J. Anim. Sci.,6(3): 140-146.
Fajemilehin, O.K.S. and Salako, A.E. (2008) Body measurement characteristics of the West African Dwarf (WAD) goat in deciduous forest zone of Southwestern Nigeria. Afri. J. Biotechno., 7: 2521-2526.
Goe, M.R., Aldridge, J.R. and Light, D. (2001). Use of heart girth to predict body weight of working oxen in the Ethiopian highlands. Livest. Prod. Sci.,69: 187-195.
Keskin, A., Kor, A., Karaca, S. and Mirtagioglu, H. (2005) A study of relationships between milk yield and some udder traits by using of path analysis in Akkeci goats. J. Anim. Vet. Adv., 4: 547-550.
Malau-Aduli, A.E.O., Aziz, M.A., Kojina, T., Niibayashi, T., Oshima, K. and Komatsu, M. (2004) Fixing collinearity instability using principal components and ridge regression analyses in the relationship between body measurements and body weight in Japanese Black cattle. J. Anim. Vet. Adv.,3: 856-863.
Mekonnen, H.M. and Biyuk, T. (2004) Heart girth-body weight relationship in two Ethiopian Zebu breeds. Rev. Med. Vet.,105: 512-515.
Mohammed, I.D. and Amin, J.D. (1997) Estimating body weight from morphometric measurements of Sahel (Borno White) goats. Small Rum. Res.,24: 1-5.
Okpeku, M., Yakubu, A., Peters, S.O., Ozoje, M.O., Ikeobi, C.O.N., Adebambo, O.A. and Imumorin, I.G. (2011) Application of multivariate principal component analysis to morphological characterization of indigenous goats in Southern Nigeria. Acta Agricult. Slov., 98(2): 101-109.
11 Ogah, M.D., Hassan, I.D. and Musa, I.S. (2009) Path analysis of the relationship between various body measurement and live weight in immature West African Dwarf goats. Ann. IBNA 25: 72-77.
Sebolai, B., Nsoso, S.J., Podisi, B. and Mokhutshwane, B.S. (2011) The estimation of live weight based on linear traits in indigenous Tswana goats at various ages in Botswana. Trop. Anim. Healt. Prod.,44(4): 899-904.
Slippers, S.C., Letty, B.A. and De Velliers, J.F. (2000) Prediction of the body weight of Nguni goats. S. Afri. J. Anim. Sci.,30(1): 127-128.
SPSS (2001) Statistical Package for Social Sciences. SPSS Inc., 444 Michigan Avenue, Chicago IL60611.
Sowande, O., Oyewale, B. and Iyasere, O. (2010) Age- and se-dependent regression models for predicting the live weight of West African Dwarf goat from body measurements. Trop. Anim. Healt. Prod.,42: 969-975. Thiruvenkadan, A.K. (2005) Determination of best-fitted regression model for estimation of body weight in Kanni Adu kids under farmer’s management system. Livest. Res. Rur. Dev.17. www.cipav.org.co/lrrd/lrrd17/7/thir17085.htm
Thys, E. and Hardouin, J. (1991) Prediction of sheep body weight in markets in the far north Cameroon. Livest. Res. Rur. Dev. 3(1). http://www.lrrd.org/lrrd3/1/hardouin.htm
Ulukan. H., Guler, M. and Keskin S. (2003) A path coefficient analysis of some yield and yield components in Faba Bean (Vicia faba L.) genotypes. Pak. J. Biolo. Sci., 6: 1951-1955.
Yaprak M., Koycegiz, F., Kutlua, M., Emsen, E. and Ockerman, H.W. (2008) Canonical correlation analysis of body measurements, growth performance and carcass traits of red Karaman Lamb. J. Anim. Vet. Adv., 7(2): 130-136.
Yakubu, A. (2010) Path coefficient and path analysis of body weight and biometric traits in Yankasa lambs. Slov. J. Anim. Sci.,43: 17-25.
Yakubu, A. (2011) Path analysis of conformation traits and milk yield of Bunaji cows in smallholder’s herds in Nigeria. Agricult. Trop. Subtrop., 44:152-157.
Yakubu, A. and Mohammed, G.L. (2012) Application of path analysis methodology in assessing the relationship between body weight and biometric traits of Red Sokoto goats in northern Nigeria. Biotechno. Anim. Husband.,28: 107-117.