ISMRE2018/XXXX-2018 ALGERIA
Industrials Pollutants Photocatalytic Process by
Hybrid by Fe Innovant Natural Material Rich in
Silica With Thermal Calcination
REZIG Walid
1*, HADJEL Mohammed
21* Laboratoire des Sciences, Technologie d’Oran et Génie des Procédés LSTGP ; Département de Génie Chimique ; Faculté de Chimie ; Université des Sciences et de la Technologie d’Oran Mohamed Boudiaf USTO-MB, BP 1505 El M’naoueur Bir
El Djir 31000 Oran , Algérie.
2Laboratoire des Sciences, Technologie d’Oran et Génie des Procédés LSTGP ; Département de Génie Chimique ; Faculté de Chimie ; Université des Sciences et de la Technologie d’Oran Mohamed Boudiaf USTO-MB, BP 1505 El M’naoueur Bir
El Djir 31000 Oran , Algérie.
: walidrzg@gmail.com / walid.rezig@univ-usto.dz
Abstract—Ferrihydrite silicide is widely used to realize contact
terminals of integrated circuits and is usually formed by ex-situ heating treatments in-situ reactions during sputter deposition of a ferrihydrite with SiO2 of diatomite have been investigated
in this work, by means of x-ray diffraction , x-ray fluorescence , infrared spectroscopy, , scanning electron microscopy. Diatomite which will be modified by iron “ the deposit of ferrihydrite on raw diatomite by FeCl2, and NaOH.
Comparison of XRD results proves that raw diatomite has an irregular structure but it becomes more regular at ferrihydrite modified to obtain ferric oxides differents phases from cristallinities are: ferrihydrite , maghemite, magnetite, akaganeite,hematite, goethite, and schwertmannite. Kinetics photodegradation ( photocatalytic degradation) depend a pH solution Vat Green 03 textile dye. It is more important with low pH (pH= 4).Ferrihydrite modified diatomite ( DMF1) offer a great potentials for dyes eliminations and their wastewaters.
Keywords—Ferrihydrite, silicide, diatomite, ferric oxides, dye.
I. INTRODUCTION
The principal phases of ferric oxide in kind are, in rule of crystallinity,ferrihydrite,maghemite, lepidocrocite,hematite, and goethite increasing [5]. The least of crystalline ferrihydrite is a brown ferric oxide with a big surface [6]. The ferrihydrite is also known like momentary ferric oxide phase [7] .The pure ferrihydrite transforms into more crystalline ferric oxides with time [7]. The ferrihydrite modified diatomite ( DMF) was produced the partial dissolution of diatomite by the solution of 6M NaOH followed by the hydrolysis and oxidized of the 1M solution of FeCl2.4H2O [8].The inferior content of Si could have like the consequence of more crystalline ferric oxides because the ferrihydrite transformed. The Objective of our work is to simplify the mode of water treatment of effluents in sight :
•To improve the results found by coagulation-flocculation used by the Algerian companies of the textiles;
•To apply a new method which is it proceeds by the process of advanced oxidation;
•And finally to preserve the environment of the harmful effects of the dyes remaining in the effluents like in untreated muds. Currently, the photocatalysis is always based by the dioxide of titanium ( TiO2 ) for the experimental
application. The dioxide of titanium has a big space of band : 3.0 eV for rutile and 3.2 eV for anatase and thus only the small fraction ( 5 %) of a solar light can be used for its photoexcitation .Consequently, of the efforts of considerate were devoted the modified of TiO2 in order to prolong the
band-edge of absorption the TiO2 in the obvious light
irradiation [1 ,2].Among them ,Fe doped with TiO2 was
intensively studied the ions of Fe could be built in dioxide of titanium by the substitution of Ti4+ ,presenting a new force in the space of band of TiO2 which is responsible for the
photoactivity of visible light [ 1,3,4],
II. MATERIALS AND METHODS
Before studying the photodegradation of the dyes by the diatomite, we considered to be useful to modify our material in order to improve its properties. The details of DMF prepared were previously reported and are recapitulated here [8].The diatomite used in this study comes from the area of Sig (50 Km of the town of Oran) in Algeria. It is presented in the form of a powder of white color. The Geographical location of layer off diatomite (Kieselguhr) the area of Sig is shown in Fig.1.After crushing and sifting the size of the particles of the fraction lies between 0.4-0.6 mm.This material is of great interest and has several uses such us: purification of drinking water, absorbent of the pesticides, manufacture of antibiotics, some pharmaceutical syrups and it is qualified like friendly material with to respect the environment [9].The choice of this material was indicated to us by the fact that :
It is very abundant; it has an adsorptive affinity towards the organic heavy metals. [10, 11] and molecules [12, 13].The chemical composition of raw diatomite DB studied was determined by x-ray fluorescence X ( XRF) ( Philips PW
1404 ) and by electronic Micro sounder based on chemical analysis by x-ray fluorescence x ( XRF) ( Philips PW 1404 ).Raw diatomite DB is composed of 68.017 % SiO2 , 19.25
% CaCO3 , 7.575 % Al2O3 ; 2.022 % Fe2O3 ;1.241 % MgO ;
1.491 % K2O; 0.2 % Na2O ; 0.14 % TiO2 ; 0.038 %
MnO.DB samples ( 45 g) were immersed in 300 ml 6M NaOH solution at 90 °C for 2 h to partially dissolve Si [14] .The mixture was immediately added to 300 ml of FeCl2.4H2O solutions of differing concentrations ( 1,2,3
and 4 M) and stirred and oxidized in air at room temperature (25 °C) for 24 h. The mixture was centrifuged for 30 min with the speed of 12000 rotations/min for assured the separation.The solid obtained through centrifugation was washed with distilled water and oxidized in air at room temperature overnight.The mixture was centrifuged for 30 min with the speed of 15000 rotations /min for assured the separation to remove excess NaOH. The solid obtained through centrifugation was washed with distilled water and oxidized in air to continue the oxidation Fe(OH)2 and
remove the excess of NaOH for 24h. The mixture was dried at 105 °C for 24h .The products of this procedure were named DMF1as shown in Fig.1.A simplified synthetic cut was raised to facilitate the study of the layers
of the diatomite and the sediments associated in the diatomite formation.
Fig.1. Ferrihydrite modified diatomite (DMF1 )
The Fig.1 is shown the products of modification the natural diatomite by ferrihydrite with concentration of FeCl2.4H2O (1M ).
III. RESULTSANDDISCUSSION
A. X-ray fluorscence (XRF)
The minaralogical analysis of the crude diatomite DB shows the predominance of the two oxides which are: silica (SiO2)
68.017 %; calcium oxide (CaO) 19.25%; and the presence of oxides of low mass percentages which are: Alumina (Al2O3) 7.57%; iron (III) oxide (Fe2O3) 2.022%; potassium
oxide (K2O) 1.491 %; magnesium oxide (MgO) 1.241%;
sodium oxide (Na2O) 0.2%; titanium dioxide (TiO2) 0.144
%, manganese oxide (MnO) 0.038 % ; and other 0.022% oxides.The mineralogical composition of ferrihydrite modified DMF4 diatomite studied was determined by quantified x-ray fluorescence in the form of oxides and is reported in Table 1.
Table 1. Mineralogical analysis in percentages by mass (% by weight) of iron-modified diatomite "DMF4"
B. X-ray diffraction analysis (XRD)
The mineralogy of (DMF1) was characterized by powder ray diffraction (XRD) analysis using a model PW 1729 x-ray diffraction unit (Philips, Eindhoven, Netherlands) Cu Kα radiation (λ = 0.1540598 nm, 50 kV, 100 mA). As shown in Fig.4.The powder sample was coated on a plate out of glass of methanol and was dried with the room temperature, then swept 1° with 80° (2ϴ) with the size of stage of 0.020°. For the raw diatomite DB
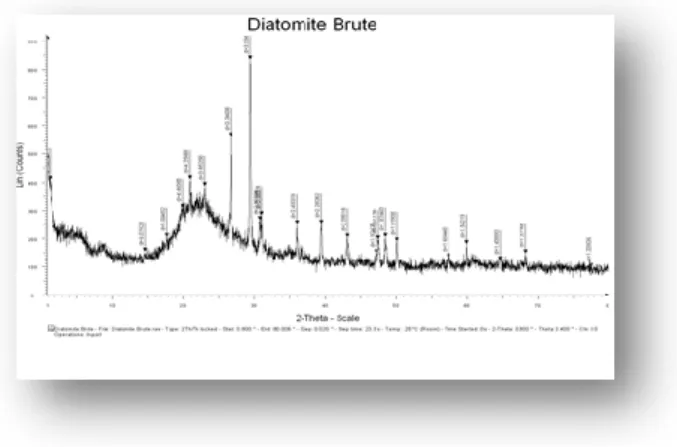
The Fig.2 represents The x-ray diffraction powder diffraction results of raw diatomite DB and Ferrihydrite modified diatomite ( DMF1,).The diffraction spectrogram indicates that the diatomite consists mainly of silica ( SiO
2)
and CaCO
3 with smaller amonts of Al2O3 ,Fe2O3, K2O
,MgO,Na
2O,TiO2 ,and MnO.The amorphous band,
represented the spectrum of raw diatomite DB shown in Fig.4 is probably due to the glass formation of SiO
2 as the
inorganic base accompanie d quartz, calcite[15]. For Quartz ( the peaks at 2 theta= 14.5°-17.5°-19.5°-21°-23°-26.5°-36°-39.5°) and calcite ( peaks of 2 theta = 29.5° to 47°-47.5°-48.5°-57.5°-60°-64.5°-68.5°-77.5° ) are the characteristic peaks of the raw diatomite [16,17]. Similar spectra were found in the characterization of a Moroccan diatomite [18]. In conclusion, the diatomite has a disorganized structure (amorphous) that reported by K.Seoglu and Others [19] (Fig.2).
For DMF1
For the Quartz ( SiO
2) : the peaks at 2 theta =
26.5°-45.5°-56.5°-66°-75° with the interreticulars distances ( d = 3.34-1.99-1.62-1.41-1.26 ) [20] ( Data of ASTM 5-490).For the Composants Fe2O3 Na2O SiO2 CaO Al2O3 MgO K2O TiO2 Others
calcite ( CaCO
3 ) : the peaks at 2 theta =
31.5°-45.5°-56.5°-66.75° with the interreticulars ( d= 2.82-1.99-1.69-1.62-1.41-1.26 ) [20]. (Data of ASTM 5-490).For the rutile ( TiO
2
): the peaks at 54° with the interreticular distance d=1.69 and the peak at 2 theta= 27.5° with the interreticular distance d= 3.25 [20] (Data of ASTM 5-551).For the illite: the peak at 2 theta= 45.5° with d= 1.99 [21] (Data of ASTM 9-343).For the Kaolinite: the peak at 2 theta =45.5° with d= 1.99 [21] (Data of ASTM 14-164).For the hematite: the peak at 2theta with d= 1.69 [20] (Data of ASTM 8-98) (Fig.3).
Fig. 2. X-ray diffraction patterns of DB
Fig.3. X-ray diffraction patterns of DMF1
C. Fourier Transform Infrared Spectroscopy (FTIR)
The FT-IR spectra of raw diatomite DB and DMF1 are realized with help of spectrophotometer using a model JASCO FT /IR-4200 ( Fourier Transform Infrared Spectrometer ) between 4000 cm -1 and 400 cm -1 with the resolution of 4 cm -1
. The samples are conditioned with the dispersion form in the pastille of KBr (1/200 in mass), For raw diatomite DB
The large adsorption band situated at 3399 cm
-1
and 1431.89 cm
-1
are linked with the vibrations of ( O-H )
surface and adsorbed water by the analysis of samples are proved the affinity of diatomite toward the water [22].The adsorption band at 1101.15 cm
-1
and 803.206 cm
-1
are represented the vibration of siloxane group (Si-O-Si ) [23].The absorption band at 1645.95 cm
-1
and 1101.15 cm
-1
are corresponded the vibrations of Si-O-Si [22].The adsorption band at 877.452 cm
-1
are corresponded the stained vibration of silanol group [24].The adsorption band at 803.206 cm
-1
are corresponded the vibration of ( Al-O-Si ) [25].Presence the characteristics bands of carbonates ions at ( 1431.89 cm -1 ;740.531 cm -1 ; 691.355 cm -1 ;877.452 cm -1 ; 577.576 cm -1
) [26].The three adsorption bands at (431.012 cm -1 ; 470.546 cm -1 ; and 1101.15 cm -1 ) are attributed the vibrations of Si-O-Si [24]. (Fig.4)
For DMF1
There is a new adsorption band at 3437.49 cm
-1
corresponds the vibration of the silanol group Si-O-H [27].The infrared spectrum of raw diatomite DB. There is the disappearances of adsorption bands at (2517.61 cm -1 ; 1874.47 cm -1 ; 1794.44 cm -1 ; 877.452 cm -1 ; 803.206 cm -1 ; 740.531 cm -1 ; and 577.576 cm -1
).There is a new adsorption band 2116.49 cm
-1
corresponds the vibration of Si-H [28].The adsorption band at 1639.2 cm
-1
corresponds the vibration of Fe( OH)
3
[29].The adsorption band at 1429.36 cm
-1
corresponds the vibrations of CaCO
3 and CaFe( CO3 )2 [30].The adsorption
band at 783.922 cm
-1
corresponds the vibration of FeOOH [31].The adsorption band at 678.82 cm
-1
corresponds the vibration of α-FeOOH (goethite) [30] and FeOOH [32] and γ-Fe
2O3 (maghemite) [31].The adsorption band at 591.075
cm
-1
corresponds the vibration of maghemite (γ-Fe
2O3 ) and
magnetite (Fe
3O4) [32].The adsorption band at 491.759 cm -1
corresponds the vibration of Schwertmannite [32]. The adsorption band at 430.048 cm
-1
corresponds the vibration of Si-O-Si [24], (Fig.5).
Fig.5. FT-IR spectra of DMF1
D. Scanning electron microscopy (SEM)
The morphologies of the mineral phases constituting the samples were investigated by scanning electron microscopy using a model ( JEOL JSM 6610 PLUS/ LA , Japan) scanning electron microscopy .The sample was first mounted flat,using carbon tape, and then coated with 30 nm of gold using a sputter coater, the working distance was set to 17 mm and then accelerating voltages of 20 kV were used.
For raw diatomite DB
The raw diatomite DB obtained from Sig (Westerland of Algeria) mainly consists of the centric diatom particles have a diameter of approximately 0,09-0,5 μm and the pennate diatom particles have a length of approximately 0.2-6 μm and a width approximately 2.5-3.5 μm , (Fig.6).
For DMF1
The centric of DMF1 particles have a diameter of approximately 3-6 μm,and the pennate DMF1 particles have a length of approximately 4-9 μm, (Fig.7).
Fig.6. Typical scanning electron micrograph for DB
Fig.7. Typical scanning electron micrograph for DMF1
E. Thermogravimetric Analysis ( TGA)
Thermogravimetric analysis consists in continuously monitoring the variation of the mass of a sample (raw diatomite of Sig DB) as a function of the temperature under air and a temperature range from 25 ° C to 700 ° C and a speed of heating of 10 ° C min-1 under air and air and under a pressure of 1 bar the gross diatomite thermogram results of Sig DB, this study is given in Fig.8.The observation of the thermogram of the raw diatomite of Sig, presents two distinct decomposition phases over the studied temperature range (25-700 ° C): A first loss of mass of 0.75% between 25 and 200 ° C, due to the departure of physisorbed water (dehydration) ; a second loss of mass of 2.5% between 200 and 700 ° C., resulting both from the decomposition of the organic phase present on the surface of the silica and optionally to the dehydroxylation of the silanol groups during the raising of temperature [33].
Fig.8. Thermogram of raw diatomite of Sig « DB» by
thermogravimetric ( TGA )
IV. PHOTOCATALYSIS ACTIVITY 0,75 %
The objective for this work is to optimize the operating conditions of the photodegradation of titanium dioxide (Degussa P25) and gross diatomite and modified by ferrihydrite.For this we varied the pH of 4, 7 and 10 and fixed the concentration of titanium dioxide TiO
2 is 0.1g/L, and the diatomaceous earth
(DB, DMF1) ,2.5g /L and thus release industry and textile dye (Vat Green 3), which is used as indicators of contamination at a concentration of 2 mg/L .The photocatalytic activity was determined based on the pH and the absorbance of samples after each 15 min ( see Fig.7, Fig.8 et Fig.10 et Fig.11).
Fig.8. Heterogeneous photocatalysis principle of semiconductor
Fig.9. Test of photodegradation ( Vat Green 03 textile dye ) of the mixtures (TiO
2 + DB ) and (TiO2 DMF1 ) in the
photocatalytic reactor ( transilluminator )
Fig.10. Effect of pH on the photodecolourisation on Vat Green 03 textile using the mixture of (DB +TiO
2) in
function the time of irradiation.
Fig.11. Effect of pH on the photodecolourisation on Vat Green 03 textile using the mixture of (DMF1 +TiO
2)
in function the time of irradiation.
V. CONCLUSION
The Comparison of the results from x-ray diffraction XRD show that the raw diatomite has an irregular structure at the modification of ferrihydrite.The photocataytic degradation kinetic depends on the pH of the solution of Vat Green 03, it is more important at low pH (pH = 4). All these results show that The use of raw diatomite DB and ferrihydrite modified diatomite (DMF1) offer great potential for the removal of dyes.The derived photocatalysts were predominantly of anatase phase with mesoporous structure,exhibited large specific surface areas,Si-O-Fe and Ti-O-Fe linkages were evidenced in the ferrihydrite-modified diatomite doped with TiO
2 photocatalysts.The
presence of Fe in ferrihydrite-modified diatomite ( DMF1,) coulds favor the formation of surface hydroxyl groups.The natural abundance of these materials low investment costs
could provide a good alternative to more costly adsorbents such as activated carbon, Zeolite, alginate ...Finally, this study was designed as a major source of information processed by ferrihydrite modified diatomite.
REFERENCES
[1] H.Yamashita,M.Harada,J.Misaka,M.Takeuchi,K.Ikeuchi,M.Anpo,J.P hotochem.Photobio.a148 (2002)257-261.
[2] A.Zaleska “Doped-TiO
2: A Review,” Recent Patents on Engineering,
Vol. 2, No. 3, 2008, pp. 157-164. doi:10.2174/187221208786306289. [3] Yalcin Y, Kilic M, Cinar Z. Fe+3-doped TiO
2: a combined
experimental and computational approach to the evaluation of visible light activity. Appl. Catal. B: Environ. 2010;99:469–477. doi: 10.1016/j.apcatb.2010.05.013.
[4] Choi.W, Termin.A.Hoffmann.M.R, J.Phys.Chem.Photobio.A203 (2009) 64-71
[5] Schwertmann.U, Cornell.R.M, iron oxides in the laboratory: Preparation and Characterization,Wiley-VCH,New York,2000. [6] Rhoton.F.E,Bigham.J.M.J, Environ.Qual.34(2005)890. [7] Mayer.T.D, Jarrell.W.M,Water Res.34(2000)3949. [8] Xiong.W,Peng.J.Water Res.42(2008)4869.
[9] Nakkad.D.R,Ezbakhe.M,BenmoussaA.A,Azizouland.T,Bakkouri.A,c ontribution to the morphological and thermal study of the diatomite’s used in the insulation Tangier, Morocco from 15th -17th November 2005,p 307-309.
[10] Osmanlioglu.A.E,Natural diatomite process for removal of radioactivity from liquid waste,Appl.Radiat Isot 65 (2007)17-20. [11] Al-Degs.Y,Khraisheh.M.A.M,Tutundji.M.F.Sorption of lead ions on
diatomite and manganese oxides modified diatomite.Water Res.15 (2001) 3724-3728.
[12] Khraisheh.M.A.M, Tutun.M.F, Water Res.35 (2001)3724.
[13] Yang.Y.X,Zhang.J.B,Yang.W.M,Wu.J.D,Chen.R.S, Adsorption properties from urokinase on local diatomite surface.Appl.Surf.Sci.206(2003)20-28.
[14] Al-Degs.Y.S,M.A.M.Khraisheh,M.F.Tutunj,Water Res.35(2001). [15] Breese.R.O.Y, 1994.Diatomite.In:Carr,D.D.(Ed.), industrial Minerals
and Rocks.SMME,Colorado,USA,pp.397-412.
[16] Frolov.Y.G, Shabanova, Molod Chikora.N.A, S.I.Koll.Zh.1983,4,818-832.
[17] Yilmaz, Ediz.B, 2008 the use of raw and calcined diatomite in cement production.Cem.Concr.Compos.30,202-211.
[18] Sahraoui.H,Absuarnadasse.S,Elkamel.K,Nadiri.A,Vakoubi.A (2003), study of catalytic activity of Moroccan Natural Diatomite in the reaction of isopropanol decomposition.
[19] Seoglu.R.K, KoksalL.F,Ciftci.E,Identification of paramagnetic radicals in irradiate natural diatomite minerals by electron paramagnetic,J.Mol.Struct.733(2005)151-154.
[20] Noumbissie.L.T, Master in chemistry 2012.Thermical behavior of obtained geopolymers using the argile.
[21] Ninla. P.L, University of Yaounde 1, Cameroon,DEA 2008.Geopolymeric reticulation of bass temperature something of aluminosilicates.
[22] Allen.S.J,Whitten,L.J.Mckay.G,Dew.Chem.Eng.Miner.process 615,231(1988).
[23] Khraisheh.M.M,Allen.S.J,Al-Ghouti.M.A (2005), elimination of dyes in wastewaters of textiles: study of physicals characteristics and adsorption of diatomaceous lands.
[24] Hamdi.B ,Kessasia.Z ,Donnet. J.B. and Wong.T.K,analytical study of physico-chemical and structural properties of a Kieselghurs during its decarbonatation,laboratory of physical chemistry ,Chemistry National School of Mulhouse,France,1998,P164-169.
[25] Wilkinson.J.P,nonlinear resonant circuit devices (Patent style).US.patent 362412, July 16, 1990.
[26] Doyle.W.D ,”magnetization reversal in films with biaxial anisotropy “in 1987, Proc Intermag. Conf. p.221-226.
[27] Bahramiam.B et Al/ Applied Catalysis A: General 345(2008) 97-103. [28] Shen.W et al / Ceramics international 39 ( 2013) 5013-5024. [29] Kongola, 1991(properties of oxides and oxyhydroxides of iron). [30] Van Der Marel and Beutespacher,1976,”properties of oxides and
oxyhydroxides of iron “.
[31] Cases et al, 1989, 1990, and 1993,”properties of oxides and oxyhydroxides of iron”.
[32] Schwertmann et Cornell, 2000, “ iron oxides in the laboratory preparation and characterization.
[33] Yezou R.; contribution à l’étude des propriétés thermiques des matériaux de constructions cohérents et non cohérents ; thèse de docteur ingénieur ; INSA de Lyon , (1978).