HAL Id: hal-01185711
https://hal.archives-ouvertes.fr/hal-01185711
Submitted on 21 Aug 2015HAL is a multi-disciplinary open access archive for the deposit and dissemination of sci-entific research documents, whether they are pub-lished or not. The documents may come from teaching and research institutions in France or abroad, or from public or private research centers.
L’archive ouverte pluridisciplinaire HAL, est destinée au dépôt et à la diffusion de documents scientifiques de niveau recherche, publiés ou non, émanant des établissements d’enseignement et de recherche français ou étrangers, des laboratoires publics ou privés.
Score distribution as a tool to reveal group dynamics in
student projects?
Claire Lassudrie, Marie-Pierre Adam, Matthieu Arzel, Antoine Beugnard,
Jean-Philippe Coupez, François Gallée, Sylvie Kerouedan, Myriam Le
Goff-Pronost, Michel Morvan, Bruno Vinouze, et al.
To cite this version:
Claire Lassudrie, Marie-Pierre Adam, Matthieu Arzel, Antoine Beugnard, Jean-Philippe Coupez, et al.. Score distribution as a tool to reveal group dynamics in student projects?. SEFI 2015 : Annual Conference of the European Society for Engineering Education, Jun 2015, Orléans, France. pp.111 -111. �hal-01185711�
Score distribution as a tool to reveal group dynamics in student
projects?
C. Lassudrie1, M.-P. Adam1, M. Arzel1, A. Beugnard1, J.-P. Coupez1, F. Gallée1, S. Kérouédan1,M. Le Goff-Pronost1,M. Morvan1, B. Vinouze1,
D. Baux2
1. Institut Mines Télécom, Télécom Bretagne, Brest, France
2. Didier Baux Communication, 1 rue du Chanoine Moreau, Quimper, France Corresponding author’s e-mail: [email protected]
Keywords: mark, individual contribution, teamwork.
INTRODUCTION
Assessing student teamwork and giving marks to a group has always been difficult for teachers (Kaufman D, 2000). How to be fair regarding the involvement of every member of the group? How to correctly evaluate the dynamics of the group, the role and contribution of each student to the team? How to distinguish genuine collective work? These are questions that are not easy to answer (Kuisma, R, 2007). The task is even harder when the work given to the students is itself intentionally complex.
At Telecom Bretagne, we want to prepare the students to face complex problems by giving them complex projects. Teachers therefore, have to deal with a marking task of equivalent complexity. An as fair as possible marking process has then to be elaborated taking into account pertinent indicators for teamwork and individual contributions. Our working hypothesis was that involving students in self and peer assessment would reveal interactions within the group, individual involvement and group adaptability, in short: the group dynamics.
This paper analyses different iterations of a marking process over a four years period, involving both students and teachers. We discuss the lessons learned from this experimentation and correlated difficulties.
1 COURSE UNIT DESCRIPTION
This course unit addresses third year students of an apprenticeship based program. During their first and second years in Telecom Bretagne, students follow basic courses and communication training in project management. So they are supposed to be able to manage simple projects at the end of their second year.
In the course unit addressed here, students have to deal with a real Customer’s request and perform a technical and economic study. Working outside the field of
43rd Annual SEFI Conference June 29 - July 2, 2015Orléans, France
their technical skills in Telecommunication / Networking/Information Technology, students have to interact with different stakeholders. These can be a Customer, the Steering Committee, a Communication Coach or Technical Experts. The pedagogical objectives of this third year course are to give the students the ability to manage Customer requirements analysis, project planning, monitoring and reporting, risk mitigation, internal and external communication, team building and human relationships in the context of a large project team.
The class is split into two large teams of about 15 students who work in parallel on the same subject. Each team acts as a virtual company and has to decide its own organisation (choice of a project leader, design of the Organisational Breakdown Structure, task estimation and distribution). For this purpose, students can benefit from the help and advice of a Communication Coach and from a Steering Committee (Le Goff-Pronost et al, SEFI 2014).
The course consists of 63 hours of face-to-face classes (conferences and tutored workshops) on one day per week over a total period of three months. In addition, students must work autonomously to comply with the strict delay constraints set by the Customer.
In order to stimulate students’ capability to deal with changing environments, uncertainty and stress, some unexpected events are triggered during the project by the Steering Committee. For instance, customer’s requirements or the project schedule can be changed or an audit imposed. During the project, each team has to produce both technical deliverables (initial specification document, intermediate report, final technical report) and methodological (project management plan, periodical dashboard and final methodological report). At the end of the project, a defence in front of the Customer and the Steering Committee summarises the main technical and methodological results achieved by the groups.
2 SCORE DISTRIBUTION AND RATING PROCESS
“It is hard to evaluate how much knowledge or skills one individual student has demonstrated from doing a group project” (Zhang B., 2009). Another difficulty in a team work is to assess individual work, individual performance and distribute the right mark to each student (Conway and al., 1993; Lejk and al., 1996; Lejk and Wyvill, 2001; Li, 2001; Johnston and Miles, 2004). So, the challenges of score distribution are to approach a fair distribution of marks, to encourage teamwork and to discourage free riders and individualistic behaviour. Giving the same mark to all group members is a conventional method. But, this can be a discouragement factor. Free riders obtain the same score as hard workers. Different methods can be used to derive an individual mark from a group assessment. (Lejk and al. 1996) review the different methods. One possibility is peer assessment (Earle, 1986, Zhang A. 2012) rather than teacher only assessment. Peer assessment involves students actively participating in their own assessment. However, some difficult choices occur: open or secret ratings, single holistic mark or derived from a combination of criteria, who gives marks to whom? (Sharp, 2006). (Kozanitis 2005) underlined the risks of the peer assessment: advantageous marks to their friends, collusion in the team for good marks, tendency to give average marks to all, influence of leaders, free-riders. All authors agree on the necessity to familiarise students with the peer assessment processes (questionnaire, grids and criteria) during the project.
In this article, we question the link between the mark given by a teacher or by peers to a student for his work in a group project and the dynamics of the group. Usually, group dynamics include the interaction process and communication, the implicit and
explicit rules and the affinities between the members. Are teachers able to understand the dynamics of a group and produce a mark which includes the value of positive or negative dynamics? In peer assessment, do students take into account what is really happening in the working group and try to distribute the scores based on this fact?
In our case, we have to assess teamwork skills, teamwork process and teamwork production. But, we are unable to observe the exact contribution of each member in a group. One reason is the large size of the group and a second is the large scope given to students to decide how they work together. However, during periodic methodology discussions, teachers invite students to report any difficulties faced with team working. Some teachers act as observers during timetable project activity. But they couldn’t assess the real participation of each student as most interactions are remote and digital. The Steering Committee asks students to mention the number of worked hours in an open dashboard. But this quantitative indicator does not necessarily include all the group dynamics dimensions. Furthermore, students have to fill individual questionnaires about project management and communication skills before and after the unit. They also have to write personal reports on their experiences in this project. They analyse their difficulties, skills progression, roles and make their own participation assessment for the project. The following issues were mentioned by the students: role of the different stakeholders, quality of internal and external communication, motivation, human relationships, excessive or unequal workload and capacity to gain new skills. The aim of this student feedback is to enable the students and teachers to analyse the skills evolutions.
We choose to let each team allocate individual marks from the team score given by the Steering Committee. This rule is given at the beginning of the project and teachers do not take part in negotiations and do not change any mark. This unique mark is a mean value from different scores from the final report, the defence for both technical production and project management. It is mandatory that the group keeps the same average mark given by the Steering Committee. Students must choose their own algorithm for individualised mark distribution. They have the possibility not to differentiate scores between the team members even though this would mean free riders would not be punished.
3 SCORE DISTRIBUTION PROCESS OVER FOUR YEARS
We have observed eight groups (from GrA to GrH) over four consecutive years. At the beginning of the first year (year1), the Steering Committee had not yet decided to offer to the students the opportunity to redistribute the score at the end of the project. Consequently, all the group members whether deeply involved project manager or free riders got the same mark. This appeared to us unfair. We then suggested to the groups they could be allowed to distribute or not the group score with their own algorithm. From questionnaires over the last two years, Table 1 shows that most of the students agree with the principle of score distribution.
Table 1. Students’ opinion on score distribution (in %) Year Do not at all agree Not agree Agree Completely agree
year3 11,8 23,5 47,1 17,6
43rd Annual SEFI Conference June 29 - July 2, 2015Orléans, France
3.1 The groups that did not distribute their scores
For both GrA and GrB on year 1, the score distribution proposal was only suggested to students at the end of the course. During the students vote to choose whether the distribution could be applied or not, the least involved students, who were the majority, voted against. To explain their vote, they argued, not without reason that it was not in the original contract.
Since that first experience, we have replayed this course three times (year2, year3 and year4) with six groups in all (GrC-GrD, GrE-GrF-and GrG-GrH respectively). Among these six groups, three did not distribute their scores (GrC, GrE and GrG), so one group per year. The reasons for this choice are variable. For GrC in year2, the score of 16/20 was not distributed to avoid conflicts in the group since the project was well assessed and overall well managed. For GrE in year3, the project started very badly in terms of organisation. Consequently, the Steering Committee conducted an audit of the group revealing a lack of leadership, poor delegation of tasks and low group cohesion. After this, the group reacted well and set up a new and effective organisation. The new growing momentum continued until the end of the project and GrE did not want to break this new dynamic by distributing their final score of 12.5/20. Finally, GrG on year4, did not distribute their mark 14.5/20 to avoid disputes within the group, as for GrC.
3.2 The groups that distributed their scores
On the contrary, GrD, GrF and GrH distributed their score using the different distribution algorithms described below.
In year2, GrD had a score of 17/20 thanks to a good group dynamics and excellent technical work. For the distribution, some students told the project manager they agreed to give him some of their own marks. He then proposed that each student distribute three half points to the persons of his choice. This redistribution, accepted by all, resulted in assigning ratings of 21/20 to the project manager. Finally, he reserved a personal score of 19.5 and redistributed the additional 1.5 points to his worthy colleagues. At the end of the process, the variation ranged from -1 to +2.5 points for this positive score distribution.
GrF in year3 had a score of 14/20 justified by strong management and a rather good level technical study. In fact, GrF organisation was based on a quality leadership from both the project manager and work package leaders. The rest of the group had simply carried out the tasks requested by the managers. At the end of the module, the project manager and work package leaders decided to distribute the scores. So, they gave themselves extra points and consequently, removed some points from the basic contributors. Finally, the process was announced to the group which accepted this authoritarian redistribution. The mark modifications ranged from -2 to +1.8 points. Finally, GrH in year4 had a score of 14/20 with a medium efficient communication but reasonably good technical study. GrH chose to distribute the final score because some members of the group reported that one student did not meet the group charter. This document was established and signed by all members at the beginning of the project. It seemed that, despite warnings by the project manager, this student had not produced the desired quality of work within the allotted time. According to the charter, the student had to be penalised. The project manager did not know how to handle this stressful situation. He discussed with the Steering Committee who advised him to base his decision on facts in order to punish fairly. The meeting for the score distribution was a kind of court which judged this student on his activity in the project but also on his history well before the project. This court severely penalised the student by removing 5 points so that the student failed the module. After discussion with the stakeholders, the Steering Committee found that this
student has been stigmatised for his previous behaviour and that the penalty of 5 points was not justified. Note that some of the other students in the group had not completed their work on time and were not troubled by the court. Given the magnitude of the sanction, the project manager personally decided to give 1 point from his own account to the student. Finally, the variation ranged from -4 to +1 points which showed the sanction applied to the offending student.
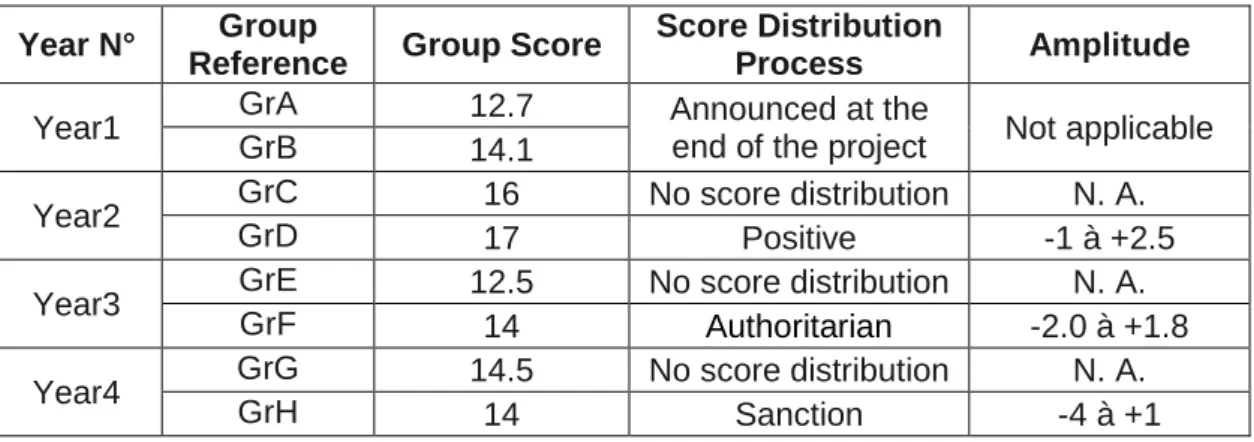
Table 2 summarizes the results about score distributions in the last three years.
Table 2. Groups score distributions
Year N° Group
Reference Group Score
Score Distribution
Process Amplitude
Year1 GrA 12.7 Announced at the
end of the project Not applicable
GrB 14.1
Year2 GrC 16 No score distribution N. A.
GrD 17 Positive -1 à +2.5
Year3 GrE 12.5 No score distribution N. A.
GrF 14 Authoritarian -2.0 à +1.8
Year4 GrG 14.5 No score distribution N. A.
GrH 14 Sanction -4 à +1
4 DISCUSSION 4.1 Analysis
Initially, this post-project score distribution was proposed to give freedom to students to adjust the teachers perception and assessment. Since the average score must remain unchanged, we do not promote score distribution as a tool to motivate students or boost group dynamics. We may have naively expected that the way students apply adjustment would have given obvious feedback on communication processes or evolution of group organisations that were not simple to observe.
The variations shown in Table 2 are an image of score distribution modes. We qualify as positive the GrD distribution that leads to higher gains for some students than losses for the majority (negative scores). This means that the most involved students were rewarded by the group. GrF, which distributed scores with an authoritarian mode, achieved symmetry between gains and losses. Finally the penalty in GrH is made visible by the imbalance between the loss of a single student and the gains of the majority. We could expect that these different score distribution modes can be easily correlated with specific group dynamics,
Indeed, in two groups, the score distribution process mirrored the group evolution. In GrD, the success was due to a strong involvement of the leaders and a good communication process between team-mates, acknowledging the merits of each other. In GrF, the organisation evolved to an authoritarian one, where leaders decide and subalterns obey. In both cases, score distribution put increased stress on the team organisation resulting from the group dynamics.
However, score distribution is not a simple tool. A group can show excellent dynamics and yet choose not to apply score distribution. In GrE, score distribution clearly confirmed the cohesion and solidarity the group finally achieved after facing and overcoming difficulties together. Nevertheless, choosing to apply the same score to every team member can still be a way to hide failures and thus the fact that they do benefit from positive group dynamics. It is not necessarily the result of strong solidarity within the group as in GrE! For instance, GrC and GrG equally shared their
43rd Annual SEFI Conference June 29 - July 2, 2015Orléans, France
score, even though the group dynamics were far from perfect. In both cases, score distribution was not used even if teachers expected it.
Score distribution can be a complementary and efficient tool if the students clearly explain their choices. They must clearly justify why they do or do not distribute the group score. If they distribute, they must explain the distribution method and the motivation. This exercise can be a catharsis and reveal tensions that were kept secret. This was clearly the case in GrH until they had to distribute the score. Indeed, one student was the victim of the score distribution due to conflicts that were not all related to the project. Was this student used as a scapegoat or the result of long-term resentment? This was not obvious all along the project and was clearly revealed by the score distribution. This particular case highlighted the fact that a final approval by the teachers is mandatory to avoid abusive score distributions. Students and teachers both gain of useful feedback from this experience. We plan to systemise discussions about their score distribution process in future projects.
4.2 Lessons learned and perspectives
After 4 years and 8 different groups we conclude that the result of the score distribution reveals no major information about the group dynamics. It is the decision itself to distribute and its associated process that seem most important.
The main limit of score distribution concerns a typical students’ behaviour: they want to give a good image of themselves and thus, generally try to hide internal conflicts or flaws. Thus, a simple use of score distribution is not sufficient. On the other hand, an observation of the mark distribution process selection and the discussions about the chosen arguments are full of teachings.
The reasons for the rejection of score adaptation are many: equality, equity, simplicity, avoidance of conflict, desire to hide problems and to highlight cooperation. The reasons for score adaptation are also many: reward a posteriori, incentive a priori, research of equity, but also punishment. We have not perceived any correlation with ease or difficulty of the project. The way mark adjustment is used seems to indicate the dominating state of mind at the end of the project: desire for peace, finding scapegoat, acknowledging efforts, etc. Whatever the final student decision, the Steering Committee can never be sure consensus was actually reached within the group.
Allowing students to distribute their score was naively introduced to try and reveal some aspects of the group dynamics. Actually, it opened a Pandora's box. The process has revealed behaviours that students will have to face as future managers: evaluate and be evaluated. We realised that assessment is not part of our training objectives and is seldom an objective of other courses in Telecom Bretagne. Our scoring distribution approach gives students the opportunity to discuss assessment and, for the more mature among them, identify the ethical values they want to apply during the process and the steps they must take to defend these values.
We plan to expand the current learning outcome targets with an assessment issue. The score distribution exercise seems to be a good opportunity for this. Our four years of observation have given us a basic material for discussion with students after the analysis of their own process. We can also rely on student's experience since as apprentices they may encounter assessment situations in their placement companies. The main goal is to help students to better understand themselves and stakes, thanks to discussions about the different ethical values and their impact on group dynamics. The students have to be well prepared for this complex role of a manager required to assess his subordinates yearly since this assessment often
conditions salaries. Indeed, an incorrect use of assessment can trigger deep frustration and dangerously degrade group dynamics.
CONCLUSION
Improving workgroup assessment has been a constant concern for the Steering committee of the complex project course. Mixing classical teacher's assessment with more innovative peer assessment has definitely given a richer and more accurate insight of the group dynamics. Nevertheless, it has side effects that need to be managed. A performance measurement system strongly influences the way students work. So the group dynamics are largely dependent on the way students feel evaluated. As a consequence, introducing peer assessment gives more autonomy to students group on one hand but also gives them a powerful tool to influence directly their own organisation and dynamics. It is also an individual tool to favour introspective evaluation regarding personal involvement. We aim to educate future managers who will have to motivate teams, reward merit, fairly penalise and negotiate objectives and trade-offs.
Even if students agree on peer assessment and score distribution, this agreement does not give the solution by itself. The methodology and ethics of the score distribution seem more important than the result itself. Guaranteeing fairness in score distribution cannot be done without external intervention - i.e. a teacher-. Over four years, the full assessment mechanism has been improved but has also highlighted this fact. The trade-off between careful but sometimes intrusive teacher monitoring on one side and student autonomy on the other side is still to be looked for.
ACKNOWLEDGMENTS
The authors would like to thank the Executive Committee of Telecom Bretagne. Many thanks to P.Friedel for valuable discussions and strong involvement in this training. A special thanks to K. Heggarty for reviewing this paper.
REFERENCES
Kaufman D and al. (2000), Accounting for individual effort in cooperative learning teams”, Journal of Engr. Education, Vol. 89, No. 2, pp. 133-140. Kuisma, R. (2007), Portfolio assessment of an undergraduate group project, Assessment and Evaluation in Higher Education, Vol. 32, No. 5, pp. 557-569. Le Goff-Pronost M. and al. (2014). “Introducing complexity into project management through multi-stakeholders interactions”. In SEFI Conference, Session Active Learning, Birmingham September, Published by SEFI aisbl, ISBN N°: 978-2-87352-010-6, p 135-142
Zhang B. and al (2009), How to assign individualized scores on a group project: an empirical evaluation, Applied measurement in education, Vol. 22, pp. 290-308.
Conway and al. (1993), Peer assessment of an individual’s contribution to a group project, Assessment and Evaluation in Higher Education, Vol. 18, pp. 45-54.
43rd Annual SEFI Conference June 29 - July 2, 2015Orléans, France
group assessments, Assessment and Evaluation in Higher Education, Vol. 21, pp. 267-280.
Lejk M. and al (2001), The effect of the inclusion of self-assessment with peer assessment of contributions to a group project: a quantitative study of secret and agreed assessments, Assessment and Evaluation in Higher Education, Vol. 26, pp. 551-561.
Li, L.K.Y. (2001), Some refinements on peer assessment of group projects, Assessment and Evaluation in Higher Education, Vol. 26, pp. 5-18.
Johnston L. and al (2004), Assessing contribution to group assignments, Assessment and Evaluation in Higher Education, Vol. 29, pp. 751-768.
Earle S.E. (1986), Staff and peer-assessment - measuring an individual’s contribution to group performance, Assessment and Evaluation in Higher Education, Vol. 11, No. 1, pp. 60-69.
Zhang A. (2012), Peer assessment of soft skills and hard skills, In Journal of Information Technology Education: Research, Vol 11, pp. 155-168.
Sharp S. (2006), Deriving individual student marks from a tutor’s assessment of group work, Assessment and Evaluation in Higher Education, Vol. 31, No. 3, pp. 329-343.
Kozanitis A. (2005), L’évaluation du travail en équipe, Ecole polytechnique, bureau d’appui méthodologique, Montréal.
Goldfinch, J. (1994), Further developments in peer assessment of group projects, Assessment and Evaluation in Higher Education, Vol. 19, No. 1, pp. 29-35.